Graphing Quadratic Functions in Vertex or Intercept Form


- Slides: 22
Graphing Quadratic Functions in Vertex or Intercept Form Key Words • vertex form • intercept form • minimum value • maximum value
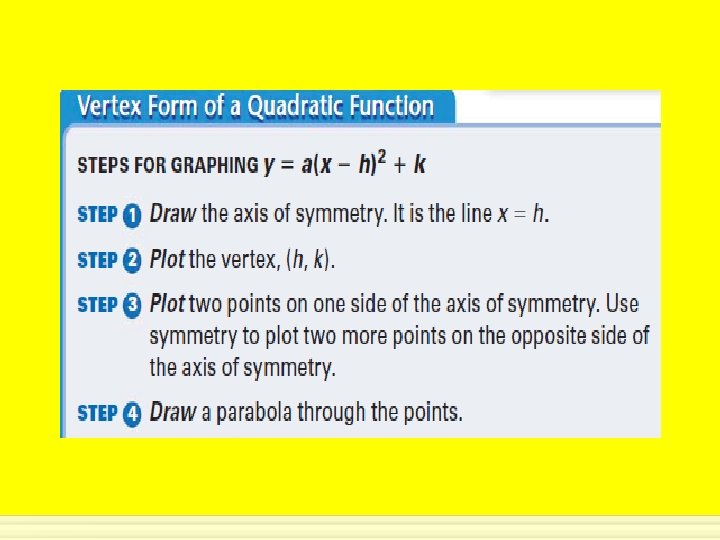
Example 1 Graph a Quadratic Function in Vertex Form Graph y = – 2( x – 2 )2 + 1. SOLUTION The function is in vertex form y = a ( x – h)2 + k where a = – 2, h = 2, and k = 1. Because a < 0, the parabola opens down. STEP 1 Draw the axis of symmetry, x = h = 2. STEP 2 Plot the vertex, ( h, k ) = ( 2, 1). STEP 3 Plot points. The x-values 3 and 4 are to the right of the axis of symmetry.
Example 1 Graph a Quadratic Function in Vertex Form y = – 2( 3 – 2 )2 + 1 = – 1 One point on the parabola is ( 3, – 1 ). y = – 2( 4 – 2 )2 + 1 = – 7 Another point on the parabola is ( 4, – 7 ). Plot the points ( 3, – 1 ) and ( 4, – 7 ). Then plot their mirror images across the axis of symmetry. STEP 4 Draw a parabola through the points.
Example 2 Graph a Quadratic Function in Intercept Form Graph y = ( x + 1) ( x – 3). SOLUTION The function is in intercept form y = a ( x – p) ( x – q ) where a = 1, p = – 1, and q = 3. Because a > 0, the parabola opens up. STEP 1 Draw the axis of symmetry. The axis of symmetry is: p+ q – 1 + 3 x = = =1 2 2
Example 2 Graph a Quadratic Function in Intercept Form STEP 2 Find and plot the vertex. The x-coordinate of the vertex is x = 1. Calculate the y-coordinate of the vertex. y = ( x + 1) ( x – 3) = ( 1 + 1) ( 1 – 3) = – 4 Plot the vertex ( 1, – 4 ). STEP 3 Plot the points where the xintercepts occur. The x-intercepts are p = – 1 and q = 3. Plot the points ( – 1, 0 ) and ( 3, 0 ).
Example 2 Graph a Quadratic Function in Intercept Form STEP 4 Draw a parabola through the points.
Checkpoint Graph a Quadratic Function Graph the function. Label the vertex and the axis of symmetry. 1. y = ( x – 3 )2 – 1 ANSWER
Checkpoint Graph a Quadratic Function Graph the function. Label the vertex and the axis of symmetry. 2. y = – ( x – 2)2 + 3 ANSWER
Checkpoint Graph a Quadratic Function Graph the function. Label the vertex and the axis of symmetry. 3. y = 2 ( x + 1)2 + 4 ANSWER
Checkpoint Graph a Quadratic Function Graph the function. Label the vertex and the x-intercepts. 4. y = ( x – 3) ( x – 7) ANSWER
Checkpoint Graph a Quadratic Function Graph the function. Label the vertex and the x-intercepts. 5. y = – ( x – 2) ( x – 5) ANSWER
Checkpoint Graph a Quadratic Function Graph the function. Label the vertex and the x-intercepts. 6. y = 2( x + 1) ( x – 3) ANSWER
Example 3 Find the Minimum or Maximum Value Tell whether the function y = – 4( x + 6) ( x – 4) has a minimum value or a maximum value. Then find the minimum or maximum value. SOLUTION The function is in intercept form y = a ( x – p) ( x – q) where a = – 4, p = – 6, and q = 4. Because a < 0, it has a maximum value. Find the y-coordinate of the vertex. p + q – 6 + 4 x = = – 1 = 2 2 y = – 4( x + 6) ( x – 4) = – 4 (– 1 + 6) (– 1 – 4) = 100
Example 3 Find the Minimum or Maximum Value ANSWER The maximum value of the function is 100.
Example 4 Using a Quadratic Function Civil Engineering The Golden Gate Bridge in San Francisco, CA, has two towers. The top of each tower is 500 feet above the road. The towers are connected by suspension cables. Each cable forms a parabola with 1 ( x – 2100 )2 + 8 where x and y are y the equation = 8690 measured in feet. a. Find the height of the cable above the road, when the cable is at the lowest point. The road is represented by y = 0.
Example 4 Using a Quadratic Function b. What is the distance d between the towers? SOLUTION The function is in vertex form where 1 a = , h = 2100, and k = 8. 8690 a. The vertex is ( h, k) = ( 2100, 8 ). The height of the cable at its lowest point is the y-coordinate of the vertex. So, the cable is 8 feet above the road.
Example 4 Using a Quadratic Function b. The vertex is 2100 feet from the left tower. The axis of symmetry passes through the vertex. So, the vertex is also 2100 feet from the right tower. The distance between the towers is 2100 + 2100 = 4200 feet.
Checkpoint Find the Minimum or Maximum Value Tell whether the function has a minimum or maximum value. Then find the minimum or maximum value. 1 7. y = ( x + 8)2 – 12 2 ANSWER minimum; – 12 8. y = 3( x – 4) ( x – 7) ANSWER minimum; – 9. y = x( x + 4) ANSWER minimum; – 4 27 4