Graphing Notes Variables Independent Variable the variable that

Graphing Notes

Variables Independent Variable • the variable that we change in the experiment (what you know before the experiment). • Always on the x-axis! Dependent Variable • the thing that we measure in the experiment (what you don’t know before the experiment). • Always on the y-axis!


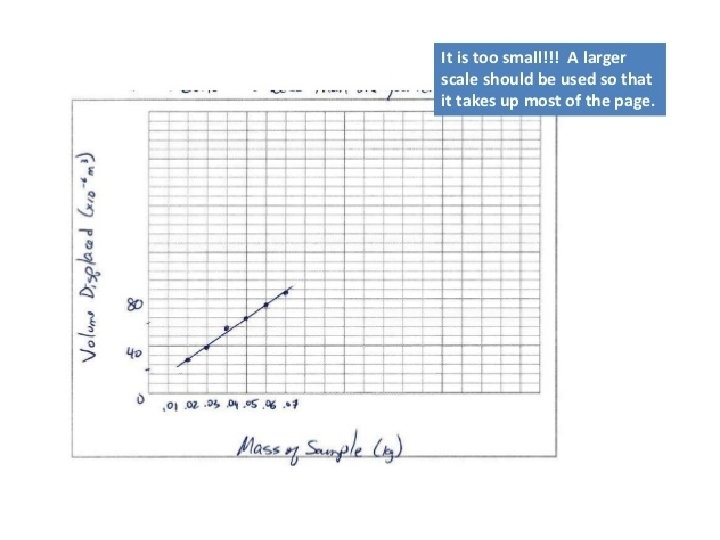
Scale • Scale is needed to make sure that the information on the graph is readable. • Your graph MUST fill nearly the whole area. • Numbers MUST be evenly spaced.

Title • Give the graph a title to tell the reader what the graph is showing. • The title is usually placed in the center above the graph. • The title of the graph should be in terms of what the x and y axes represent. • The proper form is “y-axis variable vs. x-axis variable. ” – For ex. , “Distance vs. Time”

Axes • Label axes to tell what is being measured. – Include units in brackets if needed.

Legend • A graph with more than one set of data needs a legend (key) – It will identify what the symbol or color means

Properly Formatted Line Graph:

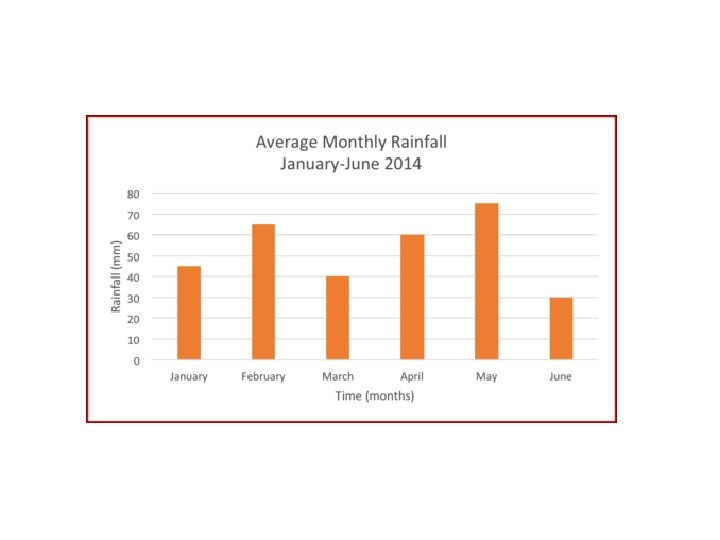
Properly Formatted Bar Graph:

Line of Best Fit • a. k. a. trendline • an educated guess about where line might fall in a set of data plotted on a scatter plot • try to have approximately the same number of points above and below the line
- Slides: 12