GRAPHING GRAPHING Background Scientist interpret tables graphs and

GRAPHING

GRAPHING Background • Scientist interpret tables, graphs, and diagrams to locate data, examine relationships in the data, and extend those relationships beyond the data. • Reading graphs can be like reading a foreign language though. It come easy to some and very difficult to others.

GRAPHING So, Quick Review…. What Are The Parts Of A Graph?

GRAPHING What Are The Parts Of A Graph? Y- s i x A Title X-Axis

GRAPHING Where Are The Variables Plotted?

GRAPHING What Are The Parts Of A Graph? = is x A Y DV Title = DV vs. IV X-Axis = IV

GRAPHING In Looking At How To Read Graphs, Tables, and Data When It Comes to the ACT…. • First We Need To Understand The Core Elements Of A Graph 1. The importance of labels 2. How to uses axes 3. What to do with the units of measure

GRAPHING v The Importance of Labels § Labels are VERY important on the ACT Science sections. § Each visual is labeled with a figure plus a number. § So, if there are three 3 visuals, they will be labeled Figure 1, Figure 2, and Figure 3.

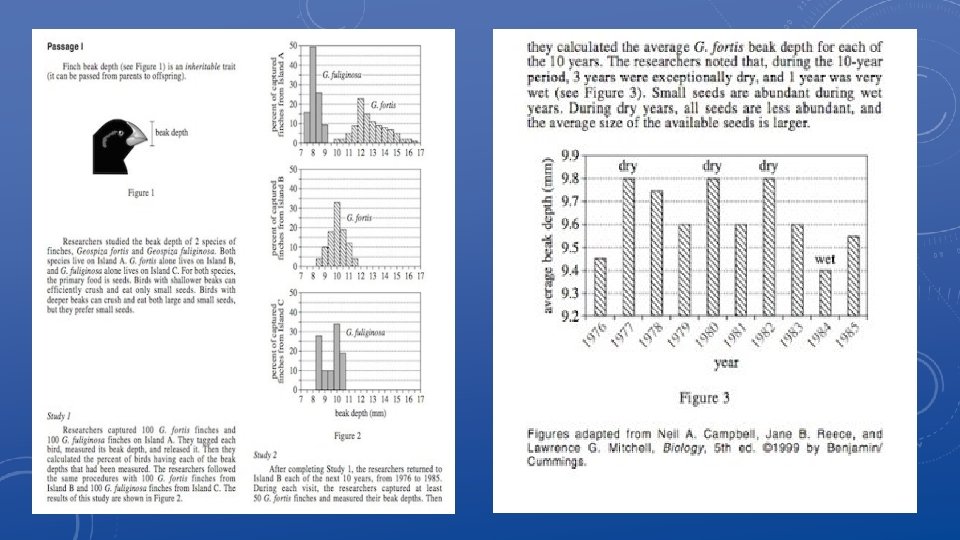
GRAPHING v. The Importance of Labels § The labels help you to refer to the correct figure. ** Although many students still don’t look at the right visual** § Some questions will often specifically tell you which figure to look at. ** Example: In Figure 2, what percent of captured finches from Island C have a 10 mm beak depth? • To correctly answer this question, you need to check the labels and make sure you are looking at Figure 2. Then, identify the graph that shows the finches from Island C.

GRAPHING v The Importance of Labels • THE FIRST STEP IN MOST ACT SCIENCE QUESTIONS IS TO READ THE LABEL, BECAUSE IF YOU GET THIS STEP WRONG, YOU WILL GET THE ANSWER WORNG.

GRAPHING v How To Use Axes • Axes are useful to figure out the control and the variable(s) in the experiment. • Graphs we know by definition have an x-axis and y-axis. • The x-axis is the horizontal line (usually on the bottom), and an y-axis the vertical line (usually on the left side of the graph). • Although, more challenging graphs on the ACT Science will have on the left and one on the right.

GRAPHING
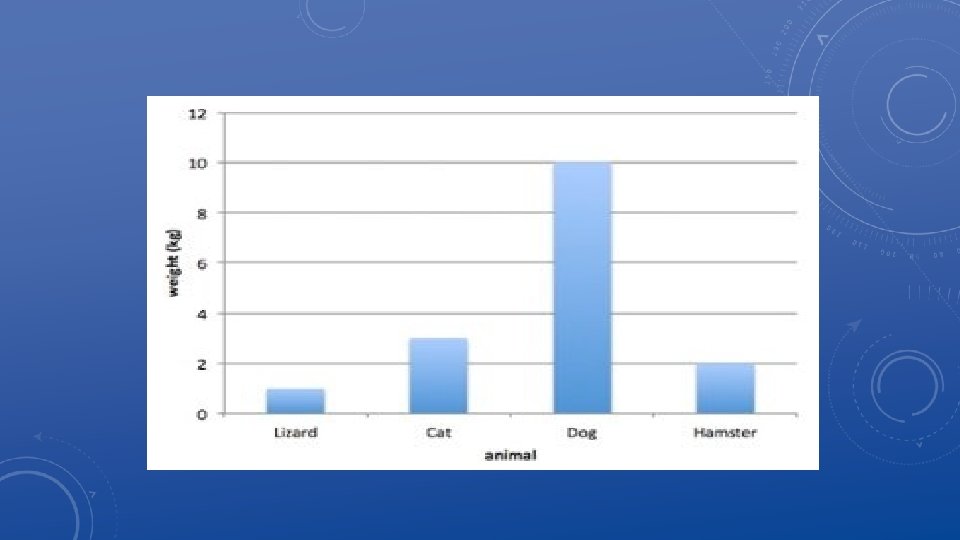

GRAPHING v How To Use Axes • In this graph, the x-axis doesn’t measure anything (only list the animals). • The y-axis measures the animals’ weights. The animals’ weight would be considered the variable in the research. • We can use this graphs to compare the 4 elements of only one data set: the weights of the animals. • What if the passage that went along with this graph had asked you, ØWhat is the weight of the dog?

GRAPHING v How To Use Axes • Now lets look at a slightly more complicated graph you may see on the ACT Science section.

GRAPHING v How To Use Axes • In this graph, the x-axis measures the distance from the center of the plot to the nearest clearing. • The y-axis measures the average change in AGTB (it’s not important that we understand what AGTB is) • Which one of these would be considered the “dependent variable” in the research? • You can use this graph to compare the distance from the center of the plot to the nearest clearing to the average change in AGTB

GRAPHING v How To Use Axes • What if the passage that went along with this graph asked you ØWhat is the average change in AGTB at a distance of 50 m from the center of the plot to the nearest clearing? § To do this you first need to find 50 on the axis that defines the distance from the center of the plot to the nearest clearing, which is the x-axis. § Next, we look on the y-axis for the value of the average change in AGTB and see that it reads 5 t/yr.

GRAPHING v What To Do With Units of Measure § On graphs on the ACT Science section, they will present units of measure for each axis next to the label. § Don’t try to understand what the units mean. § The ACT throws in these crazy, weird units that you won’t have seen unless you studied very high-level Physics or Chemistry. § You do not need to know exactly what they refer to in order to answer the questions.

GRAPHING v What To Do With Units of Measure § For example, take the graph previous graph. § While you probably know that m is meters, you may be unfamiliar with t/yr. § For the Science section of the ACT the units are listed in the answer choice, they match up to the units shown in one of the visuals or mentioned in the passage. § So, there is no need to dwell on them or stress out over them.

GRAPHING

GRAPHING v What To Do With Units of Measure § Another thing, out of all the ACT Science practice sections I have seen they NEVER ask you to convert the units form one form of measurement to another. § The ACT includes these crazy units to make the graphs look more challenging or to test your ability to sort information that you may not know. § Ignore what you don’t need and find the information to answer the question. Focus on what you can identify.

GRAPHING What Types of Data Are Recorded and What Methods Are Used? • The experimental design that a scientist selects depends on what information the scientist hopes to gain. • Scientific research can be classified into one of two main types, quantitative (numerical) or qualitative (descriptive). • Scientist recognize that organization of data from experiments helps them to better understand their results. • The data may be presented in charts, tables, diagrams, or graphs.

GRAPHING What Are The Steps To Take In Constructing A Graph? 1. Determine which variable is the dependent variable and which is the independent variable. 2. A graph consist of two principle lines called axes, that lie at right angles to each other. The independent variable is plotted on the x-axis, and the dependent variable is plotted in the y-axis. 3. Title your graph and label both axes. The units of measurement must be shown. 4. The axes must be properly scaled. Numbers increase across the horizontal and vertical axes from the zero point. 5. The numbering scale must include both the smallest and largest values.

GRAPHING v. The Different Types of Graphs on the Science Section 1. Reading bar graphs 2. Analyzing scatter plots 3. Using line graphs 4. Pulling data from tables 5. Deciphering tricky graphs

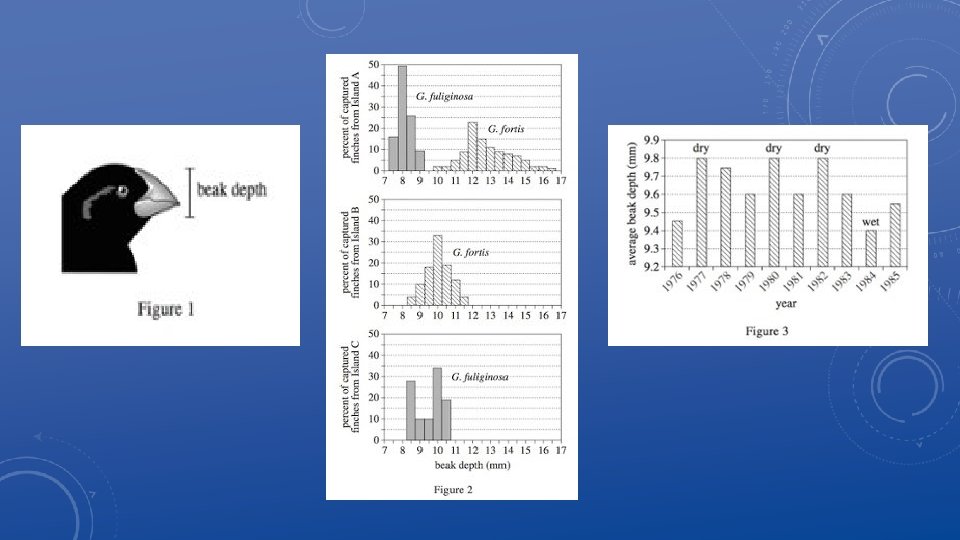
GRAPHING v. Reading Bar Graphs § Bar graphs are used to show a comparison of multiple objects. § Bar graphs tend to be one of the easier visuals used by the ACT Science section. § They are easier because there will only be ONE variable shown.

GRAPHING v Reading Bar Graphs § In this graph, the x-axis lists the years. § The y-axis measure the average beak depth, the variable in this research. § What if the passage that goes along with the this graph asked you Ø What is the average beak depth in 1983?

GRAPHING v Reading Bar Graphs § First, you need to find 1983 on the x-axis. § Next look on the y-axis for the value of the average beak depth and see that it reads 9. 6 mm. § Bar graphs are really easy, as long as you make sure you have identified the correct bar, you will find the data you need.

GRAPHING v Scatter Plot § Scatter plots are graphs of plotted points that show the relationship between two sets of data. § Example: What is the average cumulative percent change in AGTB during Year 2? § To answer this question what do we need to do?

GRAPHING v Scatter Plot § Scatter plots can be slightly more challenging if they ask you a question about a point not marked. § Example: What is the average cumulative percent change in AGTB during year 9? § When answering these type of trend questions draw out the curve on the graph you are given and then use the process of elimination.

GRAPHING v Line Graphs § Line graphs are used to show the relationship between variables. § Line graphs are one of the harder types of visuals used on the ACT Science section. § The reason being is because they show an infinite number of data points, and you need to be exact on which data point you’re looking at. § Also, the ACT often uses line graphs to show 2 entirely different sets of data, one on the left and one on the right with a key to differentiate between the two lines.

GRAPHING v Line Graphs § Example: This graph has two lines represented and two independent groups of information. Also, each line has its own range of measurements. 1. What does the x-axis show? 2. What is the RCRF in January 1990?

GRAPHING v Line Graphs § First, you must make sure you are looking at the correct line. Ø According to the key, which line represents RCRF? § Next, you need to match it up to the measurement on either the right or left. Ø Which side represents RCRF in %? § In order to ensure you are looking at the right point of intersection you may want to use your paper or pencil to create a straight line.

GRAPHING v Line Graphs

GRAPHING v Line Graphs § Key strategies to remember with line graphs are: Ø Identify the correct line Ø Match it up to the correct measurement on the left or right Ø Draw the point of intersection

GRAPHING Accepted Guidelines For Constructing A Table 1. The title of the data table should clearly communicate the purpose of the experiment. 2. The independent variable is recorded in the left column. 3. The dependent variable is recorded in the right column. 4. When repeated trials are conducted, they are recorded in subdivisions of the dependent variable column. 5. When recording data in a table, the values of the independent variables are ordered from smallest to largest.

GRAPHING v Tables § Tables are one of the easier types of visuals provided. § There a number of columns, and each entry in a column corresponds to the entry directly to the right or left of that entry in the same row.

GRAPHING v Tables § Key strategies to remember with tables: Ø Identify the correct column in question Ø Find the correct data point in question Ø Look to the right or left of it in the same row to find the matching data point § Some tables on the ACT will have many rows and columns of data, but the technique is always the same.

GRAPHING v Tricky Graphs § These graphs are not what they seem § A lot of lines with confusing labels § Example: Which of the following absorbed the most light across all wavelengths? A. White S C. Red S B. Orange S D. Brown S

GRAPHING v Tricky Graphs § First, you need to look at the graph. There are 5 lines and each one represents a different color of light plus Sulfur Oxide. § Each graph represents the reflectance at each wavelength. § This ACT question is asking you for which substance absorbed the most light across all wavelengths.

GRAPHING v Tricky Graphs § If we were to break down this question: § First, we would need to know that “absorb the most light” means the opposite of reflectance, BUT reflectance is what is graphed. § Second, “across all wavelengths” means you’re not just looking at one point on the x-axis; you’re looking across all points.

GRAPHING v. Tricky Graphs § If you were rushed and not paying attention you might answer White S because you see it reflects the most light across all wavelengths. § However, knowing that absorbance is the opposite of reflectance and looking across all wavelengths, you would see that Brown S is reflecting the least across all wavelengths. § Therefore, it is absorbing the most, so the best answer would be Brown S.

GRAPHING v. Tricky Graphs § Other tricky graphs may look like this: § This graph is even more complex. There are intersecting lines of different shapes and regions enclosed by lines. § Although there a lot of weird things going on in this graph you approach it just like any other graph one thing at a time.

GRAPHING v. Tricky Graphs § Let’s say the ACT question asked: § Example: Which of the following would most likely NOT be found at a pressure of 10 kb? A. Facies A C. Facies G B. Facies C D. Facies E

GRAPHING v. Tricky Graphs § First you need to look at the graph and notice that there are 7 Facies identified. § The graph shows the pressure, depth, and temperature at which these 7 Facies appear. § The question asked us for which of the following is NOT found at a pressure of 10 kb.

GRAPHING v. Tricky Graphs § First, you should notice that there are two variables plotted on this graph. You were asked about pressure so that means you need to use the left y-axis. § Second, you need to find 10 kb. § Then, because the question asked what is likely NOT found at a pressure of 10 kb it is recommend you draw a line across the graph at 10 kb

GRAPHING v. Tricky Graphs § When you do this you can see that Facies C, G, and E all are found at 10 kb, but Facies A is not. § Again, if you were rushed or not paying attention you might choose Facies C, G, or E as the answer because you missed the word NOT, or you might accidentally look at a depth of 10 km on the right instead of pressure.

GRAPHING v. Tricky Graphs § Key strategies to remember with tricky graphs: Ø Always compare what you are being asked to what the graph actually shows Ø Always make sure you have found the correct axis in question ØBe extra careful when you see a NOT or EXCEPT

GRAPHING Scientific Graphing • Most scientific graphs are made as line graphs. There may be times when other types would be appropriate, but they are rare. • The lines on scientific graphs are usually drawn either straight or curved. These “smoothed” lines do not have to touch all the data points, but they should at least get close to most of them. They are called best-fit lines.

GRAPHING Predicting Data On A Graph • Graphs are a useful tool in science. The visual characteristics of a graph make trends in data easy to see. • One of the most valuable uses for graphs is to "predict" data that is not measured on the graph. • Extrapolate: extending the graph, along the same slope, above or below measured data. • Interpolate: predicting data between two measured points on the graph.

GRAPHING Directly Proportional and Indirectly Proportional Graphs 1. Directly Proportional: As the independent variable increases, the dependent variable increases as well. 2. Inversely (Indirectly) Proportional: As the independent variable increases, the dependent variable decreases.

GRAPHING Types of Relationships Between Variables 1. Direct: As X increases Y increases

GRAPHING Types of Relationships Between Graphs 2. Indirect: As X increases Y decreases

GRAPHING Types of Relationships Between Graphs 3. Constant: As X increases Y remains the same

GRAPHING Types Of Graphs Pie graphs are used to compare the parts of a whole.

GRAPHING v. Recap § Key strategies to remember: Ø Read labels very carefully. Make sure you are looking at the correct Figure Ø Remember the basics: what the axes represent, how the data points are depicted, how to go step by step to the value you need Ø All of the same rules apply to tables, bar graphs, scatterplots, line graphs, and tricky graphs Ø Don’t try to understand the units of measure

GRAPHING • Practice problems found in Foundations of Science Folder under Graphing Practice Problems
- Slides: 58