Graphing Graphing a Circle graph also called pie

 Used to show parts of a")


- Slides: 29
Graphing
Graphing a. Circle graph (also called pie chart) Used to show parts of a fixed whole. Usually parts are labeled as percents with the circle representing 100%.
Graphing b. Bar graph- good for showing quantitative data or data that you can count at exact intervals
Graphing �Line graph- good for showing relationship between two variables Independent variable is plotted on the X axis Dependent variable is plotted on the Y axis Best fit line is drawn so that as many points fall above the line as below
Graphing �Directly related Positive slope As X increases, Y increases
Graphing �Inversely related Negative slope As X value increases, Y decreases
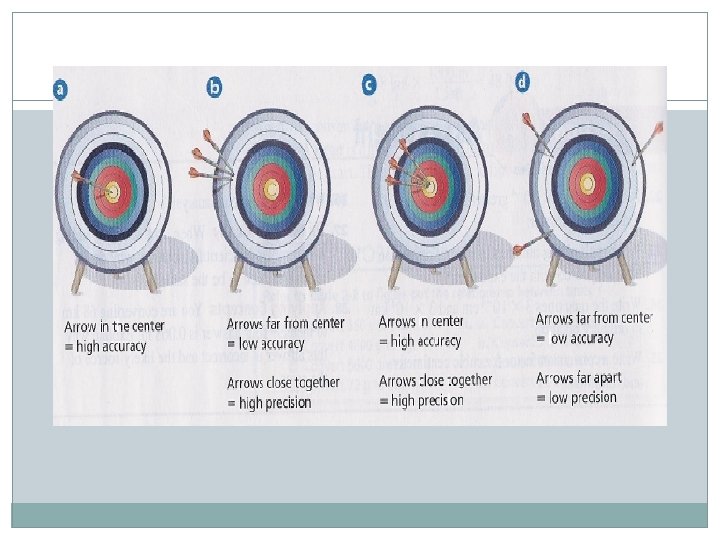
Reliable Measurements �Accuracy refers to the closeness of the measure value is to the accepted, or real, value. �Precision refers to how close a series of measurements are to one another.
is calculated by subtracting the from the value. � value
�Error is calculated by subtracting the experimental value from the accepted value.
�The value. is the ratio of an error to an accepted
�The percent error is the ratio of an error to an accepted value.
% error = error x 100 = accepted value – experimental value x 100 accepted value
Example �An experiment finds the density of lead to be 10. 95 g/cm 3. The literature value for the density of lead is 13. 34 g/cm 3.
An experiment finds the density of lead to be 10. 95 g/cm 3. The literature value for the density of lead is 13. 34 g/cm 3. The error: accepted value – experimental value= � 13. 34 – 10. 95 =
An experiment finds the density of lead to be 10. 95 g/cm 3. The literature value for the density of lead is 13. 34 g/cm 3. The error: accepted value – experimental value= � 13. 34 – 10. 95 = 2. 39
The error: accepted value – experimental value= � 13. 34 – 10. 95 = 2. 39 The % error: error x 100 = accepted value 2. 39 x 100 = 13. 34
The error: accepted value – experimental value= � 13. 34 – 10. 95 = 2. 39 The % error: error x 100 = accepted value 2. 39 x 100 = 17. 9% 13. 34
Practice �Sara’s lab shows the atomic mass of aluminum to be 28. 9. What is her percent error if the accepted value is 27. 0?
Practice �Sara’s lab shows the atomic mass of aluminum to be 28. 9. What is her percent error if the accepted value is 27. 0? � 28. 9 – 27. 0 =
Practice �Sara’s lab shows the atomic mass of aluminum to be 28. 9. What is her percent error if the accepted value is 27. 0? � 28. 9 – 27. 0 = 1. 90
Practice �Sara’s lab shows the atomic mass of aluminum to be 28. 9. What is her percent error if the accepted value is 27. 0? � 28. 9 – 27. 0 = 1. 90 � 1. 90/27. 0 x 100% =
Practice �Sara’s lab shows the atomic mass of aluminum to be 28. 9. What is her percent error if the accepted value is 27. 0? � 28. 9 – 27. 0 = 1. 90 � 1. 90/27. 0 x 100% = 7. 04%
Practice �What is the percent error in a measurement of the boiling point of bromine if the textbook value is 60. 8 °C and the lab value is 40. 6 °C?
Practice �What is the percent error in a measurement of the boiling point of bromine if the textbook value is 60. 8 °C and the lab value is 40. 6 °C? � 60. 8 °C – 40. 6 °C =
Practice �What is the percent error in a measurement of the boiling point of bromine if the textbook value is 60. 8 °C and the lab value is 40. 6 °C? � 60. 8 °C – 40. 6 °C = 20. 2 °C
Practice �What is the percent error in a measurement of the boiling point of bromine if the textbook value is 60. 8 °C and the lab value is 40. 6 °C? � 60. 8 °C – 40. 6 °C = 20. 2 °C � 20. 2 °C / 60. 8 °C x 100% =
Practice �What is the percent error in a measurement of the boiling point of bromine if the textbook value is 60. 8 °C and the lab value is 40. 6 °C? � 60. 8 °C – 40. 6 °C = 20. 2 °C � 20. 2 °C / 60. 8 °C x 100% = 33. 2%
Friday Night Birdville Dunbar