Graphing Graph A visual display of information or


 No matter what type of graph you make, it")

 Determine where your data goes on the graph. *")


 Choose the proper scale for your graph. {hatch mark")


 Plot your information carefully. * a mistake in plotting")


- Slides: 30
Graphing
Graph • A visual display of information or data. * a picture is worth a thousand words
• It is important to use the correct graph type for your data. * picking the wrong graph will make the data hard to understand
Different Types of Graphs * LINE SCATTERPLOT * BAR HISTOGRAM * PIE
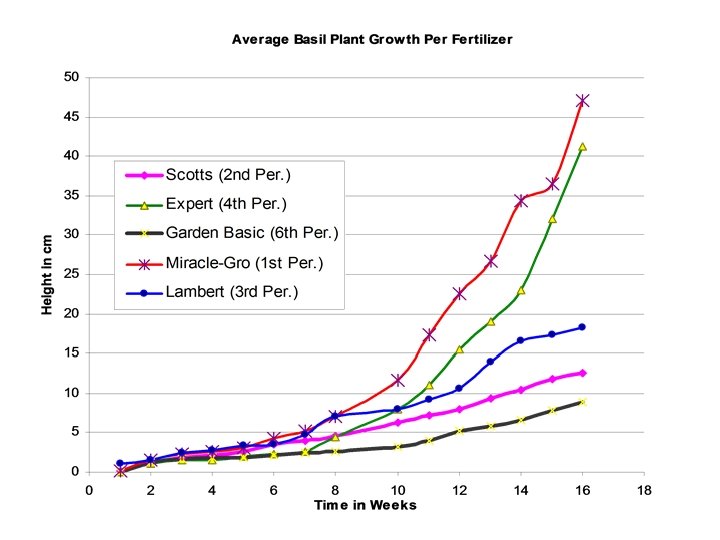
Line Graph • Used to show patterns, trends or how the data changes over time.
Scatterplot • A bizarre type of line graph. * used when trying to see if there is a relationship between the two pieces of data
Scatterplot Graphs
Bar Graph • Used in comparing information collected by counting.
Histogram • A special type of bar graph. * used if one piece of information is a range, instead of selected numbers or items
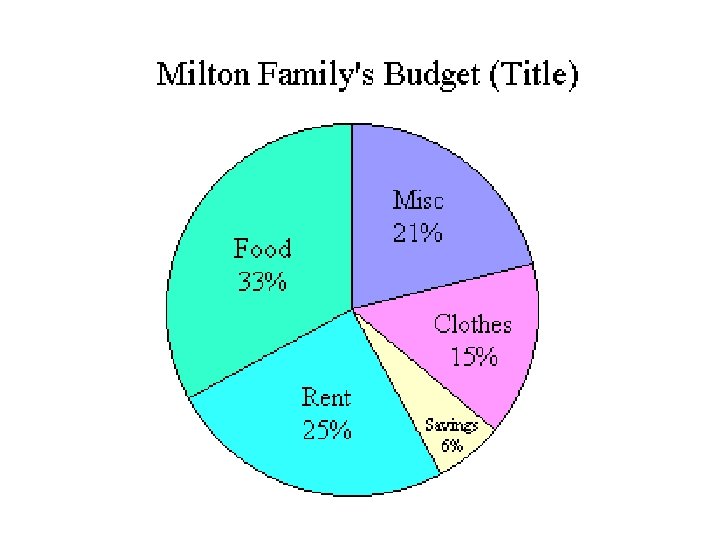
Pie Graph • Used to show some fixed amount is broken down into parts or percentages. * A. K. A. : Circle Graph
Constructing a Graph 1. ) No matter what type of graph you make, it must ALWAYS have a TITLE.
TITLE
Constructing a Graph 2. ) Determine where your data goes on the graph. * what goes on the x-axis * what goes on the y-axis
• What Goes On The X & Y? * Independent Variable goes on the x-axis (bottom line / horizontal) * Dependent Variable goes on the y-axis (left side line / vertical)
* R E S U L T S * D Y E P E N D E N T TITLE X INDEPENDENT “What you are in control of changing”
Constructing a Graph 3. ) Choose the proper scale for your graph. {hatch mark values} * how big or small your graph will be * bigger graphs make it easier to see relationships
* R E S U L T S * D Y E P E N D E N T TITLE HATCH MARKS X INDEPENDENT “What you are in control of”
How do you determine what value each hatch mark is worth? 1. Count how many hatch marks are on the axis. 2. Find the highest data value for that axis. * Scale = Highest Data Value ÷ # of Hatch Marks
* R E S U L T S * D Y E 2624 P 2220 E 18 16 N 14 D 1210 E 86 N 4 2 T TITLE HATCH MARKS 5 10 15 20 25 30 35 40 45 50 INDEPENDENT X “What you are in control of”
Constructing a Graph 4. ) Plot your information carefully. * a mistake in plotting can corrupt your data
Population of students in First Period Science Classes • Earth Science = 33 • Anatomy and Physiology = 0 • Physical Science = 29 • Biology = 55 • Chemistry = 68 • Marine Science = 19 * What type of graph should be used? Bar Graph
How Do I Spend My Day? • Work = 8 hrs. • Practice = 4 hrs. • Sleeping = 5 hrs. • T. V. Time = 4 hrs. • Eating = 2. 5 hrs. • Miscellaneous = 1. 5 hr. • What type of graph should be used? * Pie (Circle)
Average Price of Gas Each Year * What type of graph should be used? Line Graph
Ages of People Visiting Dr. Killpatients on Monday 33 17 5 11 3 1 9 39 88 45 3 23 19 15 19 8 59 43 15 19 98 26 13 58 12 77 25 18 22 62 38 22 46 99 11 10 2 40 30 40 71 23 62 6 51 • What type of graph should be used? * Histogram
High Positive Relationship No Relationship