Graphing Equations with Two Variables Linear Equations Linear
 Linear Equations can be graphed on a")
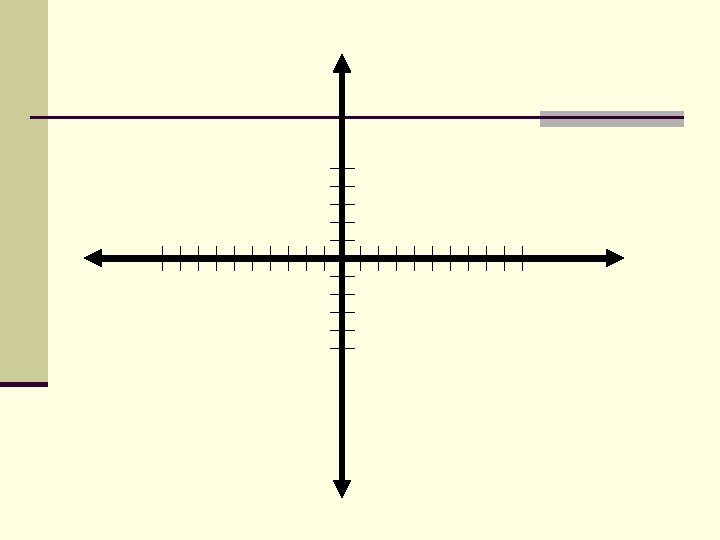
Graphing Equations with Two Variables (Linear Equations) Linear Equations can be graphed on a Cartesian Coordinate system

y-axis Quadrant II Quadrant I Origin Quadrant III Quadrant IV x-axis

Find the Solution n The solution to an equation of a line is an ordered pair that makes the equation true

Make a Table of Values n Find three solutions for y = 3 x+ 4 n Choose values for x nx=3 n y = 3(3) + 4 = 9 + 4 = 13 n So the ordered pair (3, 13) is a solution
 n x")
n Choose 2 more values. n x = -2 n (-2, -2) n x = 1/3 n (1/3, 5) n **A solution to an equation must contain both the x and y values (ordered pair)

n Find the solution when x = -5 for the following: n y = 4 x – 2 n y = 4(-5) – 2 = -20 – 2 = -22 n Solution: (-5, -22) n y = -2 x + 1 n Solution: (-5, 11)
 2.")
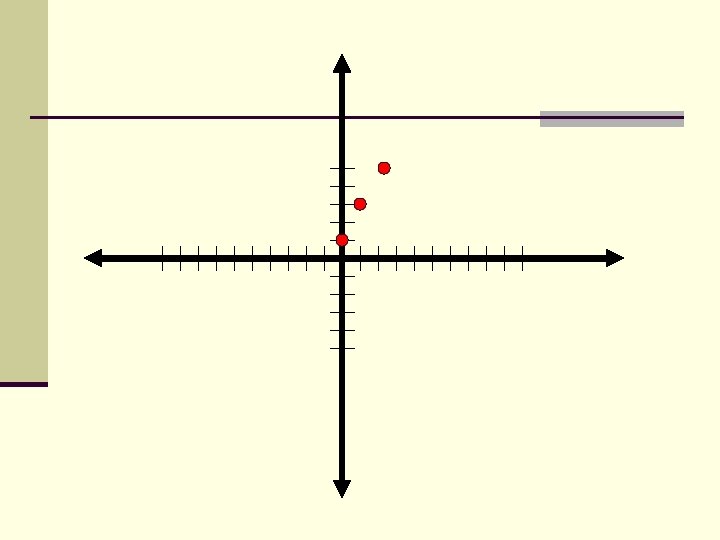
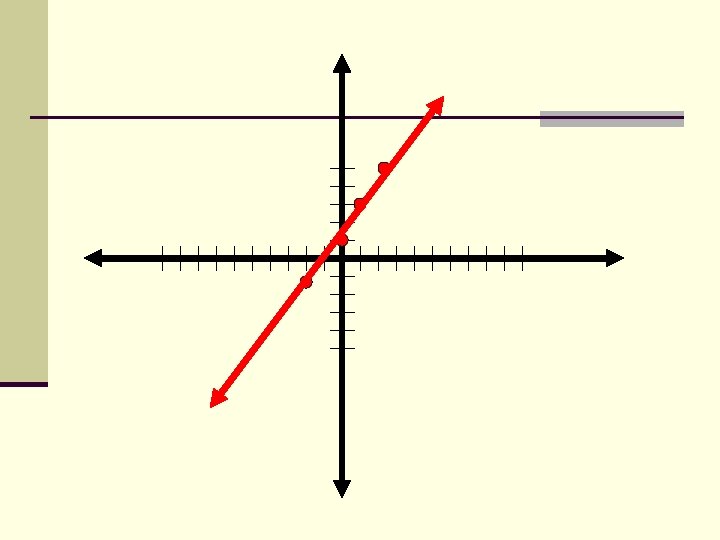
Graphing an Equation 1. Make an x – y table of values (solutions) 2. Plot the ordered pairs 3. Connect with a straight line

Graph y = 2 x + 1 x 2 1 0 -1 Work (x, y)

Graph y = 2 x + 1 x 2 1 0 -1 Work y = 2(2) + 1 y=5 (x, y)

Graph y = 2 x + 1 x 2 1 0 -1 Work y = 2(2) + 1 y=5 (x, y) (2, 5)
 +")
Graph y = 2 x + 1 x Work 2 y = 2(2) + 1 y=5 1 y = 2(1) + 1 y=3 0 -1 (x, y) (2, 5)
 2 y =")
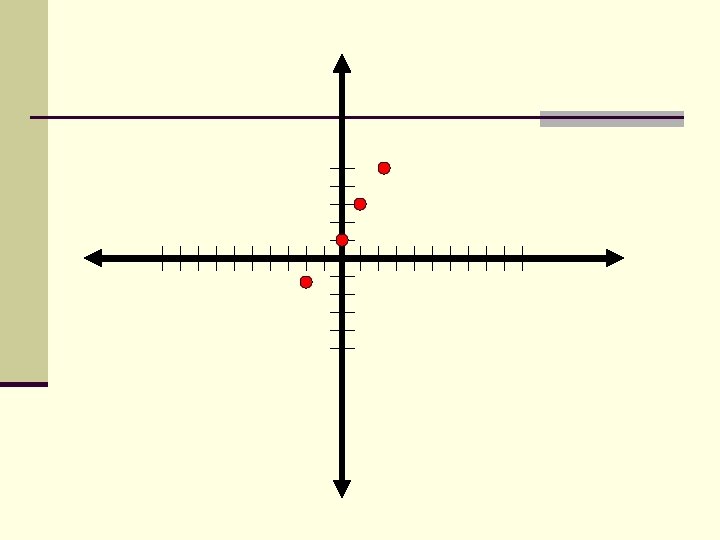
Graph y = 2 x + 1 x Work (x, y) 2 y = 2(2) + 1 y=5 (2, 5) 1 y = 2(1) + 1 y=3 (1, 3) 0 -1
 2 y =")
Graph y = 2 x + 1 x Work (x, y) 2 y = 2(2) + 1 y=5 (2, 5) 1 y = 2(1) + 1 y=3 (1, 3) 0 y = 2(0) + 1 y=1 -1
 2 y =")
Graph y = 2 x + 1 x Work (x, y) 2 y = 2(2) + 1 y=5 (2, 5) 1 y = 2(1) + 1 y=3 (1, 3) 0 y = 2(0) + 1 y=1 (0, 1) -1
 2 y =")
Graph y = 2 x + 1 x Work (x, y) 2 y = 2(2) + 1 y=5 (2, 5) 1 y = 2(1) + 1 y=3 (1, 3) 0 y = 2(0) + 1 y=1 (0, 1) -1 y = 2(-1) + 1 y = -1
 2 y =")
Graph y = 2 x + 1 x Work (x, y) 2 y = 2(2) + 1 y=5 (2, 5) 1 y = 2(1) + 1 y=3 (1, 3) 0 y = 2(0) + 1 y=1 (0, 1) -1 y = 2(-1) + 1 y = -1 (-1, -1)


n Graph y = -x + 3 n Graph y = ½ x - 2

ASSIGNMENT n 8 -2 A: 1 – 20, 28 - 31
- Slides: 24