
Graphing Data Variables Independent Variable causes a change
Graphing Data

Variables Independent Variable: causes a change Dependent Variable: depends on independent Ex. Time is always independent…always changes Speed depends on the time it’s dependent
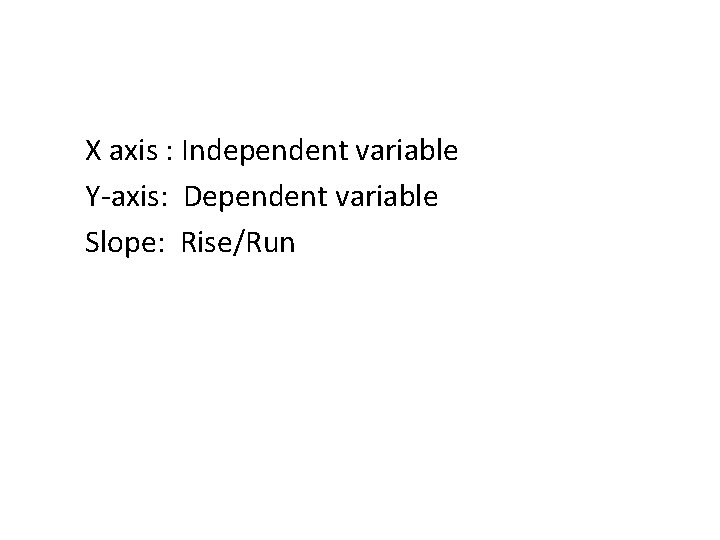
X axis : Independent variable Y-axis: Dependent variable Slope: Rise/Run
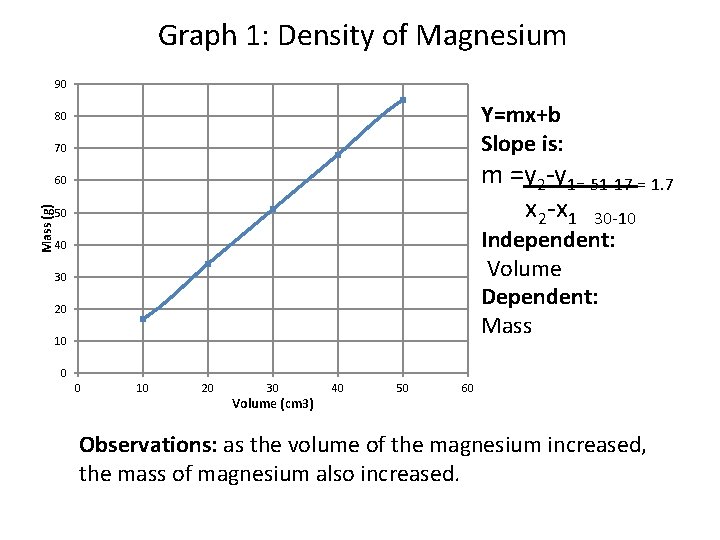
Graph 1: Density of Magnesium 90 Y=mx+b Slope is: 80 70 m =y 2 -y 1= 51 -17 = 1. 7 x 2 -x 1 30 -10 Mass (g) 60 50 Independent: Volume Dependent: Mass 40 30 20 10 0 0 10 20 30 Volume (cm 3) 40 50 60 Observations: as the volume of the magnesium increased, the mass of magnesium also increased.
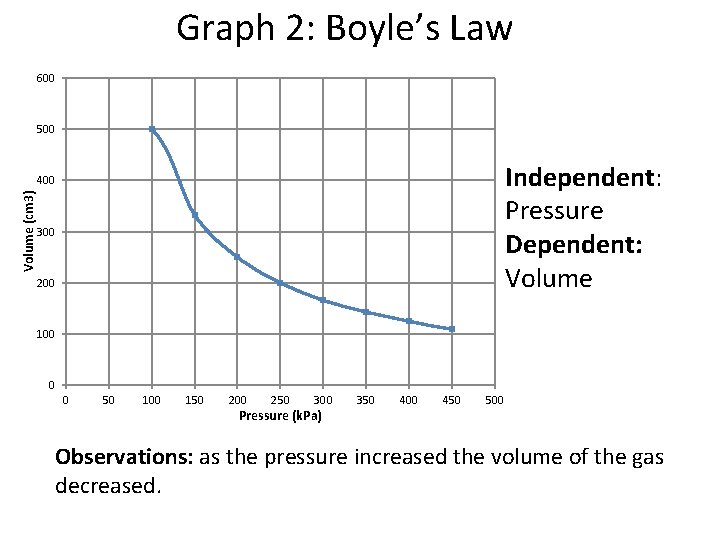
Graph 2: Boyle’s Law 600 500 Independent: Pressure Dependent: Volume (cm 3) 400 300 200 100 0 0 50 100 150 200 250 300 Pressure (k. Pa) 350 400 450 500 Observations: as the pressure increased the volume of the gas decreased.
Conclusion: What are differences in graph 1&2 Graph 1: is a direct relationship Graph 2: is a opposite (inverse) relationship
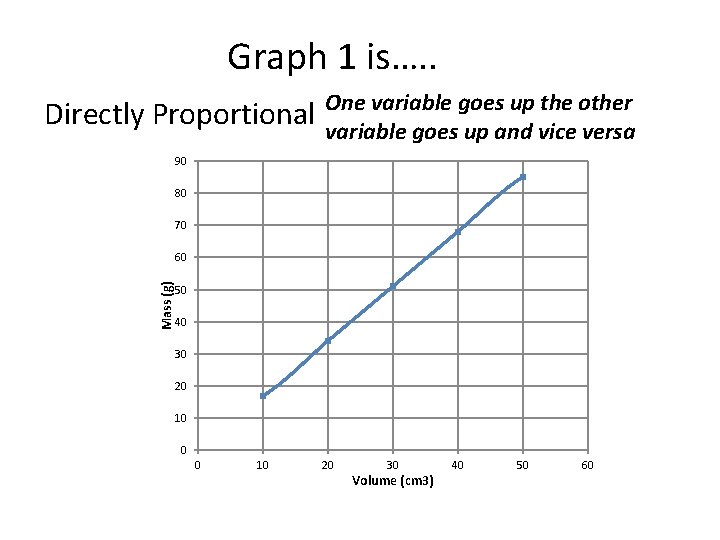
Graph 1 is…. . Directly Proportional One variable goes up the other variable goes up and vice versa 90 80 70 Mass (g) 60 50 40 30 20 10 0 0 10 20 30 Volume (cm 3) 40 50 60
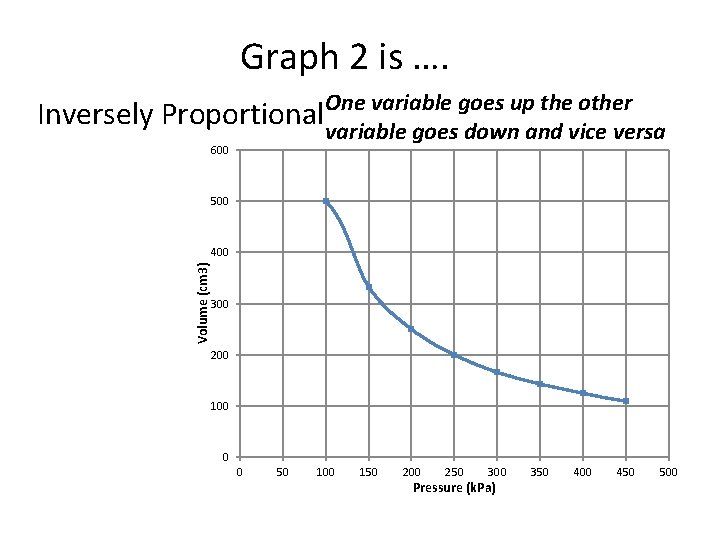
Graph 2 is …. variable goes up the other Inversely Proportional. One variable goes down and vice versa 600 500 Volume (cm 3) 400 300 200 100 0 0 50 100 150 200 250 300 Pressure (k. Pa) 350 400 450 500

PRACTICE
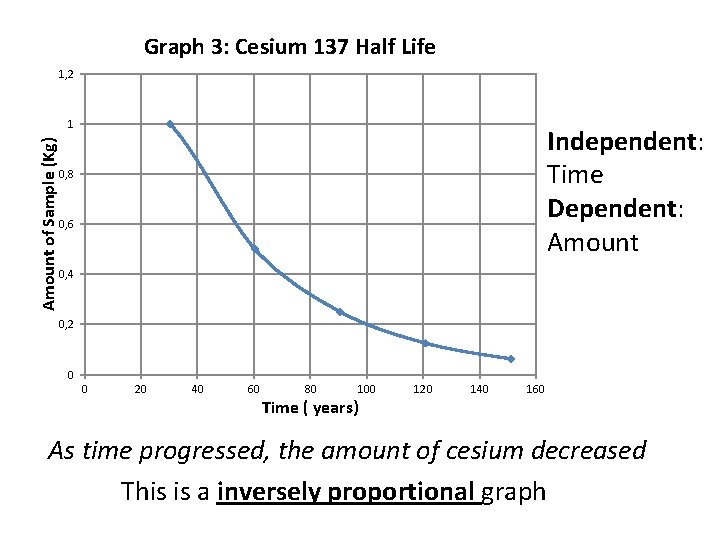
Graph 3: Cesium 137 Half Life 1, 2 Amount of Sample (Kg) 1 Independent: Time Dependent: Amount 0, 8 0, 6 0, 4 0, 2 0 0 20 40 60 80 100 Time ( years) 120 140 160 As time progressed, the amount of cesium decreased This is a inversely proportional graph
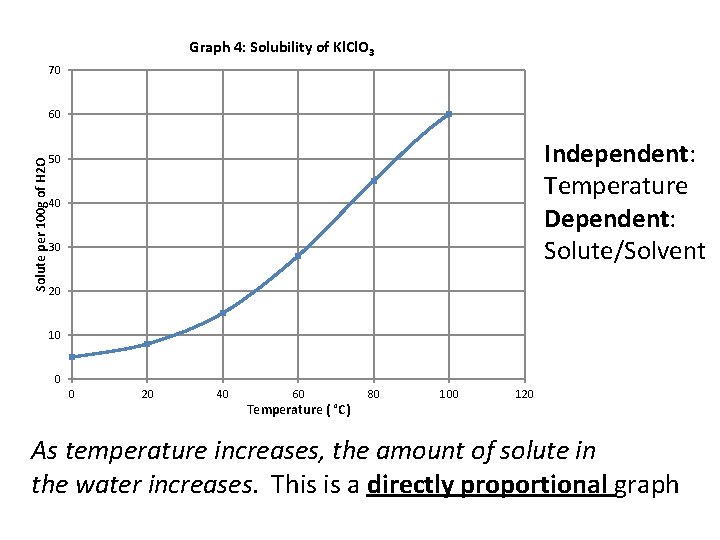
Graph 4: Solubility of Kl. Cl. O 3 70 Solute per 100 g of H 2 O 60 Independent: Temperature Dependent: Solute/Solvent 50 40 30 20 10 0 0 20 40 60 Temperature ( °C) 80 100 120 As temperature increases, the amount of solute in the water increases. This is a directly proportional graph
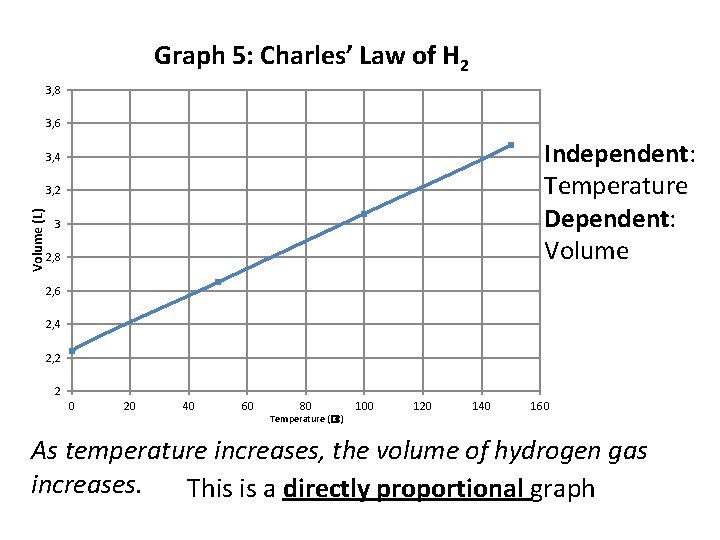
Graph 5: Charles’ Law of H 2 3, 8 3, 6 Independent: Temperature Dependent: Volume 3, 4 Volume (L) 3, 2 3 2, 8 2, 6 2, 4 2, 2 2 0 20 40 60 80 Temperature (�C) 100 120 140 160 As temperature increases, the volume of hydrogen gas increases. This is a directly proportional graph
- Slides: 12