GRAPHING AND MISLEADING GRAPHS Graphs are valuable tools

GRAPHING AND MISLEADING GRAPHS

• Graphs are valuable tools for summarizing data. • What do you see? https: //math. scholastic. com/issues/2017 -18/092517/fake-news-fake-data. html

• Data may be accurate, but if graphed incorrectly, the data can be misinterpreted. • Ways to mislead: #1 – Misleading title : It tells you how to think! https: //aspectmr. com/misleading-graphs/

https: //www. ck 12. org/statistics/misleading-graphs-identify-misleading-statistics/lesson/Identification-of-Misleading. Statistics/

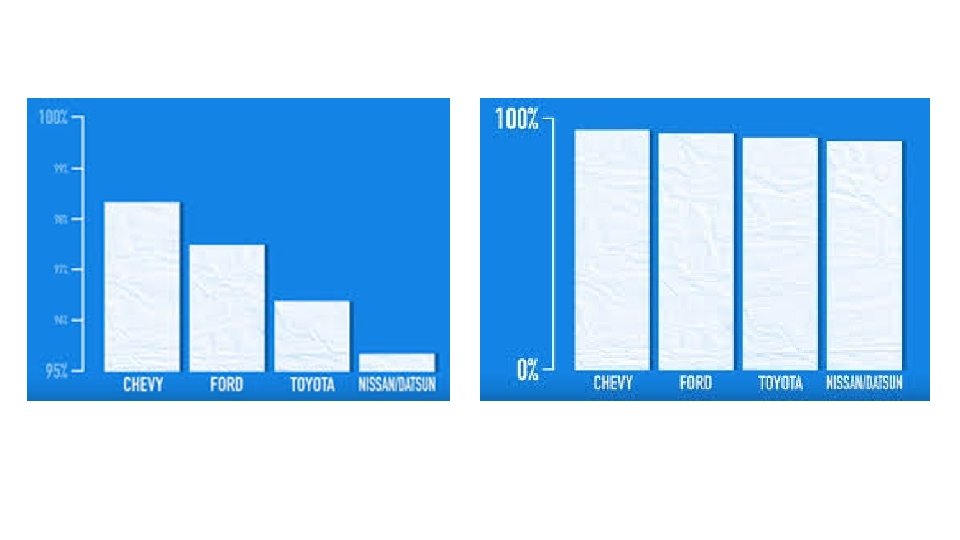
#2 – axis scaling https: //medium. com/knowledgenudge/how-to-mislead-with-graphs-916 f 853 a 6 e 03

• Y axis can be too big • Y axis can be too small • Y axis can skip #s (broken) • Y axis might not start at 0 • Y axis has no scale • Y axis has incorrect scale* • Y axis might not be labelled

# graduates from a community college between 1999 and 2003 https: //faculty. atu. edu/mfinan/2043/section 31. pdf

https: //www. studypug. com/statistics-help/misleading-graphs

https: //www. ck 12. org/user: bs 10 zwftqgljc 3 ouy 2 g. /book/integr ated-mathematics-i-myp 1/section/2. 7/

#3 - Missing Data https: //medium. com/knowledgenudge/how-to-mislead-withgraphs-916 f 853 a 6 e 03

Image source: https: //xkcd. com/833

Drawing a graph correctly • Label axes, including units • Use correct scale for Y axis (spacing/intervals) • Start axis at 0 • Do not use a broken Y-axis • Include all data • Use a title that correctly describes the graph No imagination? ‘y-axis name’ vs ‘x-axis name’

Arkansas Football Wins per Year between 2000 and 2016

• Help with creating a graph on excel • https: //blog. hubspot. com/marketing/how-to-build-excel-graph • https: //www. youtube. com/watch? v=e. MEhjbhtfx. Q • https: //www. youtube. com/watch? v=3 Pw. VWX 28 d. EE • https: //www. youtube. com/watch? v=Tfk. Nkr. KMF 5 c
- Slides: 15