Graphical Policy Analysis Tool Developed by Kevin Wheeler

Graphical Policy Analysis Tool Developed by Kevin Wheeler for USBR and CADSWES

Comparing Potential Policies Complex Models = Complex Output Multiple Slots of Interest n Stakeholders Multiple Run Analysis n Hydrologic scenarios Multiple Policies of Interest Time

Traditional Comparison Model managers extract, graph and present all results that they deem as significant – Potential bias? n Focus on differences and not similarities Stakeholder inevitably ask questions for which the modelers are not prepared to answer Ø Discussions Cease RESCHEDULE MEETINGS = $$$

Using Excel. Writer Sl ot Write River. Ware Outputs into Spreadsheet Format Time Run POLICY #1

How to Compare Policies? ? ? POLICY #2 POLICY #1 POLICY #3 POLICY #5 POLICY #4

Commonly Asked Questions I want to compare individual slot values over time for a common hydrology

Commonly Asked Questions I want to compare the statistics of all hydrologic scenarios over time n Mean, Minimum, Maximum, Standard Deviation

Commonly Asked Questions How do the probabilistic distributions of slot values compare at one point in time? PDF (Histogram) , CDF
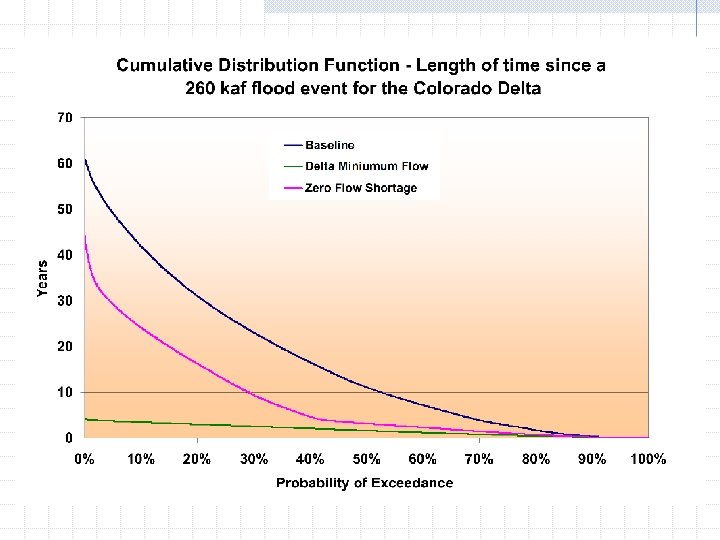

Commonly Asked Questions What will the slot values be over time that correspond to a particular percentile of occurrence?

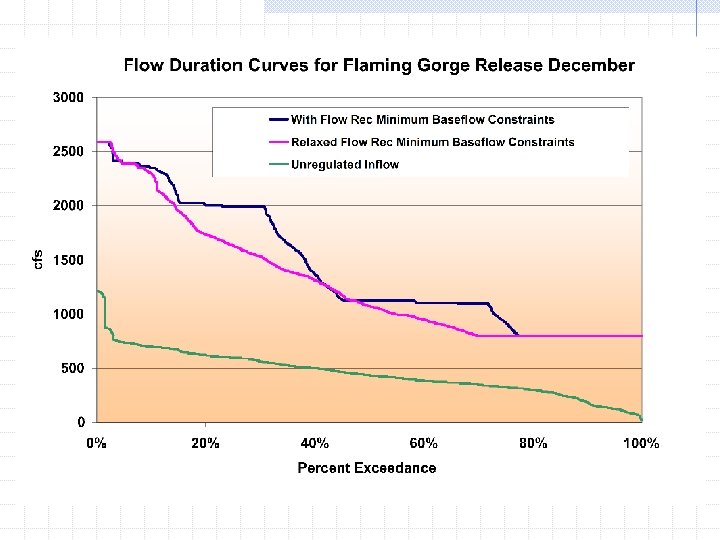
Commonly Asked Questions Probabilities What is the probability of a slot variable exceeding or not exceeding a certain value through time? What is the probability of a slot variable falling within a specified range through time? What is the probability of a binary occurrence? n Flood release, shortage, surplus, equalization flags

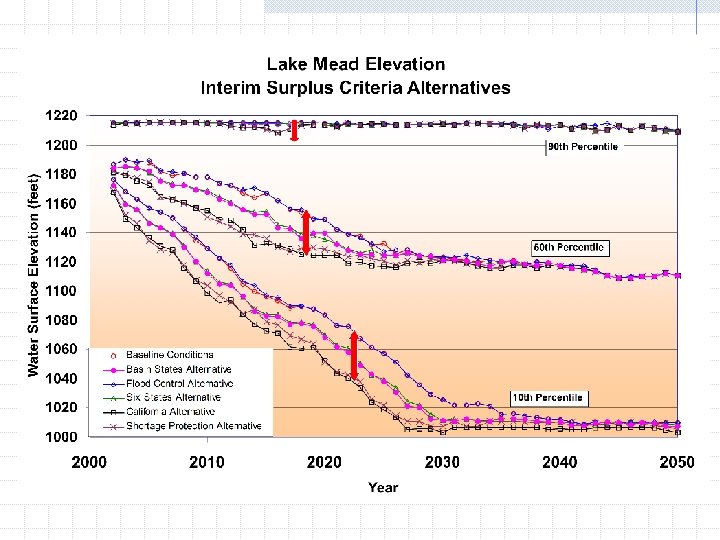
Example: Depleting Reservoirs

Specialty Functions Arithmetic operations between slots in the same policy to create new slots n What is the total storage capacity in the system? Arithmetic operations between different policies n What are the differences between two policies for ALL slots? Isolate Monthly Values n What is the probability exceeding a slot value during a specific set of months? Record and recall graphs produced

Benefits Give rapid access to all model results n Answer questions “on the fly” Facilitate model interpretation by stakeholders Generate a qualitative AND quantitative understanding of similarities and tradeoffs Promote interactive discussions between stakeholders – Generate new policies

Present Version 1. 1 on the web site Version 1. 2 Development circulating

Future Bulletproof development version and release Solicit needs n n Include some concepts from TVA’s tool Additional timesteps Connections to other tools and more! Add features to version 2. 0
- Slides: 19