
Graphical Diagnostic Tools for Evaluating Latent Class Models


- Slides: 27
Graphical Diagnostic Tools for Evaluating Latent Class Models: An Application to Depression in the ECA Study Elizabeth S. Garrett Department of Biostatistics Johns Hopkins University 1
GOAL l Provide tools for choosing the most appropriate latent class model. l Interpret objective diagnostic methods in reference to the latent class model. 2
Table of Contents 1. 2. 3. 4. 5. 6. 7. 8. Introduction Previous Work Model Estimation Diagnostic Methods for Latent Class Models Extensions to Latent Class Regression Application to the ECA Study Validating Diagnostic Criteria for Depression Using LCM Discussion and Further Research 3
Outline l l l l Depression in relation to the LCM Approach to Estimation The ECA Study Predicted Frequency Check Plot Latent Class Estimability Display Interpretation of Findings Revisions 4
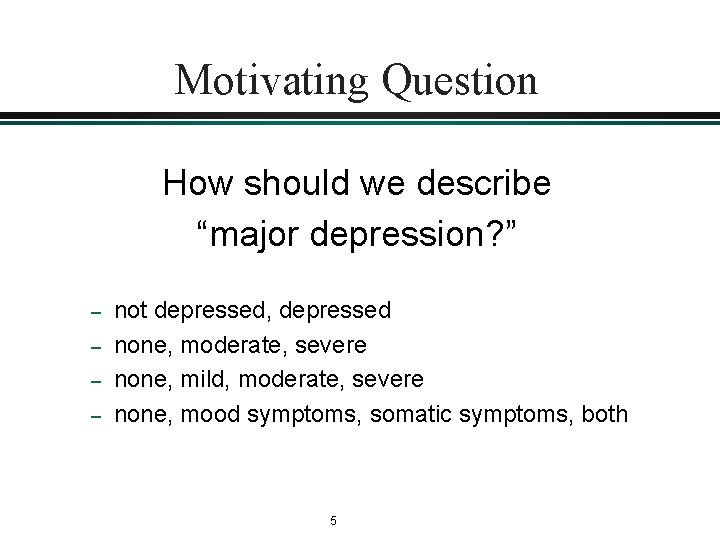
Motivating Question How should we describe “major depression? ” – – not depressed, depressed none, moderate, severe none, mild, moderate, severe none, mood symptoms, somatic symptoms, both 5
How we conceptualize “major depression” · · · Ø We use indicators of symptoms such as self-reported presence of sadness, weight change, etc. A combination of these indicators is thought to define depression. Using these combinations, we commonly seek to categorize individuals into depression classes. These classes represent the construct “depression. ” “Depression” is a latent variable. The construct of “Depression” can then be used for classification, description, and prediction 6
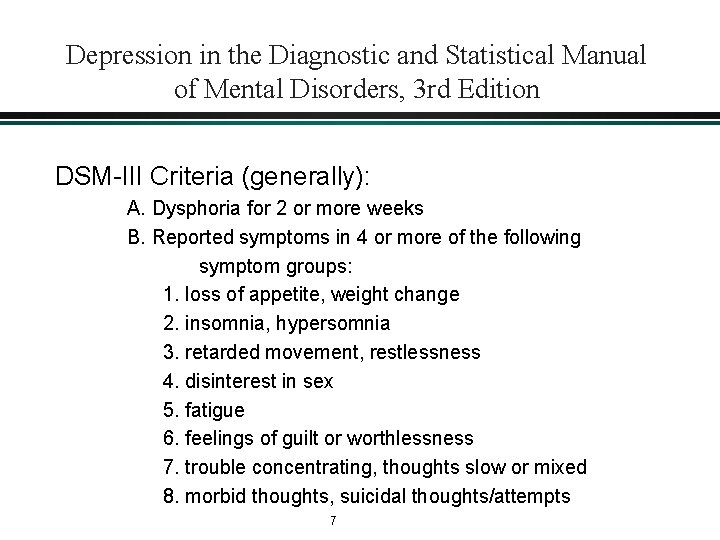
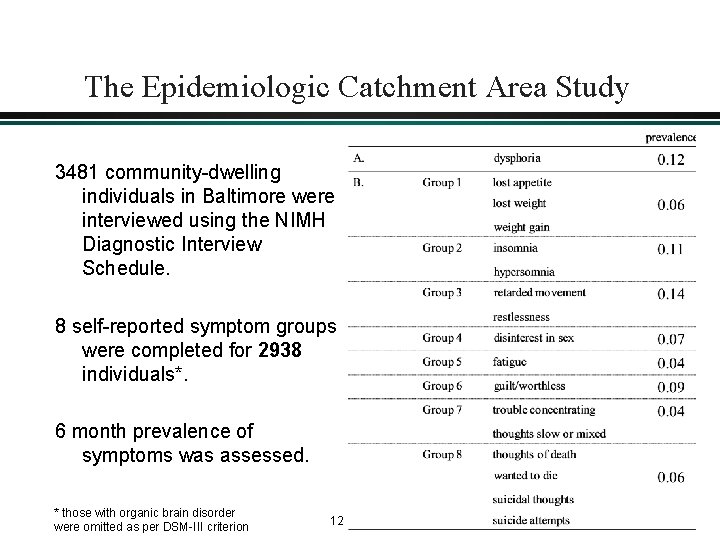
Depression in the Diagnostic and Statistical Manual of Mental Disorders, 3 rd Edition DSM-III Criteria (generally): A. Dysphoria for 2 or more weeks B. Reported symptoms in 4 or more of the following symptom groups: 1. loss of appetite, weight change 2. insomnia, hypersomnia 3. retarded movement, restlessness 4. disinterest in sex 5. fatigue 6. feelings of guilt or worthlessness 7. trouble concentrating, thoughts slow or mixed 8. morbid thoughts, suicidal thoughts/attempts 7
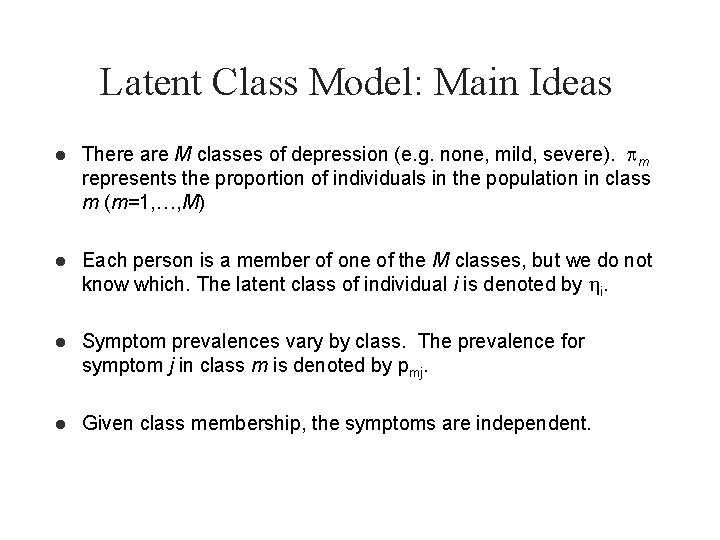
Latent Class Model: Main Ideas l There are M classes of depression (e. g. none, mild, severe). m represents the proportion of individuals in the population in class m (m=1, …, M) l Each person is a member of one of the M classes, but we do not know which. The latent class of individual i is denoted by i. l Symptom prevalences vary by class. The prevalence for symptom j in class m is denoted by pmj. l Given class membership, the symptoms are independent.
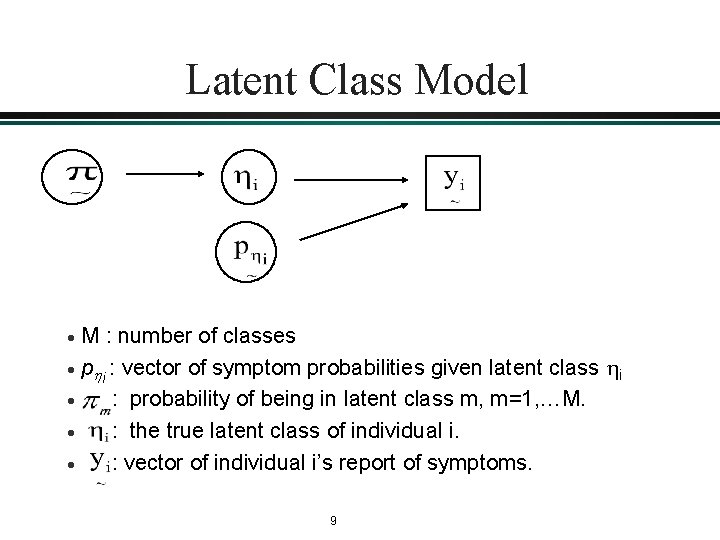
Latent Class Model M : number of classes · p : vector of symptom probabilities given latent class i i · : probability of being in latent class m, m=1, …M. · : the true latent class of individual i. · : vector of individual i’s report of symptoms. · 9
Estimation Approach Bayesian Approach: Quantify beliefs about p, , and before and after observing data. Bayesian Terminology: Prior Probability: What we believe about unknown parameters before observing data. Posterior Probability: What we believe about the parameters after observing data. 10
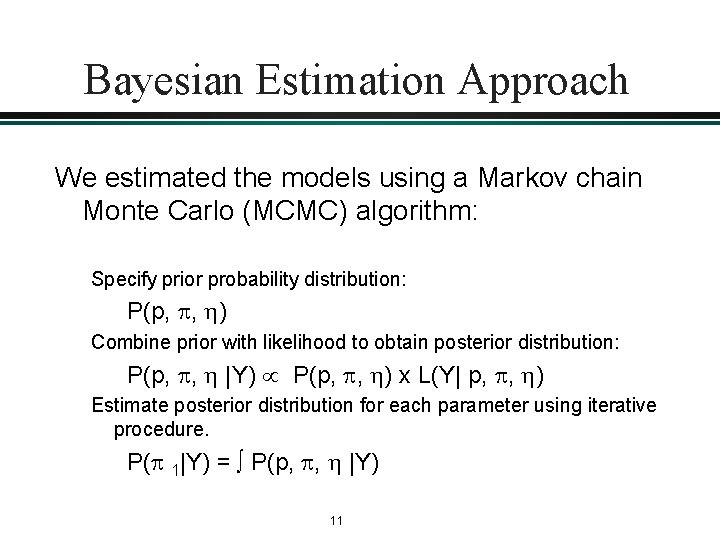
Bayesian Estimation Approach We estimated the models using a Markov chain Monte Carlo (MCMC) algorithm: Specify prior probability distribution: P(p, , ) Combine prior with likelihood to obtain posterior distribution: P(p, , |Y) P(p, , ) x L(Y| p, , ) Estimate posterior distribution for each parameter using iterative procedure. P( 1|Y) = ∫ P(p, , |Y) 11
The Epidemiologic Catchment Area Study 3481 community-dwelling individuals in Baltimore were interviewed using the NIMH Diagnostic Interview Schedule. 8 self-reported symptom groups were completed for 2938 individuals*. 6 month prevalence of symptoms was assessed. * those with organic brain disorder were omitted as per DSM-III criterion 12
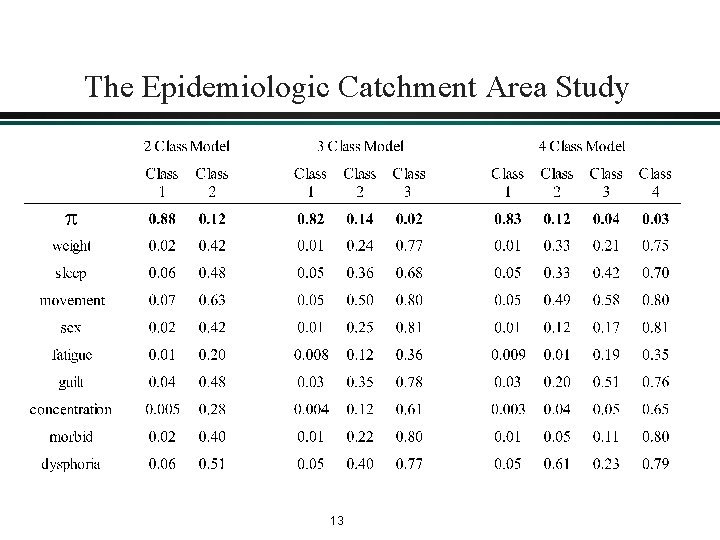
The Epidemiologic Catchment Area Study 13
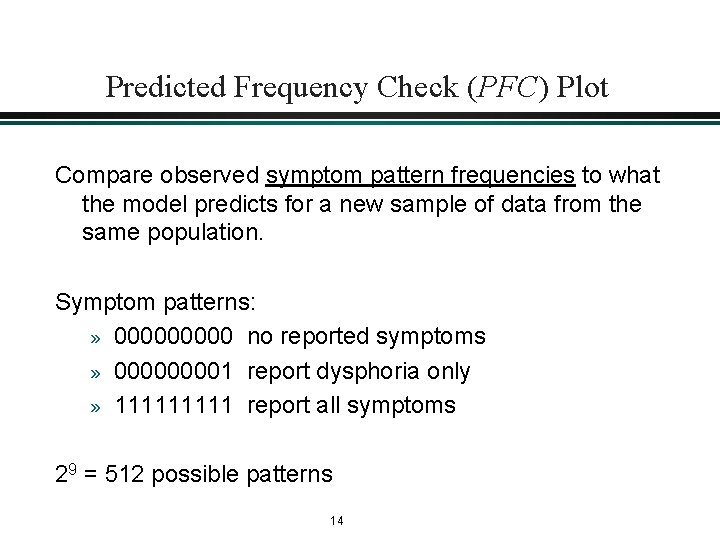
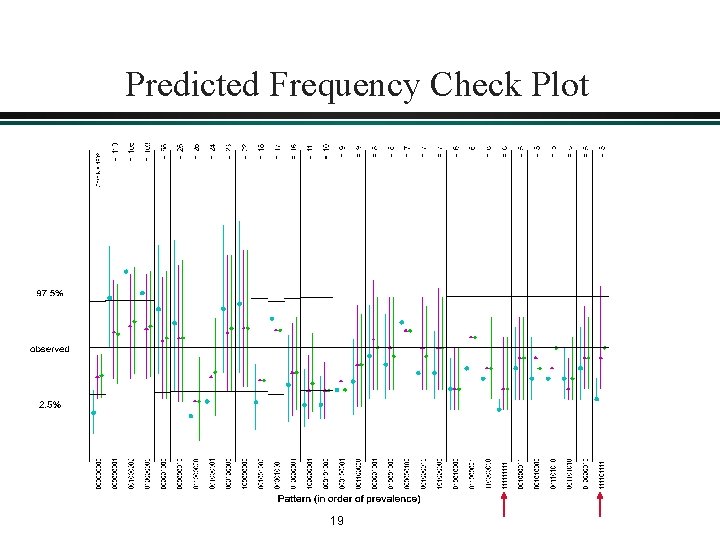
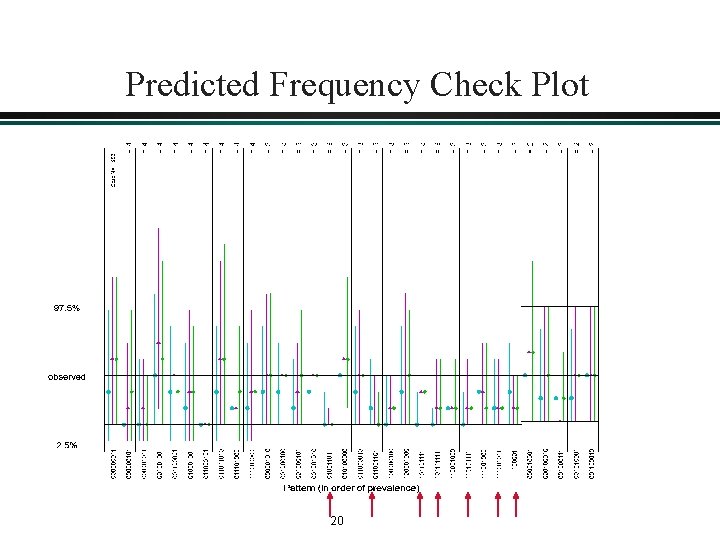
Predicted Frequency Check (PFC) Plot Compare observed symptom pattern frequencies to what the model predicts for a new sample of data from the same population. Symptom patterns: » 00000 no reported symptoms » 00001 report dysphoria only » 11111 report all symptoms 29 = 512 possible patterns 14
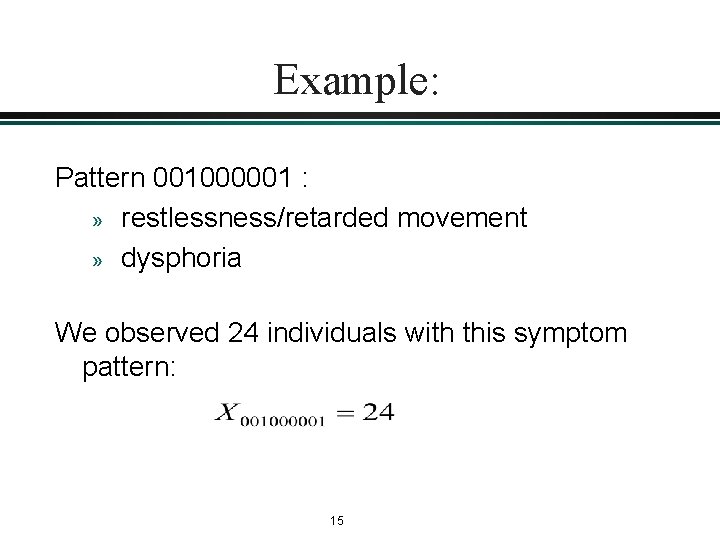
Example: Pattern 001000001 : » restlessness/retarded movement » dysphoria We observed 24 individuals with this symptom pattern: 15
Example: 95% confidence interval for frequency? Non-parametric (saturated model) estimate: 16
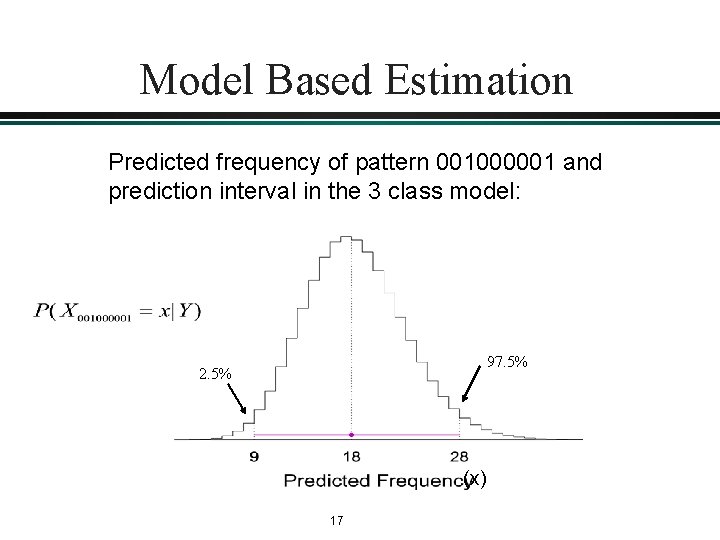
Model Based Estimation Predicted frequency of pattern 001000001 and prediction interval in the 3 class model: 97. 5% 2. 5% (x) 17
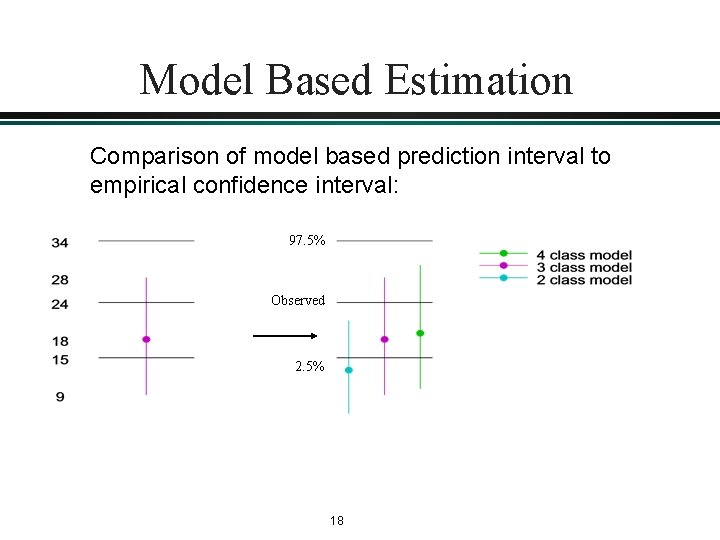
Model Based Estimation Comparison of model based prediction interval to empirical confidence interval: 97. 5% Observed 2. 5% 18
Predicted Frequency Check Plot 19
Predicted Frequency Check Plot 20
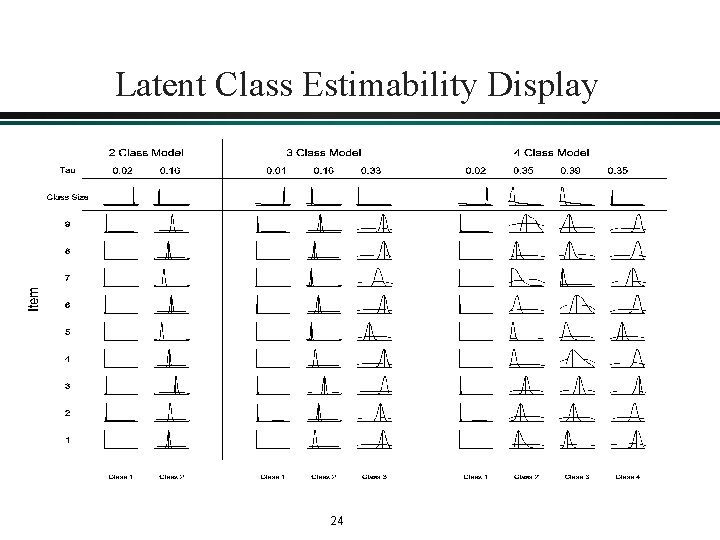
Latent Class Estimability Display (LCED) Is there enough data to estimate all of the parameters in the model? » » » 2 class model: 19 parameters 3 class model: 29 parameters 4 class model: 39 parameters Problems arise when: » » » small data set small class size e. g. N=1000 and class size = 0. 01 10 individuals in class to estimate symptom prevalences small data set and small class size 21
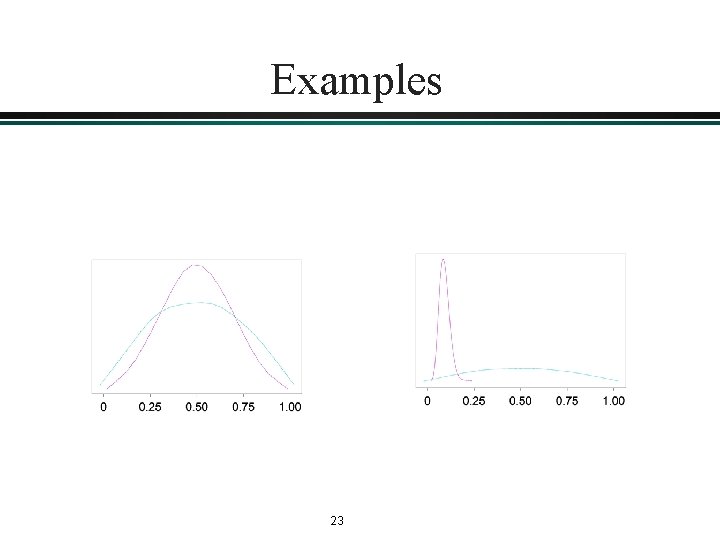
Weak “Identifiability” (Weak Estimability) Definition: A parameter in a (Bayesian) model is weakly identified if the posterior distribution of the parameter is approximately the same as the prior. P( 1) P( 1|Y) If a model is weakly identified it is still “valid”, but we cannot make inferences from the data about the weakly identified parameters. 22
Examples 23
Latent Class Estimability Display 24
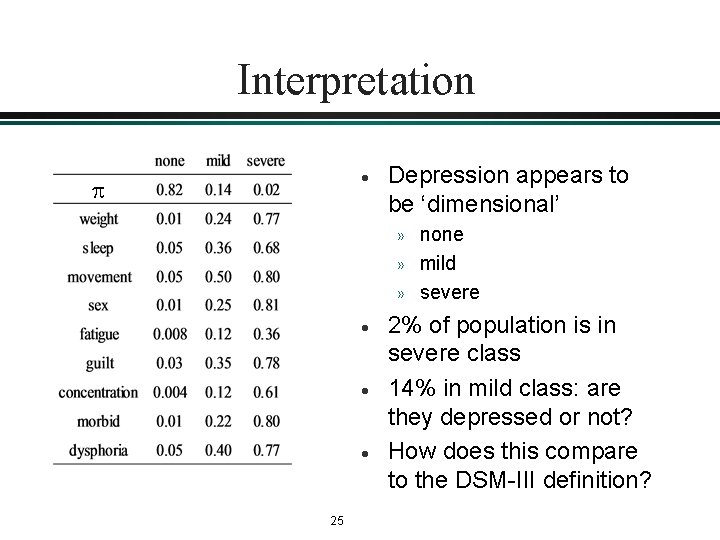
Interpretation · Depression appears to be ‘dimensional’ » » » · · · 25 none mild severe 2% of population is in severe class 14% in mild class: are they depressed or not? How does this compare to the DSM-III definition?
Work Not Included in Talk l MCMC Algorithm l Log Odds Ratio Check Plot l Predicted Class Assignment Display l Extensions to Regression 26
Revisions Already Implemented l New example for Chapter 5 (LCRR) l Background/justification of latent class model as “gold-standard” in validation l Splus programs: on website with a “user’s guide” 27