GraphBased Binary Analysis Drawing pictures from code Can
Graph-Based Binary Analysis Drawing pictures from code Can. Sec. West 2002 Halvar Flake Reverse Engineer Blackhat Consulting
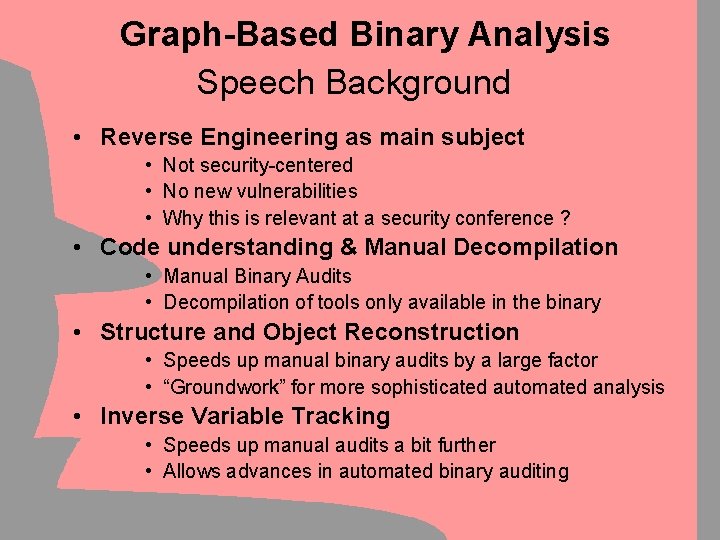
Graph-Based Binary Analysis Speech Background • Reverse Engineering as main subject • Not security-centered • No new vulnerabilities • Why this is relevant at a security conference ? • Code understanding & Manual Decompilation • Manual Binary Audits • Decompilation of tools only available in the binary • Structure and Object Reconstruction • Speeds up manual binary audits by a large factor • “Groundwork” for more sophisticated automated analysis • Inverse Variable Tracking • Speeds up manual audits a bit further • Allows advances in automated binary auditing
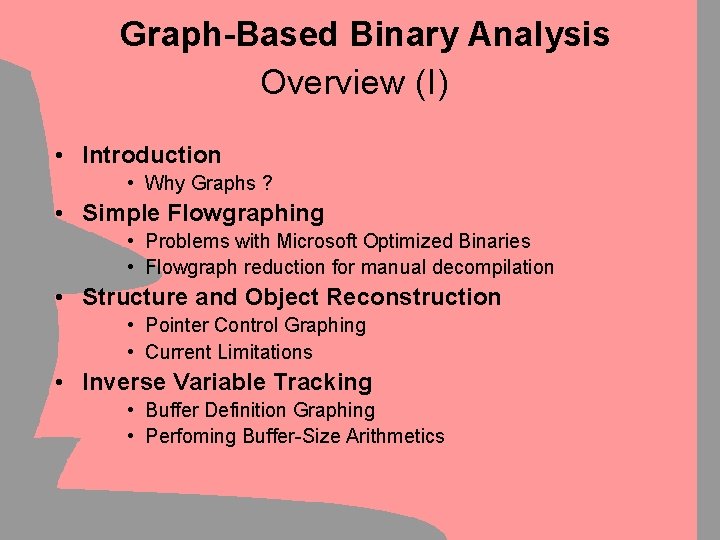
Graph-Based Binary Analysis Overview (I) • Introduction • Why Graphs ? • Simple Flowgraphing • Problems with Microsoft Optimized Binaries • Flowgraph reduction for manual decompilation • Structure and Object Reconstruction • Pointer Control Graphing • Current Limitations • Inverse Variable Tracking • Buffer Definition Graphing • Perfoming Buffer-Size Arithmetics
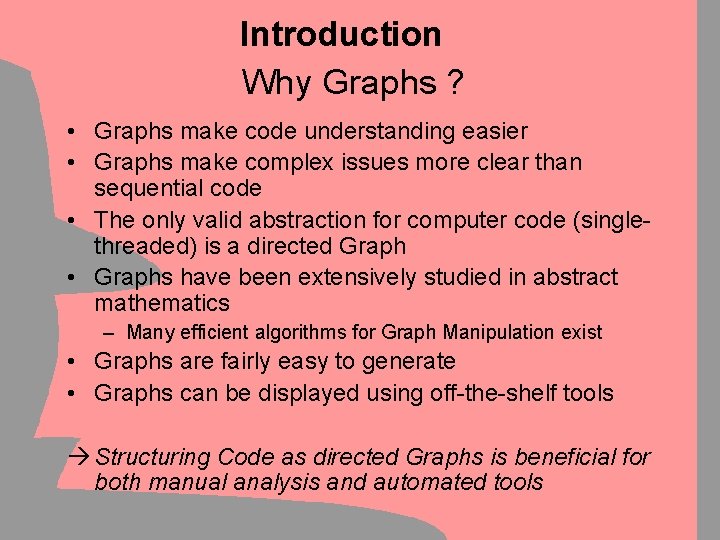
Introduction Why Graphs ? • Graphs make code understanding easier • Graphs make complex issues more clear than sequential code • The only valid abstraction for computer code (singlethreaded) is a directed Graph • Graphs have been extensively studied in abstract mathematics – Many efficient algorithms for Graph Manipulation exist • Graphs are fairly easy to generate • Graphs can be displayed using off-the-shelf tools Structuring Code as directed Graphs is beneficial for both manual analysis and automated tools
Simple Flow Graphs Applications • • Simplify Code understanding Clarify Code interdependences Allow for gradual manual decompilation Can be used as basic blocks from which to build more sophisticated analysis tools • IDA 4. 17 and higher include a built-in flowgraphing plugin – Problems with optimized Microsoft binaries
Simple Flow Graphs Building a function flowgraph Creating a flowgraph from the disassembly is trivial: • Begin by tracing the code downwards • If a local branch is encountered, “split” the graph and follow both branches • Continue until a node with no further downlinks is encountered • Heuristically scan for “switch”-constructs and handle them (special case)
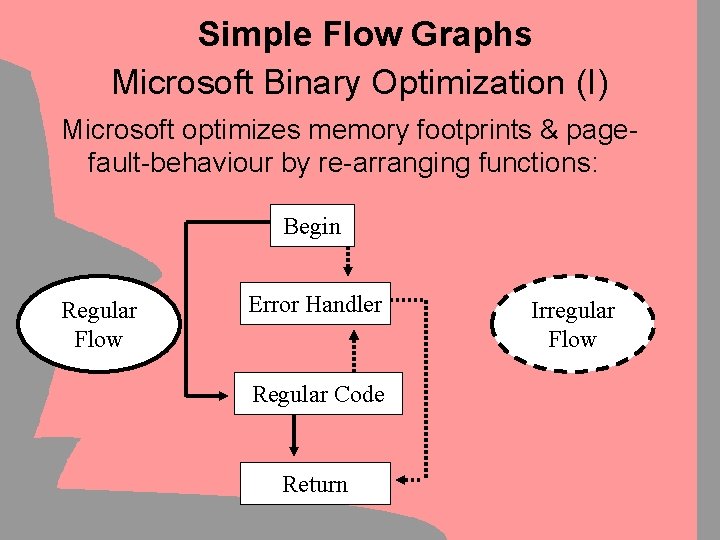
Simple Flow Graphs Microsoft Binary Optimization (I) Microsoft optimizes memory footprints & pagefault-behaviour by re-arranging functions: Begin Regular Flow Error Handler Regular Code Return Irregular Flow
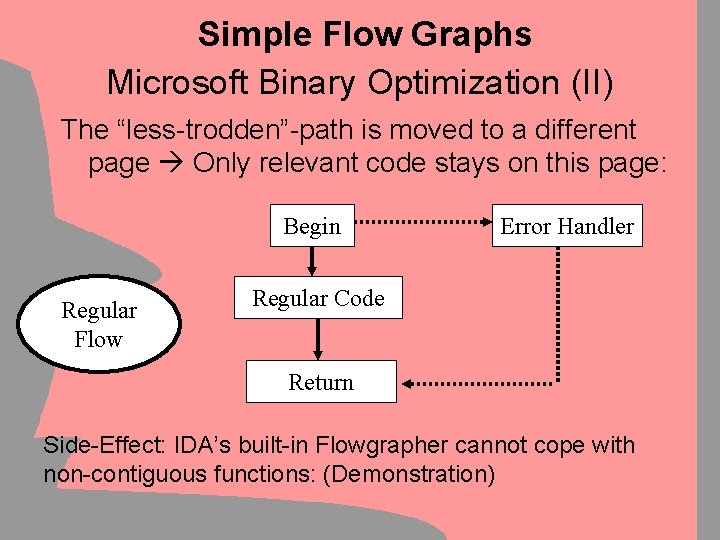
Simple Flow Graphs Microsoft Binary Optimization (II) The “less-trodden”-path is moved to a different page Only relevant code stays on this page: Begin Regular Flow Error Handler Regular Code Return Side-Effect: IDA’s built-in Flowgrapher cannot cope with non-contiguous functions: (Demonstration)
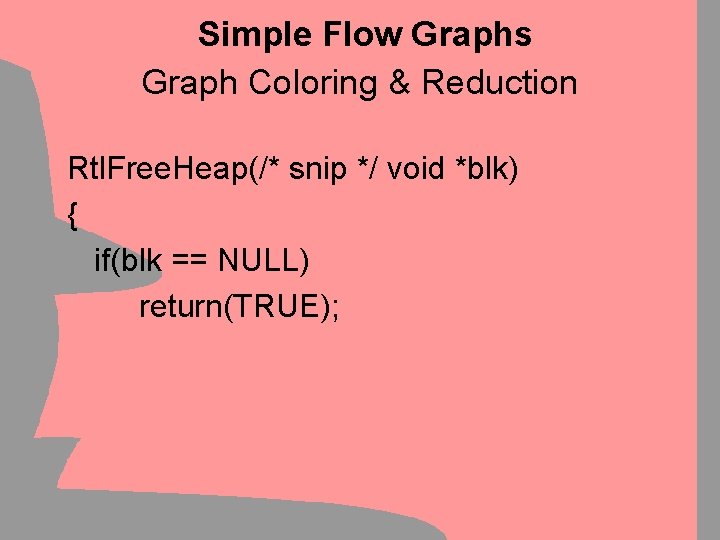
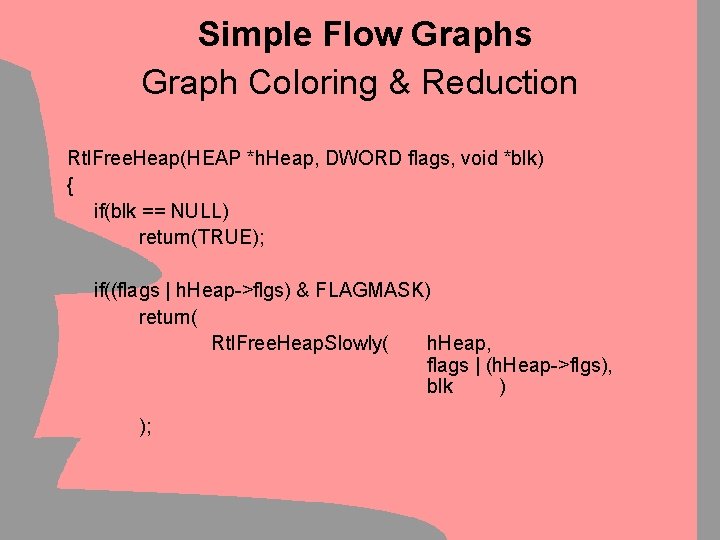
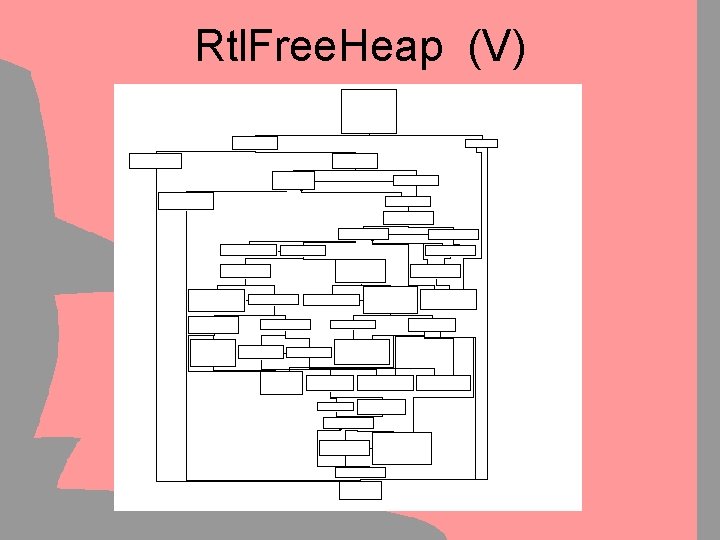
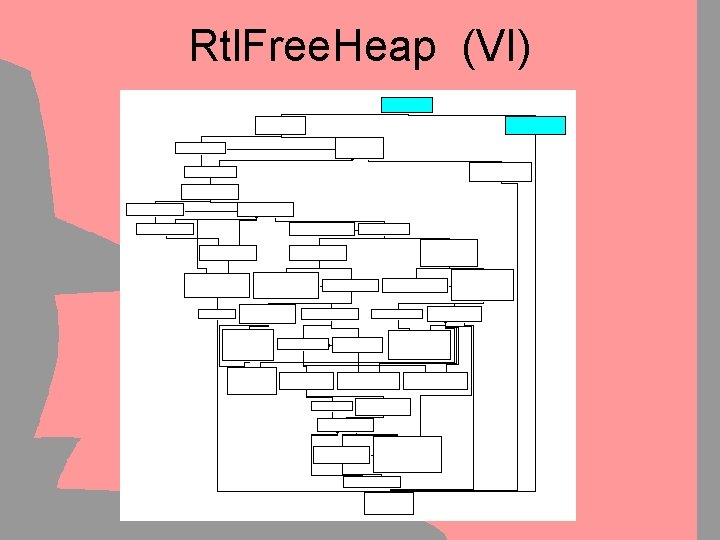
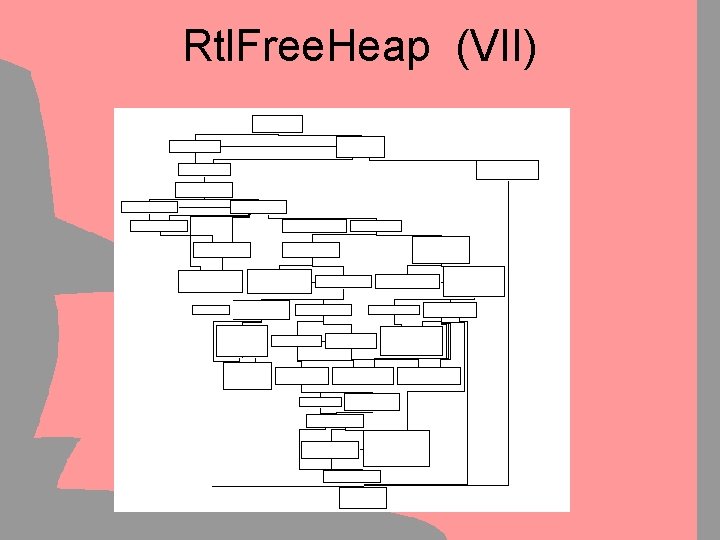
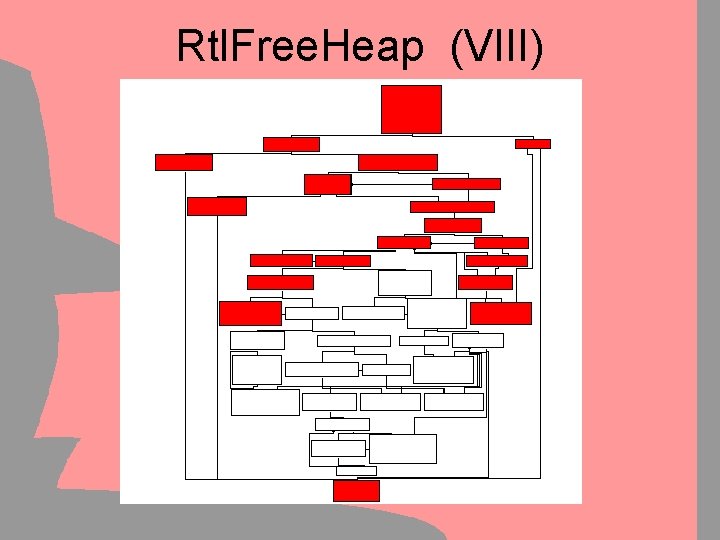
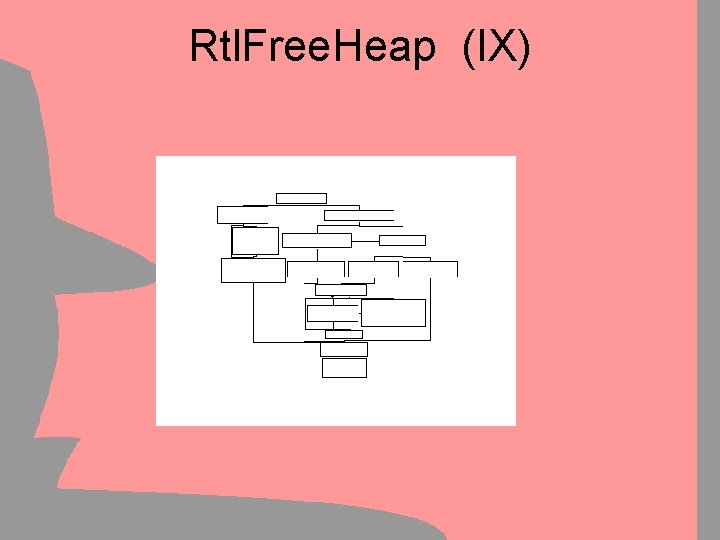
Simple Flow Graphs Graph Coloring & Reduction • Manual Decompilation is tedious: – Reverse Engineers burn out easily – Small mistakes get back to you – Hard to keep track of progress • Graphs can be used as visual aid – Step 1: Color the covered code – Step 2: Remove outer-layer loops & branches • Graphs will keep track of progress – It’s good to see that you’re getting somewhere
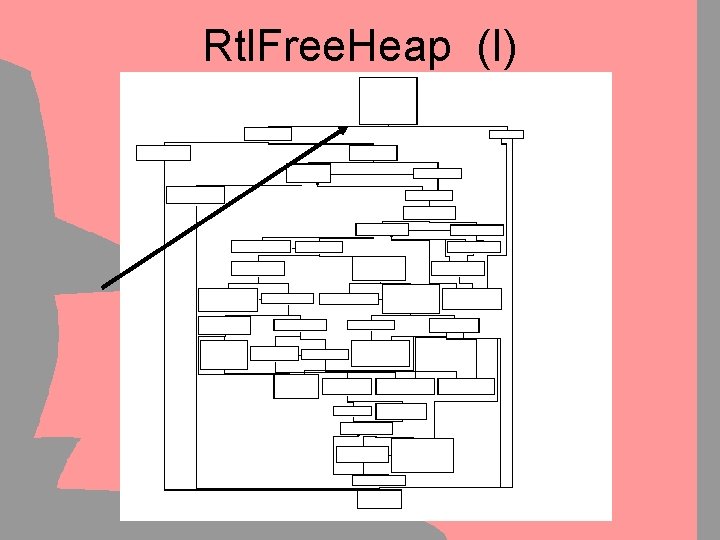
Rtl. Free. Heap (I)
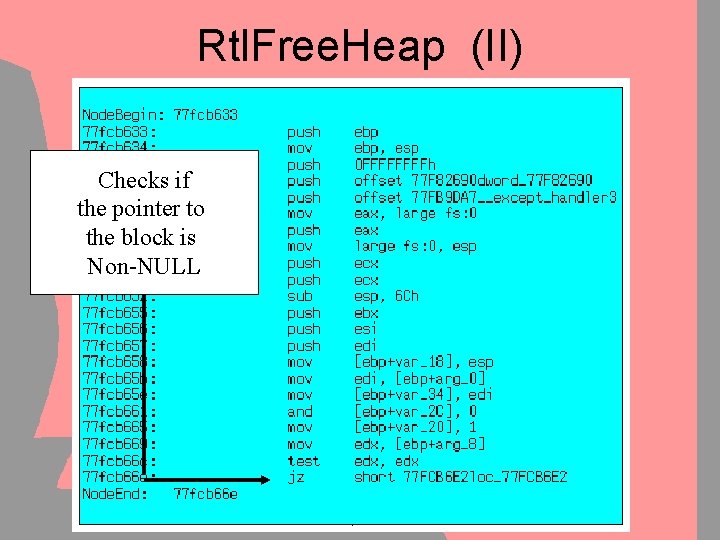
Rtl. Free. Heap (II) Checks if the pointer to the block is Non-NULL
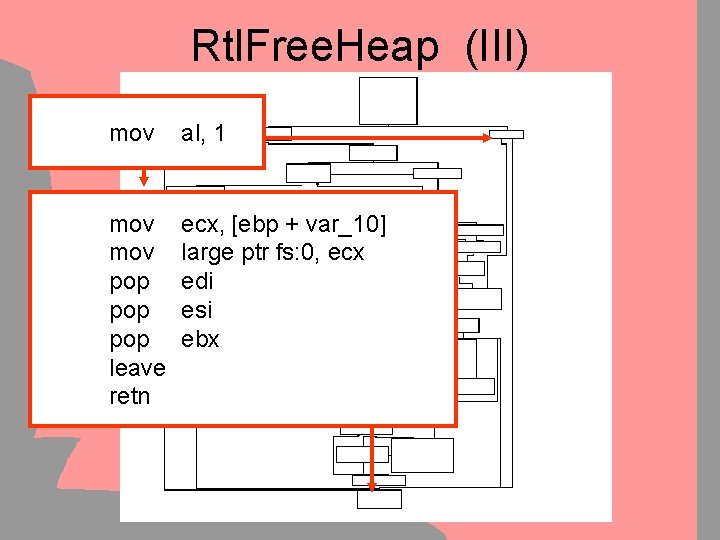
Rtl. Free. Heap (III) mov al, 1 mov pop pop leave retn ecx, [ebp + var_10] large ptr fs: 0, ecx edi esi ebx
Simple Flow Graphs Graph Coloring & Reduction Rtl. Free. Heap(/* snip */ void *blk) { if(blk == NULL) return(TRUE);
![Rtl. Free. Heap (IV) mov or test jnz ebx, [ebp + arg_4] ebx, [edi Rtl. Free. Heap (IV) mov or test jnz ebx, [ebp + arg_4] ebx, [edi](http://slidetodoc.com/presentation_image_h/36abac55ad8887e5df1633871d6caf1e/image-14.jpg)
Rtl. Free. Heap (IV) mov or test jnz ebx, [ebp + arg_4] ebx, [edi + 10 h] ebx, 7 D 030 F 60 h loc_77 CBA 96 push call jmp edx ebx edi _Rtl. Free. Heap. Slowly loc_77 FCB 6 E 4
Simple Flow Graphs Graph Coloring & Reduction Rtl. Free. Heap(HEAP *h. Heap, DWORD flags, void *blk) { if(blk == NULL) return(TRUE); if((flags | h. Heap->flgs) & FLAGMASK) return( Rtl. Free. Heap. Slowly( h. Heap, flags | (h. Heap->flgs), blk ) );
Rtl. Free. Heap (V)
Rtl. Free. Heap (VI)
Rtl. Free. Heap (VII)
Simple Flow Graphs Graph Coloring & Reduction • Graph Coloring helps … – – … to see progress (Motivation boost ) … to keep track of covered code … to ensure no codebranch is missed … to “show results” to management • Graph Reduction helps – … to clarify complex situations – … to see progress (“Only 5 Nodes left !”) – … to make sure nothing is missed
Rtl. Free. Heap (VIII)
Rtl. Free. Heap (IX)
Rtl. Free. Heap (X)
Rtl. Free. Heap (XI)
Pointer Control Graphs Structure/Class Reconstruction • All information about structures and their layout gets lost in the compilation process • If we look for buffer overruns, we need to know buffer sizes • Manual structure reconstruction is an incredibly tedious, repetitive and annoying process ! Specialized Graphs might help
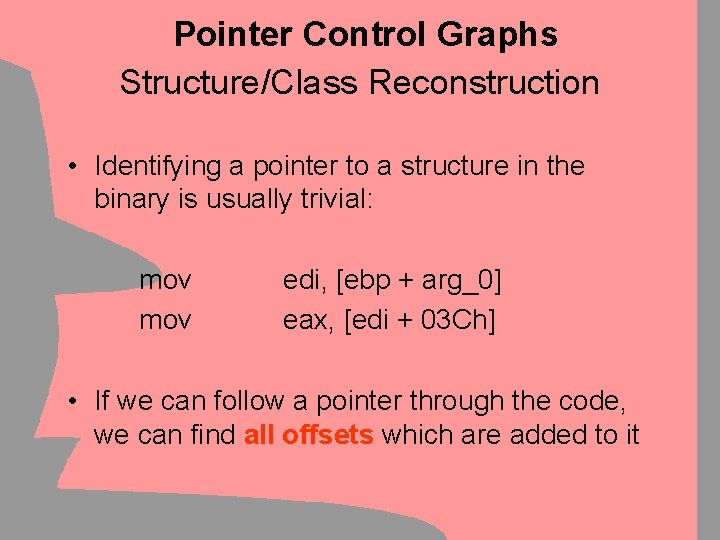
Pointer Control Graphs Structure/Class Reconstruction • Identifying a pointer to a structure in the binary is usually trivial: mov edi, [ebp + arg_0] eax, [edi + 03 Ch] • If we can follow a pointer through the code, we can find all offsets which are added to it
Pointer Control Graphs are best suited for this: • Start tracing code at a location, tracking a specific register/stack variable • Trace code downards until • • A (local) branch is encountered A write access to our variable is encountered A read access to our variable is encountered (Optional: A far branch (subfunction call) is encountered)
Pointer Control Graphs As soon as any of the above situations are encountered, do the following: • In case of a local branch: • Behave as if we’re building a flowgraph “split” the path and follow both codepaths downwards • In case of a register/variable write • Abort the tracing as our register/variable has been overwritten • In case of a register/variable read • “Split” the path and follow the codepaths for both the new and the old register/variable • In case of a non-local branch (optional) • Trace into subfunctions and follow possible argument passing (tricky on x 86 due to argument passing in both registers and stacks variables)
Pointer Control Graphs Class Reconstruction Example: A simple Constructor for the IIS-Internal HTTP_REQUEST – Object: • • Visual C++ compiled code: this - Pointer in ECX Every move of ECX into another register needs to be tracked Every move of ECX into a stack variable needs to be tracked Tracking has to be recursive: Other registers are to be treated like ECX • Demonstration
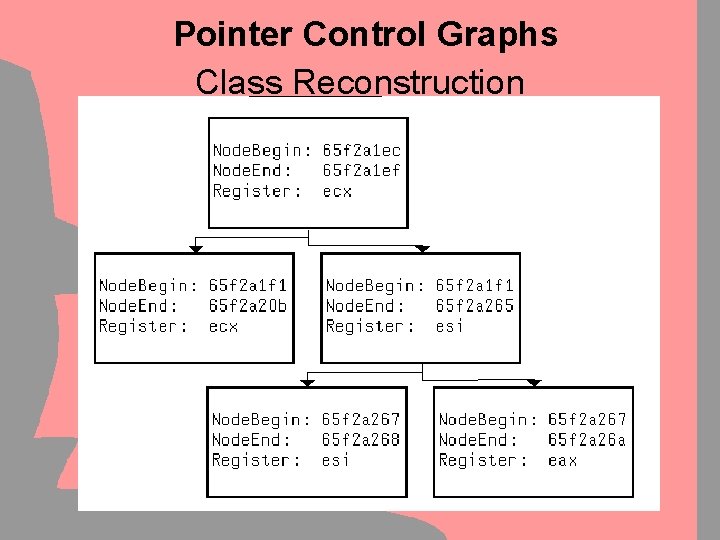
Pointer Control Graphs Class Reconstruction
Pointer Control Graphs Class Reconstruction Example: A simple Constructor for the IIS-Internal HTTP_REQUEST – Object: • Single Functions do usually not access all structure members • C++ Inheritance can lead to calling multiple Constructors subsequently • Subcall recursion and tracking of registers through subcalls is needed for decent structure reconstruction • Demonstration
Pointer Control Graphs Class Reconstruction
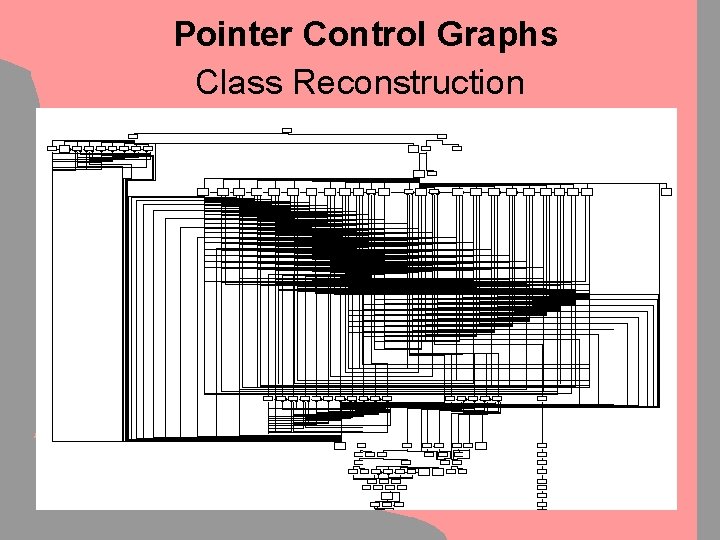
Pointer Control Graphs Class Reconstruction Summary: • Structure data layouts can be automatically reconstructed from the binary by constructing & parsing pointer control graphs • Class data layouts can be automatically reconstructed from the binary by constructing & parsing pointer control graphs and vtables • Larger graphs can be too complex to display • RPC interfaces (such as COM/COM+/DCOM) help us by publically exporting vtables for certain objects • Structure/Class reconstruction speeds up the binary analysis process by a large factor ! • TODO: Automatic type reconstruction from known library calls
Buffer Definition Graphs Finding buffer definitions Problem: – Many problematic functions are not dangerous if the target buffer is big enough to hold all data – These functions work on char *, which do not tell me the size of their buffers – Tracking down where a char * came from is slow, boring, tedious and annoying – In complex situations (multiple recursive functions etc. ) it is quite easy to get lost and miss definitions Specialized Graphs might help
Buffer Definition Graphs Inverse Variable Tracking Trace code upwards and track a variable/register until • The current instruction was target of a branch • The current register is written to from another register/variable • The current register is loaded with something • The current register is a return value from a function
Buffer Definition Graphs Inverse Variable Tracking • The current instruction was target of a branch – “Multi-Split” the graph (there can be more than 2 references) and trace further upwards • The current register is written to from another register/variable – Follow this new register/variable, no need for splitting • The current register is loaded with something – Analyze the situation, color the node blue for success and red for failure (ALPHA CODE) • The current register/variable is manipulated in a way that we cannot cope with – Color the node red (ALPHA CODE)
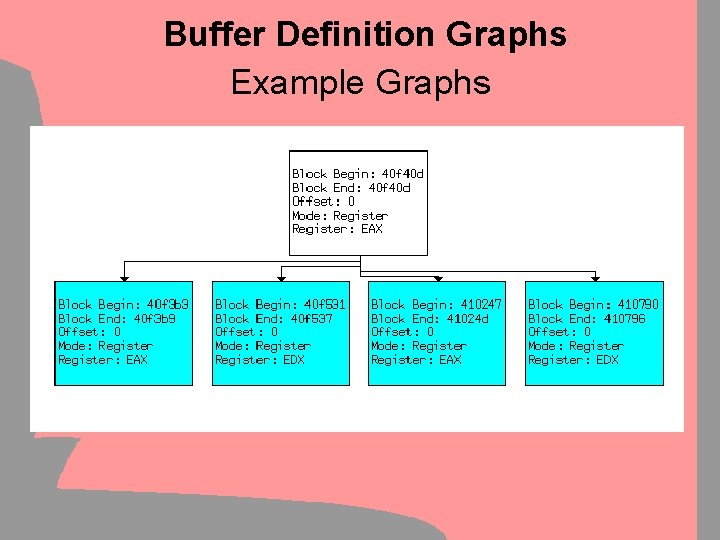
Buffer Definition Graphs Example Graphs
Buffer Definition Graphs Any questions ?

- Slides: 38