Graph the linear equation yx 2 1 Draw


")


 Each domain value is paired with exactly 1 range")


, (3, 6), (4, 8)} • {(2,")
, (0, 1), (2,")

, (3, 0), (5,")

")


, (2, 4), (3, 5)} as a table, as a")

, (3, 0), (5,")
, (4, 4), (6, 8)} as a table and as")
, (2, 5), (3, 5)} as a table and as")


 is a solution of 3 x + y")

 • relation • x-value • Domain")
 of a. SET: Linear ORDERED")


 is on the graph of x")
? IV 2.")
, (3, 0), (5,")
, (4, 7), (6, 8)} as a table, as a")
, (2, 4), (1, 5)} as a table, as a")


 (-3, 3)")
, (12, – 1), (13, 0),")
 = 3 x +")

? IV 2.")


2 - 5 y")


 For Linear Equations, ORDERED PAIRS are solutions GRAPH")


 = 6 - 2 x if")
 = 6 - 2 x if the domain")


, (3, 0), (5,")
 = -5 x + 3 y+x=7 2. Define function. Identify if")
 = -5 x + 3. Use a table. 1. Draw a table")

 For Linear Equations, ORDERED PAIRS are solutions GRAPH")


 = 3")


 = x – 3 x – 1. Find")

 = 4 x – x 2. Find f (x +")

 when r")

 If h(z) = z 2 - 4 z + 9, find each")
 is another way to write “y” in functional notation y is")


- Slides: 153
Graph the linear equation. y=x– 2 1. Draw a table & Choose 3 values for x and solve for ‘y’. Evaluate for x= ( -1, 0, 1) x y – 1 – 3 0 – 2 1 -1 2. Plot points. y=x– 2 y = (– 1) – 2 y = (1) – 2 y=1– 2 y = -1 y = -3 y = (0) – 2 y = – 2 3. Draw a line through all points to show all ordered pairs that satisfy the equation. REMEMBER: Draw arrows on both “ends” of the line.
Graph the linear equation. 1. Draw a table & Choose 3 values for x and solve for ‘y’. Evaluate for x= ( -1, 0, 1) x y – 1 1 0 2 1 3 2. Plot points. y=x+2 y = (– 1) + 2 y= (1) + 2 y=3 y=1 y=(0) + 2 y= 2 3. Draw a line through all points to show all ordered pairs that satisfy the equation. REMEMBER: Draw arrows on both “ends” of the line.
Name the ordered pairs for each letter. 6 A 5 A = (-6, 6) 4 B = (-5, 2) 3 2 B -6 -5 -4 E 1 -3 -2 -1 0 D = (4, 3) C 1 2 3 4 5 -1 I -3 -4 -5 -6 6 E = (-6, -1) F = (-5, -5) G = (-1, -2) G-2 F C = (0, 1) D H H = (1, -5) I = (4, -3)
Domain & 1 5 7 0 -1 11 2 range mapping
• mapping - an illustration how each element of the domain is paired with an element in the range. In this relation: -5 is mapped onto 12, 1 is mapped onto 18, 100 is mapped onto 117.
• mapping - an illustration how each element of the domain is paired with an element in the range. 1 5 7 0 -1 11 2 Relation {(1, 0), (5, 2), (7, 2), (-1, 11)} Domain {1, 5, 7, -1} Range {0, 2, 11}
(domain does not repeat, range) Each domain value is paired with exactly 1 range value. FUNCTIONS Many to One Relationship One to One Relationship NOT FUNCTIONS One to Many Relationship
Give the domain and range of each relation. Tell whether the relation is a function and explain. a. {(8, 2), (– 4, 1), (– 6, 2), (1, 9)} b. D: {– 6, – 4, 1, 8} R: {1, 2, 9} The relation is a function. Each domain value is paired with exactly one range value. D: {2, 3, 4} R: {– 5, – 4, – 3} The relation is not a function. The domain value 2 is paired with bot – 5 and – 4.
Identifying Functions Give the domain and range of the relation. Tell whether the relation is a function. Explain. – 4 – 8 4 5 2 1 Use the arrows to determine which domain values correspond to each range value. D: {– 4, – 8, 4, 5} R: {2, 1} This relation is a function. Each domain value is paired with exactly one range value.
Relations A relation is a mapping, or pairing, of input values with output values. The set of input values is called the domain. The set of output values is called the range. A relation as a function provided there is exactly one output for each input. It is NOT a function if at least one input has more than one output Identify the Domain & Range. Then tell if the relation is a function. Input Output -3 3 1 1 3 -2 4 Domain = {-3, 1, 3, 4} Range = {3, 1, -2} Function? Yes: each input is mapped onto exactly one output
Identify the Domain and Range. Then tell if the relation is a function. Input Output -3 3 1 -2 4 1 4 Domain = {-3, 1, 4} Range = {3, -2, 1, 4} Notice the set notation!!! Function? No: input 1 is mapped onto Both -2 & 1
Give the domain and range of the relation. Tell whether the relation is a function. Explain. D: {5, 10, 15}; R: {2, 4, 6, 8}; The relation is not a function since 5 is paired with 2 and 4.
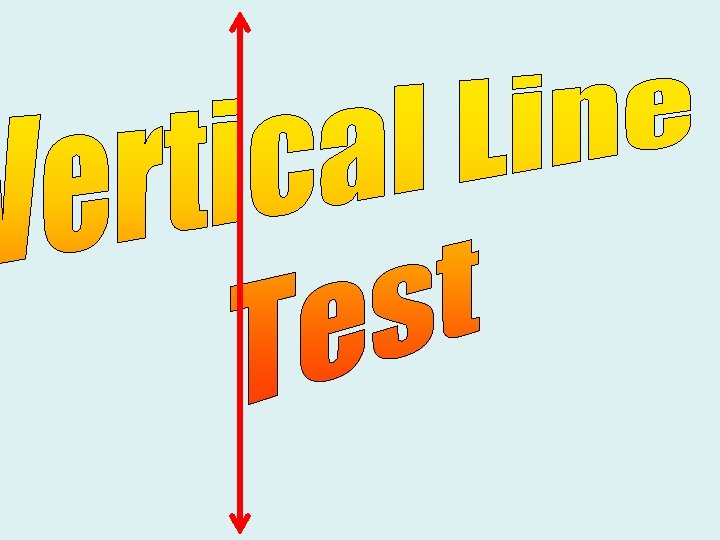
Tests for function 1. Ordered pairs or mappings 1 st value of ordered pairs should be different. 2. vertical line test vertical line cannot intersect a graph at in more than one point
Is the relation a function? • {(2, 4), (3, 6), (4, 8)} • {(2, 4), (3, 4), (4, 4)} • {(2, 4), (2, 6), (2, 8)} • {(2, 5), (3, 7), (4, 9)}
Write the domain and range of each relation. 1. {(-2, -1), (0, 1), (2, 3), (4, 5)} {-2, 0, 2, 4}; {-1, 1, 3, 5} 2. {(0. 5, -4), (0. 75, -2), (1. 25, -1)} {0. 5, 0. 75, 1. 25}; {-4, -2, -1} Determine whether each relation is a function. 3. 4. x 1 2 3 4 y 1 2 3 4 YES x -1 0 -1 -2 y -2 0 2 -4 x 0 1 2 3 y 3 4 NO 5. YES
5 -Minute Check Write the domain and range of the relation. Then determine whether each relation is a function. 1) 2) x 4 1 3 6 y 2 3 3 4 D= {4, 1, 3, 6}; R= {2, 3, 4}; yes {(4, 2), (-3, 2), (8, 9), (7, 5)} D={4, -3, 8, 7}; R= {2, 9, 5}; no
Determine whether each relation is a function. Why? A. {(2, 3), (3, 0), (5, 2), (-1, -2), (4, 1)} Each element of the domain only has one element of the range. There are no repeats in the domain. No repeats in the domain means this is a function. B. C. X 3 4 -3 -8 Y 0 -6 10 List relations in ordered pairs: {(3, 0), (4, -6), (-3, 10), (-8, 10)} • no repeats in the domain. • arrows leaving domain don’t repeat. • No repeats in domain – it is a function. 5 in the x pairs up with both 2 and 3 in the y. • one domain pairs with two different ranges. • a repeat in the domain. • A repeat in domain - not a function.
DOMAIN RANGE REAL LIFE
• relation - set of ordered pairs (like the ones from the example) New terms: • domain - the set of first coordinates of the ordered pairs This is also considered the independent variable. It changes due to human input or time. In math, it is the x-value. • range - the set of second coordinates of the ordered pairs This is also considered the dependent variable. It changes because the domain (independent variable) changed. In math, it is the y-value. Remember, the domain is the x-value - the independent variable. The range is the y-value - the dependent variable.
5 -2: Relations In the U. S. , the manatee, an aquatic mammal, is considered endangered. In the table below, the number of manatees that have been found dead since 1981.
The manatee data can be represented by a set of ordered pairs (below. } (year, # of manatees) {(1981, 116), (1982, 114), (1983, 81), (1984, 128), (1985, 119), (1986, 122), (1987, 114), (1988, 133), (1989, 168), (1990, 206), (1991, 174), (1992, 163), (1993, 145), (1994, 193), (1995, 201), (1996, 415), (1997, 242), (1998, 231)} Each ordered pair can then be graphed.
Relations Identify the domain & range from the manatee data. All of the dates (1 st values)are in {(1981, 116), (1982, 114), the domain. {(1981, (1983, 81), (1984, 128), The # of manatee (2 nd values) are (1983, (1985, 119), (1986, 122), in the range. (1985, (1987, 114), (1988, 133), Domain & range can be listed: (1987, (1989, 168), (1990, 206), (1989, (1991, 174), (1992, 163), D: {1981, 1982, 1983, 1984, 1985, 1986, (1991, 1987, 1988, 1989, 1990, 1991, 1992, 1993, (1993, 145), (1994, 193), 1994, 1995, 1996, 1997, 1998} (1995, 201), (1996, 415), R: {116, 81, 128, 119, 122, 133, 168, 206, (1995, (1997, 242), (1998, 231)} 174, 163, 145, 193, 201, 415, 242, 231} (1997, There are many ways to represent data. We looked at the manatee data as ordered pairs, a table, and a graph. Data can also be represented in a mapping.
Relations EX: Represent the relation shown in the graph below as: A. a set of ordered pairs, B. a table, and C. a mapping. D. The determine the domain & range. A. Determine coordinates of each point. Write the ordered pairs. Start on the left and work your way right. {(-3, 3), (-1, 2), (1, 1), (1, 3), (3, -2), (4, -2)} B. Make a table and put the values in: C. Write the x’s Write the y’s Draw arrows to match pairs. D. D = {-3, -1, 1, 3, 4} R = {-2, 1, 2, 3} -3 -1 1 3 4 3 2 1 -2 NOTICE: There are no repeat between the domain and range. They are listed in order from least to greatest.
Express the relation {(1, 3), (2, 4), (3, 5)} as a table, as a graph, and as a mapping diagram. Table x y 1 3 2 4 3 5 Use the x- & y-values to Mapping Diagram plot the ordered pairs. y x Graph x-values under “x” y-values under “y”. 1 3 2 4 3 5 Write all x-values under “x” & all y-values under “y”. Draw an arrow from each x-value to its corresponding y-value.
Give the domain and range of the relation. domain value is all x-values from 1 through 5, inclusive. Domain: 1 ≤ x ≤ 5 range value is all y-values from 3 through 4, inclusive. Range: 3 ≤ y ≤ 4 6 5 2 1 – 4 – 1 0 The domain values are all x-values 6, 5, 2, and 1. Domain: {6, 5, 2, 1} The range values are y -values – 4, – 1, and 0. Range: {– 4, – 1, 0}
Determine whether each relation is a function. Why? A. {(2, 3), (3, 0), (5, 2), (-1, -2), (4, 1)} There are no repeats in the domain. - is a function. B. C. X 3 4 -3 -8 Y 0 -6 10 {(3, 0), (4, -6), (-3, 10), (-8, 10)} • no repeats in the domain. • arrows leaving domain don’t repeat. • it is a function. 5 in the x pairs up with both 2 and 3 in the y. • one domain pairs with two different ranges. • a repeat in the domain. • A repeat in domain - not a function.
Express the relation {(2, 3), (4, 4), (6, 8)} as a table and as a mapping diagram and identify if it is a function. List the domain and range. Table x y 2 3 4 4 7 6 8 Mapping Diagram x y 2 3 4 4 6 8 is a function Domain (2, 4, 6) Range (3, 4, 8, )
Express the relation {(1, 3), (2, 5), (3, 5)} as a table and as a mapping diagram. Identify the domain and range. Table x y 1 3 2 5 3 5 Mapping Diagram y x 1 3 2 5 3 is a function Domain (1, 2, 3) Range (3, 5, )
Relations Express the relation shown in the mapping as a set of ordered pairs. Identify the domain and range. Then write the inverse of this relation. X Y -1 3 4 Relation = {(3, 2), (4, -6), (3, -4), (-1, -6)} Domain = {-1, 3, 4} Range = {-6, -4, 2} Inverse = {(2, 3), (-6, 4), (-4, 3), (-6, -1)} -6 -4 2 BIG HINT: Your 3 -Strikes and Homework should look like this answer!!!
5 -2: Relations 5. 2. 2 DEFINITION OF THE INVERSE OF A RELATION Relation Q is the inverse of relation S if and only if for every ordered pair (a, b) in S, there is an ordered pair (b, a) in Q. EXAMPLE 2: Express the relation shown in the mapping as a set of ordered pairs. Write the inverse of the relation and draw a mapping to model the inverse. X 1 2 3 4 Y -3 -2 -1 The mapping shows the relation {(1, -3), (2, -2), (3, -1), (4, -1)}. To get the inverse, switch the x- and y-values: {(-3, 1), (-2, 2), (-1, 3), (-1, 4)}. Then map the inverse. -3 -2 -1 1 2 3 4
EX: Solve y = x + 6. If the domain is {-4, -3, -1, 2, 4}. Graph the solution set. Make table with given x-values. Determine the y-values. Write solutions as ordered pairs. Then plot the points. The solution set is: {(-4, 2), (-3, 3), (-1, 5), (2, 8), (4, 10)}.
Warm Up Solve each equation. 1. 5 x + 0 = – 10 – 2 2. 33 = 0 + 3 y 11 3. 1 4. – 5 y – 1 = 7 y + 5 5. 6(x – 1) where x = 5 24 6. 10 + (5 – 1)s where s = – 4 – 6 7. Evaluate when x=2, y=3, and n=4 8. Evaluate y = for x={– 10, – 5, 0, 5, 10}
Evaluate when x=2, y=3, and n=4 C Substitute in the values for the variables Exponents (powers) 33 = (3)(3)(3) = 27 Add: 2 + 27 Subtract 29 - 5 Exponents (powers) 62 = (6)(6) = 36 Subtract 24 - 16 Add
Warm Up 6. Evaluate y = for x={– 10, – 5, 0, 5, 10} =– 1 y= (– 10) y= (– 5) =0 y= (0) =1 y= (5) =2 y= (10) =3
Solution of an equation w/ one variable (one # which makes the equation true. Is 3 a solution of 2 x + 3 = 11? 2(3) + 3 = 11 Substitute 3 for x. 6 + 3 = 11 False equation 3 is not a solution of 2 x + 3 = 11. Is 4 a solution of 2 x + 3 = 11? 2(4) + 3 = 11 Substitute 4 for x. 8 + 3 = 11 True equation 4 is a solution of 2 x + 3 = 11. Linear equation with two variables (x, y) 1. Substitute: x value in place of x (x, y) y value in place of y. (– 1, 3) 2 y – x = 7 2(3) – (– 1) = 7 7=7 Original Equation Substitute for x and y. Equation is satisfied.
SOLUTIONS TO EQUATIONS WITH 2 VARIABLES SUBSTITUTION & SOLVE to determine whether the equation is true x + y = 3 substitute (0, 3) (0) + (3) = 3 3 = 3 TRUE STATEMENT *If they are true, then the coordinates are an ordered pair of the linear equation.
Substitute the ordered pair in the linear equation y= ½ x – 2 and solve. (7, 2) (1, 1) (8, 2) (-4, -6) (-4, -4) (-6, 1) (0, -6) (-8, -6) (8, -2) (0, 0) (0, -2) (4, 4) (6, 1) (2, -3) (-6, -5) (-1, -5) (-2, -3) (6, 3) (3, -2) (1, -1) (4, -1) (5, 0) (4, 0) (-1, -3) (-7, -4) (0, -5) (-2, 0)
Graph your ordered pair. If it was true, use blue. If false, use red. ½ y= x 2 – Equations with two variables, have ordered pairs (x, y) as solutions. Ordered pair solutions can be presented on a graphing the equation (graphing all solutions (ordered pairs) of an equation on a graph. )
Ordered pairs which are solutions to y= ½ x – 2 are blue. (7, 2) (1, 1) (8, 2) (-4, -6) (-4, -4) (-6, 1) (0, -6) (-8, -6) (8, -2) (0, 0) (0, -2) (4, 4) (6, 1) (2, -3) (-6, -5) (-1, -5) (-2, -3) (6, 3) (3, -2) (1, -1) (4, -1) (5, 0) (4, 0) (-1, -3) (-7, -4) (0, -5) (-2, 0)
Solution sets for Linear Equations ordered pairs that make an equation true will form a line Try this with the other points on this graph. (0 0) (x , , y) y = 4 x (1 , 4) (x , y) (-2 , -8) y = 2 x (0) = 2(0) 0=0 (-8) = 4(-2) -8 = -8 y = 4 x +0 (4) = 4(1) +0 4=4 Are there any points in-between these points on the graph? YES -These are points of a linear equation. “ordered pairs that make an equation true will form a line” This means: all points lying on same line are a solution to linear equation with 2 variables (equation whose graph is a line. )
Solution of an equation with two variables is the set of all points (x, y) whose coordinates satisfy the equation. Determining Whether a Point is on a Graph Tell whether (3, 2) is on the graph of 2 x + 5 y = 16. Substitute: 2 x + 5 y = 16 ? 2(3) + 5(2) =16 ? 6 + 10 = 16 (3, 2) is a solution to 2 x + 5 y = 16, 16 = 16 (3, 2) is on the graph of the line. Substitute: (2, 2) 2 x + 5 y = 16 ? 16 2(2) + 5(2) = ? 4 + 10 = 16 14 16 (8, 0) (2, 2) is not a solution to 2 x + 5 y = 16, (2, 2) is not on the graph. 2 x + 5 y = 16 ? 2(8) + 5(0) = 16 ? 16 + 0 = 16 16 = 16 Since (8, 0) is a solution (8, 0) is on the graph.
Determining Whether a Point is on a Graph Without graphing tell whether each point is on the graph: x – 3 y = 12 (5, 1) (1. 5, – 3. 5) (0, – 4) Substitute: x – 3 y = 12 ? (5, 1) is not a solution & is not on the graph. Substitute: 5 – 3(1) = 12 ? 5 – 3 = 12 2 12 x – 3 y = 12 ? 0 – 3(– 4) = 12 (0, – 4) is a solution to x – 3 y = 12, ? (0, – 4) is on 0 + 12 = 12 the graph. 12 = 12
Determining Whether a Point is on a Graph Without graphing tell whether each point is on the graph of x – 3 y = 12. (1. 5, – 3. 5) Substitute: x – 3 y = 12 ? 1. 5 – 3(– 3. 5) = 12 ? 1. 5 + 10. 5 = 12 12 = 12 Since (1. 5, – 3. 5) is a solution to x – 3 y = 12, (1. 5, – 3. 5) is on the graph.
Finding solution sets for Linear Equations STEPS 1. Choose any value to substitute for x 2. solve for y. y = 4 x y = 4(1) y=4 Original Equation Substitute for x Solve for y. (1 , 4) is a solution If x = -2, If x = 1, then what does y=? y = 4 x y = 4(-2) y = -8 List ordered pair Original Equation Substitute for x Solve for y. (-2 , -8) is a solution List ordered pair
Finding solutions to equations EVALUATING EQUATIONS Think of a linear equation as an input-output machine. For y = 5 x, ‘input’ a value for x, the ‘output’ is 5 x. EX Input 6 for x and find the output. 6 y = 5 x y = 5(6) y = 30 30
Finding solutions to equations Evaluate the function for the given input values. Find y when x = 7 Find y when x = -4 y = 3(x) + 2 Substitute y = 3(– 4) + 2 Substitute y = 3(7) + 2 7 for x. y= – 12 + 2 – 4 for x. y= 21 + 2 Simplify. y= – 10 y= 23 solution set? (-4, -10) (7, 23) For y = 5 x – 5 Find y when x = 6 Find y when x = -2 y = 5 x – 5 y = 5(6) – 5 y = 5(– 2) – 5 Y = – 10 – 5 y= 30 – 5 y= 25 y= – 15 (6, 25) solution set? (-2, -15)
Evaluate the linear equation for the given values. Find ‘y’ when x = – 3. Find ‘y’ when x = 1. y = 2 x – 1 y = 2(1) – 1 y = 2(– 3) – 1 y= 2 – 1 y= – 6 – 1 y= – 7 y= 1 solution set? (1, 1) (-3, -7)
Is there a relationship between your height and shoe size? 45 42 39 36 Can you predict how big a foot someone would be with a height of 96 inches? Foot length (cm) 33 30 27 24 21 18 15 12 9 6 3 0 0 8 16 24 32 40 48 56 64 height (inches) 72 80 88 96 104
TRY THESE Write four solutions for each equation. Write the solutions as ordered pairs. 1. y = 2 x – 4 2. y = x/2 – 3 3. x + y = 12 Determine whether each relation is linear. 4. x – y = 32 5. 25 – y 2 = x 2
1. Tell whether( – 8, 7) is a solution of 3 x + y = – 17. List four solutions of the equation. 2. – 5 x + y = 2 3. 4 x + y = 10 ( – 1, – 3 ) , ( 0, 2 ) , ( 1, 7 ) , ( 2, 12 ) ( – 1, 14 ), ( 0, 10 ), ( 1, 6 ), ( 2, 2 ) List four solutions of the equation. 4. 6 x – y = 2 ( – 1, – 8 ), ( 0, – 2 ), ( 1, 4 ), ( 2, 10 ) Which of the points lies on the line 2 x + 3 y = 6? A. B. C. D. (0, 2) (0, 3) (1, 2) (3, 1) Yes
SYNONYMS FUNCTIONS GRAPHING • ordered pairs (x, y) • relation • x-value • Domain • y-value • range • Linear equation • Function
• –GRAPH SOLUTION (the. Equation list of solutions) of a. SET: Linear ORDERED PAIRS are solutions for Linear drawing that represents the solution set. Equations. (A LINE) y (– 2, 0) (0, 2) 2 (4 , 0) – 3 1 2 x y=x+2 3 y = x + 2 substitute (0, (4, 2) 0) (2) (0) = (0) (4) + 2 2 STATEMENT 0= 2 6 TRUE FALSE! (– 2, 0) and (0, 2) are part of the solution set for linear equation y = x + 2
SOLUTIONS TO EQUATIONS WITH 2 VARIABLES SUBSTITUTION & SOLVE to determine whether the equation is true y = x - 5 substitute (0, 2) (2) = (0) - 5 2 = -5 FALSE! y = 3 + x substitute ( 5 , 2) FALSE y = 3 + x substitute (-3, 0)TRUE y = 3 + x substitute (2, 5)TRUE y = 3 + x substitute (3, 0)FALSE *If they are true, then the coordinates are an ordered pair of the linear equation.
Determining Whether a Point Is on a Graph Without graphing, tell whether the point (– 2, 10) is on the graph of Substitute (– 2, 10) into ? = ? 10 = 2 + 8 10 = 10 Since (– 2, 10) is a solution of (– 2, 10) is on the graph. ,
Determining Whether a Point Is on a Graph Without graphing, tell whether the point (– 4, 0) is on the graph of Substitute (– 4, 0) into ? = ? 0= 8+ 8 0 ≠ 16 Since (– 4, 0) is not a solution of 4, 0) is not on the graph. , (–
Quadratic Equations and Their Graphs For any quadratic equation in two variables • all points on its graph are solutions to equation. • all solutions to the equation appear on its graph. Is the point (4, 16) on the graph of ? Substitute (4, 16) is a solution of (4, 16) is on the graph. ? = ? Simplify 16 = 8 + 8 16 = 16 ,
Without graphing, tell whether the point (1, 1) is on the graph of x 2 + y = 2. Substitute (1, 1) into x 2 + y = 2 2. ? 12 + 1 = 2 ? 1 + 1= 2 2 = 2 Since (1, 1) is a solution of x 2 + y = 2, (1, 1) is on the graph.
1. In which quadrant is the point with coordinates (7, – 2)? IV 2. In which quadrant is the point with coordinates (– 14, – 7) located? 3. Name four ordered pairs. Provide one for each of the quadrants III formed by the coordinate plane. Explain. 4. In which quadrant are both coordinates of a point negative? III 5. In which quadrant is x-coordinate negative & y-coord. positive? II 6. Graph the point C(1, 3). 7. The scatter plot shows the # of flower orders placed before Valentine’s Day at one shop. Based on this relationship, predict the # of flower orders placed on February 12. about 45 5 -10 -5 0 5 10 -5 8. Evaluate the following if x = -2 and y = -3 2 x - 4 y 8 7 – x – y 12 6 - -x + -y 7
Determine whether each relation is a function. Why? A. {(2, 3), (3, 0), (5, 2), (-1, -2), (4, 1)} There are no repeats in the domain. - is a function. {(3, 0), (4, -6), (-3, 10), (-8, 10)} B. X Y 3 • no repeats in the domain. 0 4 -6 • arrows leaving domain don’t repeat. -3 10 -8 • it is a function. 5 in the x pairs up with both 2 and 3 in the y. C. • one domain pairs with two different ranges. • a repeat in the domain. • A repeat in domain - not a function. Express the relation {(2, 3), (4, 7), (6, 8)} as a table, as a graph, and as a mapping diagram. State whether it is a function. Express the relation {(1, 3), (2, 4), (1, 5)} as a table, as a graph, and as a mapping diagram. State whether it is a function.
Express the relation {(2, 3), (4, 7), (6, 8)} as a table, as a graph, and as a mapping diagram. Table x Graph Mapping Diagram y x y 2 3 4 7 6 8 it is a function.
Express the relation {(1, 3), (2, 4), (1, 5)} as a table, as a graph, and as a mapping diagram. Table x y 1 3 2 4 1 5 Graph Mapping Diagram y x 1 3 2 4 5 not a function.
Define: • function – • ordered pair • relation – • vertical axis – • origin • domain – • horizontal axis – • range – List the domain and range for the relation -> {(1, 2), (3, 5), (8, 4), (6, 2), (3, 1), (7, 4)} Complete a table for the given info: Domain: {-4, -2, 0} Range: {5, 6, 2} x y Graph the relation on a coordinate plane (-3, 3), (1, -2), (1, 1), (4, 4) (3, 1), (4, -2)
Graphing Terms: • function - a relationship between input and output the output depends on the input and there is only one output for every input • vertical axis - the upward axis represents current car value from the sample graph • horizontal axis - the sideways axis represents age of car from the sample graph • ordered pair - a pair of numbers used to locate points on a graph examples from the sample graph are: (2, 8), (1, 11), and (3, 6) in ordered pairs, the horizontal # always comes first • origin - the point on a graph where all values are zero Generally, this is the point (0, 0).
relation - a set of ordered pairs domain - the set of first numbers from a set of ordered pairs range - the set of second numbers from a set of ordered pairs The following is a relation. The domain is in blue and the range is in red. relation -> {(1, 2), (3, 5), (8, 4), (6, 2), (3, 1), (7, 4)} domain -> {1, 3, 8, 6, 3, 7} {1, 3, 6, 7, 8} To “spell” it right, range -> {2, 5, 4, 2, 1, 4} {1, 2, 4, 5} in order & no repeats. Complete a table for the given info: Domain: {-4, -2, 0} Range: {5, 6, 2} x -4 -2 0 y 5 6 2
Graphing Relations Quadrant II X<0, y>0 Quadrant I X>0, y>0 (4, 4) (-3, 3) Origin (0, 0) (1, 1) (3, 1) (1, -2) (4, -2) Quadrant III X<0, y<0 Quadrant IV X>0, y<0
Which relation is a function? A. {(11, – 2), (12, – 1), (13, 0), (21, 8)} B. {(1, – 2), (2, – 1), (3, 0), (1, 4)} C. {(1, – 2), (1, – 1), (1, 0), (1, 1)} D. {(11, – 2), (10, – 1), (10, 9), (11, 9)} What is the domain of the function shown in table? A. {1, 3, 5, 8} B. {4} C. {7} D. {– 2, 0, 2} For f(x) = 3 x + 2, find f(x) when x = 7 & x = – 4.
Evaluate the function for the given input values. For f(x) = 3 x + 2, find f(x) when x = 7 & x = – 4. f(x) = 3(x) + 2 f(7) = 3(7) + 2 = 21 + 2 f(x) = 3(x) + 2 Substitute 7 for x. Simplify. = 23 f(– 4) = 3(– 4) + 2 = – 12 + 2 = – 10 For h(c) = 2 c – 1, find h(c) when c = 1 and c = – 3. h(c) = 2 c – 1 h(1) = 2(1) – 1 h(c) = 2 c – 1 h(– 3) = 2(– 3) – 1 =2– 1 = – 6 – 1 =1 = – 7 Substitute – 4 for x. Simplify.
Solve each equation or inequality. 1. 3 x – 2 = 13 x=5 2. 6 – 5 x = 21 3. (2 x + 7)/3 = x + 3 x = -2 4. -12 x > -24 x<2 5. 7 x < 2 x – 25 x = -3 x < -5
1. In which quadrant is the point with coordinates (7, – 2)? IV 2. In which quadrant is the point with coordinates (– 14, – 7) located? III 3. Name four ordered pairs. Provide one for each of the quadrants formed by the coordinate plane. Explain why you selected those you chose. 4. In which quadrant are both coordinates of a point negative? III 5. In which quadrant is the x-coordinate negative and the y-coordinate positive? 6. Graph the point C(1, 3). II 7. The scatter plot shows the # of orders placed for flowers before Valentine’s Day at one shop. Based on this relationship, predict the # of flower orders placed on February 12. about 45 5 -10 -5 0 5 -5 8. Is each equation a linear equation ? 2 x 2 - y = 7 no 4 x = 7 + 2 y yes x = 12 yes 10
http: //www. brainpop. com/math/algebra/graphinglinearequations/
TABLE METHOD STEPS: used to draw the graph of an equation: x y 1. Create table & find solutions (ordered pairs) 3 POINTS FOR LINEAR 5 POINTS FOR NON-LINEAR – 0 , 1 positive #, 1 negative # - 0 , 2 positive #s 2 negative #s (Substitute value for x. Solve for y. ) 2. Plot points on coordinate plane. 3. Draw a line thru the points, w/ arrows at both ends.
Graph the linear equation. y = 3 x – 2 1. Draw a table & Choose 3 values for x and solve for ‘y’. Evaluate for x= ( -1, 0, 1) x y – 1 – 5 0 – 2 1 1 2. Plot points. y = 3(1) – 2 y = 3 x – 2 y = 3(– 1) – 2 y=3– 2 y=1 y = -3 – 2 y = – 5 y = 3(0) – 2 y=0– 2 y = – 2 3. Draw a line through all points to show all ordered pairs that satisfy the equation. REMEMBER: Draw arrows on both “ends” of the line.
GRAPHING TIPS INCHES 10 9 1. Use graph paper. 2. Use the grid of the graph. (Do not re-# or divide grid into smaller segments) 3. Draw small points 4. Use a straight edge 8 7 6 5 4 3 2 1 1 10 2 3 4 5 6 7 DAYS 9 8 7 6 5 4 3 2 1 2 4 6 8 10 8 9 10 11 12
Graph the linear equation. 1. Draw a table & Choose 3 values for x and solve for ‘y’. Evaluate for x= ( -1, 0, 1) x y – 1 5 0 2 1 -1 2. Plot points. y = -3 x + 2 y = -3(– 1) + 2 y= -3(1) + 2 y = -3 + 2 y = -1 y=3+2 y=5 y=-3(0) + 2 y=0+2 y=2 3. Draw a line through all points to show all ordered pairs that satisfy the equation. REMEMBER: Draw arrows on both “ends” of the line.
DON’T HIDE FROM WHAT YOU DONT KNOW HOW TO DO!!! WHEN DOING HOMEWORK: 1. 2. 3. 4. 5. Get your notes out. (your personal tutor) Try each problem using your “personal tutor”. Look answers up & list left of each problem. Highlight where you are getting stuck. Fix your notes in class the next day, by: • comparing them to a friend’s • asking questions during lecture & review • take better notes during lecture
TRY THESE x y Graph the following using table method: y=|x|+1 1. Create table & find solutions (ordered pairs) 3 POINTS FOR LINEAR 0 , 1 positive #, 1 negative # 5 POINTS FOR NON-LINEAR 0 , 2 positive #s 2 negative #s y = -x 2 - 5 y =– 2 x + 3 (Substitute value for x. Solve for y. ) 2. Plot points on coordinate plane. 3. Draw a line thru the points, w/ arrows at both ends.
y= | 1 | + 1 x y – 1 2 0 1 1 2 y = |x | + 1 y = |– 1 | + 1 y=1+1 y= 2 y y=2 y= | 0 | + 1 y=0+1 | x | + 1. x – 2 – 1 0 1 2 Positive Opens up Graph the linear equation. y= 1. Draw a table & Choose 3 values for x and solve for ‘y’. y 3 2 1 2 3 4 2 y=1 x 2. Plot points. – 2 2 3. Draw a line through all points to show all ordered pairs that satisfy the equation. USE AT LEAST 5 Draw POINTS FORon NON-LINEAR REMEMBER: arrows both “ends”EQUATIONSof the line. pick at least 2 negative #s
SYMMETRY The highest or lowest point on the parabola is called the ver tex. axis of symmetry for the parabola is the vertical line through the vertex.
y = -x 2 - 5 y = -(– 1 )2 - 5 y = -1 - 5 x y y = -6 y= -(0 Negative Opens down Graph the linear equation. y = -x 2 - 5 1. Draw a table & Choose 3 values for x and solve for ‘y’. )2 -5 1 -6 y= -( 1 y = -0 - 5 y = -1 – 5 y= -5 y = -6 – 1 -6 0 -5 )2 -5 x y – 3 – 14 – 2 – 9 – 1 – 6 0 – 5 1 – 6 2 – 9 3 – 14 2. Plot points. 3. Draw through all points to show all ordered pairs that satisfy the equation. REMEMBER: Draw arrows on both “ends”. USE AT LEAST 5 POINTS FOR NON-LINEAR EQUATIONS- pick at least 2 negative #s
y =– 2 x + 3 Graph the linear equation. 1. Draw a table & Choose 3 values for x and solve for ‘y’. y= -2(1) + 3 x y – 1 5 0 3 1 1 y = -2 x + 3 y = -2(– 1) + 3 y = -2 + 3 x y y= 1 – 2 – 1 7 5 0 3 1 2 1 – 1 y y=2+3 y=5 8 y=-2(0) + 3 4 y=0+3 y=3 x 4 2. Plot points. 4 8 – 4 3. Draw a line through all points to show all ordered pairs that satisfy the equation. REMEMBER: Draw arrows on both “ends” of the line.
Relations and Functions Example: x -4 -2 0 1 3 y 5 6 2 7 -5 The vertical line test can be used to determine if the relation is a function. Use a straight edge moved slowly across the graph to see if two point touch the edge at the same time. This is a true test for all functions. A Function is a relation in which each element of the domain is paired with exactly one element in the range.
VERTICAL LINES Graph of x = # is a vertical line through (# , 0). Vertical line x=-2 crosses the x axis at (-2, 0) x = – 2 H (4, 6) x=4 G (4, 0) Vertical Lines domain repeats. They are never functions. What is the equation for line HG ?
Vertical Line Test Determine whether x - 4 y = 12 is a function. METHOD 1 Graph it. Try to draw a vertical line through any two points. Is it a linear equation? Yes. Is the linear equation a vertical line? No. Remember: All non-vertical linear equations are functions. This is a function. Cannot draw a vertical line through any two points. It passes the test. This relation is a function.
Complete the tables y= 2 x - 1 -x – 1 = y 3 x – 2 y = 6 x y x y 2 3 2 -3 2 0 0 -1 0 -3 -1 0 -1 -4. 5
Graph: y = x + 1 Table of values
Practice for Examples 3 and 4 5. Gr zph the equation – 2 x + y = 1. ANSWER 6. Explain why no other combo of shawls and scarves are possible in Example 4. ANSWER The numbers of shawls and scarves must be whole numbers.
5 -4: Graphing Linear Equations EXAMPLE 3: Graph the equation 2 x + 5 y = 10. solve equation for y. 2 x + 5 y = 10 -2 x 5 y = 10 - 2 x 5 5 Plot the points and draw a line 2/ x, choosing values of x divisible by five will make the problem easier. y-values will be whole numbers make a table. 5
Sometimes, need to solve for y first, then set up a table of values. Solve 8 x + 4 y = 24 if the domain is {-2, 0, 5, 8}. Two-variable equation solution is a set of ordered pairs. You are given the domain (x-value. ) in each ordered pair, Need the second number, the range (y-value. ) in each ordered pair, To find y, solve the equation for y. x Now make a table. -2 0 5 8 x + 4 y = 24 8 -8 x 6 - 2 x 6 - 2(-2) 6 - 2(0) 6 - 2(5) 6 - 2(8) y 10 6 -4 -10 (x, y) (-2, 10) (0, 6) (5, -4) (8, -10) 4 y = 24 - 8 x 4 4 y = 6 - 2 x {(-2, 10), (0, 6), (5, -4), (8, -10)} This is your solution.
Finding Solutions of an Equation List four solutions of the equation 5 x + y = 12. Solve for y and then find y-values for several x-values. 1 Solve the equation for y. 5 x + y = 12 – 5 x 2 Find y-values for at least x-values. x y = 12 – 5 x ( x, y ) – 1 y = 12 – 5 ( – 1 ) = 17 ( – 1, 17 ) 0 y = 12 – 5 ( 0 ) = 12 ( 0, 12 ) 1 y = 12 – 5 ( 1 ) = 7 ( 1, 7 ) 2 y = 12 – 5 ( 2 ) = 2 ( 2, 2 ) Four solutions are ( – 1, 17 , ) ( 0, 12 ), ( 1, 7 ), and ( 2, 2 ).
1. Graph y = -5 x + 3 y+x=7 2. Define function. Identify if both graphs are functions 3. What are the synonyms for domain and range? 4. Define : Solutions set for a linear equation Linear equation 5. Determine whether (0, 3) (-3, 6) (4, 2) & (3, 0) are solutions to x + y = 3 6. The table shows the # of cookies in a jar from the time since they were baked. Graph a scatter plot using the given data.
Graph y = -5 x + 3. Use a table. 1. Draw a table & Choose 3 values for x and solve for ‘y’. y= -5(1) + 3 x y – 1 8 0 3 1 -2 2. Plot points. y = -5 x + 3 y = -5(– 1) + 3 y = -5 + 3 y = -2 y=5+3 y=8 y=-5(0) + 3 y=0+3 y=3 3. Draw a line through all points to show all ordered pairs that satisfy the equation. REMEMBER: Draw arrows on both “ends” of the line.
Graph y + x = 7. Use a table. 1. Draw a table & Choose 3 values for x and solve for ‘y’. y +(1) = 7 x y – 1 8 0 7 1 6 y+x=7 y +(– 1) = 7 +1 +1 -1 -1 y=6 y=8 y +(0) = 7 2. Plot points. y=7 3. Draw a line through all points to show all ordered pairs that satisfy the equation. REMEMBER: Draw arrows on both “ends” of the line.
SOLUTION SET: (the list of solutions) For Linear Equations, ORDERED PAIRS are solutions GRAPH of a Linear Equation is the drawing that represents the solution set. Linear Equation(equation whose graph forms a linear. not SUBSTITUTION & SOLVE (determine if equation is true) x + y = 3 substitute (0, 3) TRUE x + y = 3 substitute (-3, 6) TRUE x + y = 3 substitute (4, 2) FALSE x + y = 3 substitute (3, 0) TRUE *If they are true, then the coordinates are an ordered pair of the linear equation.
Graphing a Scatter Plot from Given Data The table shows the number of cookies in a jar from the time since they were baked. Graph a scatter plot using the given data. Use the table to make ordered pairs for the scatter plot. The x-value represents the time since the cookies were baked and the y-value represents the number of cookies left in the jar. Plot the ordered pairs.
Which graph matches the values from the table? A. B. C. D. Graph the equations. y = |x| + 2 y = 2 x + 1 y = 4 x y = 1 2 x – 1
Graph the equation. y = |x| + 2 Positive Opens up Step 1 Choose several values of x and generate ordered pairs. x |x| + 2 = y (x, y) – 1 1+2=3 (– 1, 3) 0 0+2=2 (0, 2) 1 1+2=3 (1, 3) Step 2 Plot enough points to see a pattern.
Graph y = 4 x. Use slope intercept method Step 1 Choose three values of x and generate ordered pairs x y = 4 x (x, y) 1 y = 4(1) = 4 (1, 4) 0 y = 4(0) = 0 (0, 0) – 1 y = 4(– 1) = – 4 (– 1, – 4) Step 2 Plot the points and connect them with a straight line. No vertical line will intersect this graph more than once. So y = 4 x describes a function.
Graphing Linear Equations Graph y = 2 x + 1 Step 1 Choose three values of x and generate ordered pairs. x y = 2 x + 1 (x, y) 1 y = 2(1) + 1 = 3 (1, 3) 0 y = 2(0) + 1 = 1 – 1 (0, 1) y = 2(– 1) + 1 = – 1 (– 1, – 1) Step 2 Plot the points and connect them with a straight line. No vertical line will intersect this graph more than once. So y = 2 x + 1 describes a function.
ph the equation x – 2 y = 2. STEP 1 Solve the equation for y, then make a table by choosing a few values for x and finding the values of y. x – 2 y = 2 – 2 y = – x + 2 y = 1 2 x – 1 x y – 2 STEP 2 Plot the points. Draw a line through them. 0 – 1 2 0 4 1
WARM UP Create a table & graph f(x) = 6 - 2 x if the domain is {-2, 0, 5, 8}. Graph the equation y = 2 - 0. 4 x. Evaluate for x= {-10, -5, 0, 5, 10} Graph y= 3 x -4. Use a table. Determine whether each relation is a function. Why? A. {(2, 3), (3, 0), (5, 2), (-1, -2), (4, 1)} B. X 3 4 -3 -8 Y 0 -6 10 C.
Create a table and graph f(x) = 6 - 2 x if the domain is {-2, 0, 5, 8}. 1. Given the domain (x-value. ) in each ordered pair, 2. To find y, solve the equation for y. 3. Make a table. x -2 0 5 8 4. Plot points. 5. Draw a line 6 - 2 x 6 - 2(-2) 6 - 2(0) 6 - 2(5) 6 - 2(8) y 10 6 -4 -10 (x, y) (-2, 10) (0, 6) (5, -4) (8, -10)
Graphing Linear Equations Graph the equation y = 2 - 0. 4 x. Evaluate for x= {-10, -5, 0, 5, 10} Plot the points and draw a line
Graphing Linear Equations Use a table and graph the equation y = 3 x - 4. 1. Substitute 3 values in the equation 2 Solve for y. 5. Draw a line through all points. Arrows are on both ends! 3. Write the ordered pairs. 4. Plot points on a graph. x -1 0 1 2 3 3 x - 4 3(-1) - 4 3(0) - 4 3(1) - 4 3(2) - 4 3(3) - 4 y -7 -4 -1 2 5 (x, y) (-1, -7) (0, -4) (1, -1) (2, 2) (3, 5) Is (6, 0) a solution to this equation? )
Determine whether each relation is a function. Why? A. {(2, 3), (3, 0), (5, 2), (-1, -2), (4, 1)} There are no repeats in the domain. - is a function. {(3, 0), (4, -6), (-3, 10), (-8, 10)} B. X Y 3 • no repeats in the domain. 0 4 -6 • arrows leaving domain don’t repeat. -3 10 -8 • it is a function. 5 in the x pairs up with both 2 and 3 in the y. C. • one domain pairs with two different ranges. • a repeat in the domain. • A repeat in domain - not a function.
1. Graph f(x) = -5 x + 3 y+x=7 2. Define function. Identify if both graphs are functions 3. What are the synonyms for domain and range? 4. Define : Solutions set for a linear equation Linear equation 5. Determine whether (0, 3) (-3, 6) (4, 2) & (3, 0) are solutions to x + y = 3 6. The table shows the # of cookies in a jar from the time since they were baked. Graph a scatter plot using the given data.
Graph f(x) = -5 x + 3. Use a table. 1. Draw a table & Choose 3 values for x and solve for ‘y’. y= -5(1) + 3 x y – 1 8 0 3 1 -2 F(x) = -5 x + 3 y = -5(– 1) + 3 2. Plot points. y = -5 + 3 y = -2 y=5+3 y=8 y=-5(0) + 3 y=0+3 y=3 3. Draw a line through all points to show all ordered pairs that satisfy the equation. REMEMBER: Draw arrows on both “ends” of the line.
Graph y + x = 7. Use a table. 1. Draw a table & Choose 3 values for x and solve for ‘y’. y +(1) = 7 x y – 1 8 0 7 1 6 y+x=7 y +(– 1) = 7 +1 +1 -1 -1 y=6 y=8 y +(0) = 7 2. Plot points. y=7 3. Draw a line through all points to show all ordered pairs that satisfy the equation. REMEMBER: Draw arrows on both “ends” of the line.
SOLUTION SET: (the list of solutions) For Linear Equations, ORDERED PAIRS are solutions GRAPH of a Linear Equation is the drawing that represents the solution set. Linear Equation(equation whose graph forms a linear. not SUBSTITUTION & SOLVE (determine if equation is true) x + y = 3 substitute (0, 3) TRUE x + y = 3 substitute (-3, 6) TRUE x + y = 3 substitute (4, 2) FALSE x + y = 3 substitute (3, 0) TRUE *If they are true, then the coordinates are an ordered pair of the linear equation.
Graphing a Scatter Plot from Given Data The table shows the number of cookies in a jar from the time since they were baked. Graph a scatter plot using the given data. Use the table to make ordered pairs for the scatter plot. The x-value represents the time since the cookies were baked and the y-value represents the number of cookies left in the jar. Plot the ordered pairs.
Vertical Line Test: Use vertical line test to determine which of the relations are functions. y y x = | y – 2| x = 2 y – 1 x x does not pass not a function. y 2 points of intersection passes is a function. y y y 2 = x y = x 2 x x 1 point of intersection x 2 + y 2 = 1 x 2 points of intersection
Vertical Line Test Determine whether x - 4 y = 12 is a function. METHOD 1 Graph it. Try to draw a vertical line through any two points. Is it a linear equation? Yes. Is the linear equation a vertical line? No. Remember: All non-vertical linear equations are functions. This is a function. Cannot draw a vertical line through any two points. It passes the test. This relation is a function.
Graph y = x + 6. If the domain is {-4, -3, -1, 2, 4}. 1. Make table with given x-values. 2. Determine the y-values. 3. Write solutions as ordered pairs. Then plot the points. The solution set is: {(-4, 2), (-3, 3), (-1, 5), (2, 8), (4, 10)}. WHERE your warm up equations all functions?
Graph each equation. y = |x – 1| Then tell whether the equation represents a function. 1. Choose several values of x & generate ordered pairs. x y = |x – 1| (x, y) – 1 2 = |– 1 – 1| (– 1, 2) 0 1 = |0 – 1| (0, 1) 1 0 = |1 – 1| (1, 0) 2 1 = |2 – 1| (2, 1) 2. Plot enough points. 3. Points form a V-shaped graph. Draw two rays 4. Use the vertical line test on the graph. No vertical line will intersect the graph more than once. The equation y = |x – 1| represents a function.
Graph the equation. Then tell whether the equation represents a function. y = 3 x – 2 Step 1 Choose several values of x and generate ordered pairs. x 3 x – 2 = y Step 2 Plot enough points to see a pattern. (x, y) – 1 3(– 1) – 2 = – 5 (– 1, – 5) 0 3(0) – 2 = – 2 (0, – 2) 1 3(1) – 2 = 1 (1, 1) Step 3 Draw a line through all the points. Remember arrowheads on both “ends” of the line. Step 4 Use the vertical line test on the graph. No vertical line will intersect the graph more than once. The equation y = 3 x – 2 represents a function.
TRY THESE Graph each linear equation. Then tell whether it represents a function. 1. 2 y + x = 6 2. 3 y = 12 Yes, it is a function. Graph each equation. Then tell whether the equation represents a function. f(x) = 3 x – 2 – 3 x + 2 = y f(x) = |x| + 2
Graph each equation. Then tell whether the equation represents a function. f(x) = 3 x – 2 Step 1 Choose several values of Step 2 Plot enough points to see a pattern. x and generate ordered pairs. x 3 x – 2 = y (x, y) – 1 3(– 1) – 2 = – 5 (– 1, – 5) 0 3(0) – 2 = – 2 (0, – 2) 1 3(1) – 2 = 1 (1, 1) No vertical line will intersect the graph more than once. The equation y = 3 x – 2 represents a function.
Graph each equation. Then tell whether the equation represents a function. – 3 x + 2 = y Step 1 Choose several values of x and generate ordered pairs. Step 2 Plot enough points to see a pattern. x – 3 x + 2 = y (x, y) – 1 – 3(– 1) + 2 = 5 (– 1, 5) 0 – 3(0) + 2 = 2 (0, 2) 1 – 3(1) + 2 =– 1 (1, – 1) Step 3 The points appear to form a line. Draw a line through all the points to show all the ordered pairs that satisfy the function. Draw arrowheads on both “ends” of the line. Step 4 Use the vertical line test on the graph. No vertical line will intersect the graph more than once. The equation – 3 x + 2 = y represents a function.
Graph each equation. Then tell whether the equation represents a function. 1. Choose several values of x f(x) = |x| + 2 & generate ordered pairs. x |x| + 2 = y (x, y) 2. Plot 3 points min. – 1 1+2=3 (– 1, 3) 0 0+2=2 (0, 2) 1 1+2=3 (1, 3) Helpful Hint 3. Points appear to form a V -shaped graph. Draw two rays from (0, 2) to show all the ordered pairs that satisfy the function. Draw arrowheads on the end of each ray. 4. Use vertical line test on the graph. No vertical line will intersect the graph more than once. a function. When choosing values of x, be sure to choose both positive and negative values.
Use functional notation with non-linear functions also. The process is the same. Need to remember how to work with exponents or variables in denominators. Evaluate the functions: f(x) = 2 x + 3 f(x) = 3 – x f(2) = f(0) = f(-1) = f(-3) = • f(x)= - x 2 f(3) = f(-2) =
Evaluate the function for the given input values. For y = 4 x 2, find y when x = 7 & x = – 4. y = 3(x)2 y = 3(7)2 Substitute 7 for x. y = 3(49) Simplify. y= 147 ( 7 , 147) y = 3(– 4)2 Substitute – 4 for x. y = 3(16) Simplify. y = 48 ( -4 , 48 ) Find the output for each input: 1, -3 y = 3 x+ 2 y = 3 x + 2 y = 3(1) + 2 y= 3 +2 y= 5 y = 3(– 3) + 2 y= – 9 + 2 ( 1 , 5 ) y= – 7 ( -3 , -7 )
Here is a labeled diagram of a graph. Function - the equation being graphed by the purple line Ordered Pairs (4, 8) (1, 6) Vertical Axis (5, 3) (3, 2) (2, 1) Origin Horizontal Axis
Create a table and then graph each of the following and state whether it is a function. f (x) = x 2 – 2 x – 2 for f(2), f(-2), f(0), f(4) and f(4) y=5 x You pick any 3 values y =|x| You pick any 5 values. Pick some negative #s f(x) = |x+1| + 2 You pick any 5 values. Pick some negative #s
TRY THESE 2 Let f (x) = x – 3 x – 1. Find f (– 2). 2 Let f (x) = 4 x – x. Find f (x + 2). For , find h(r) when r = 600 & r = – 12. For g(t) = 1. 5 t – 5, find g(t) when t = 6 & t = – 2. For g(t) = find g(t) when t = 20 & when t = – 12. For f(x) = 6 x – 1, find f(x) when x = 3. 5 & when x = – 5. If h(z) = z 2 - 4 z + 9, find each value. h(-3) h(5 c) 5[h(c)]
Reading Math Functions can be named with any letter; f, g, and h are the most common. You read f(6) as “f of 6, ” and g(2) as “g of 2. ” To evaluate a function f (x) at x = a, substitute the specified value a for x into the given function. Let f (x) = x 2 – 3 x – 1. Find f (– 2). f (x) = x 2 – 3 x – 1 2 f (– 2) = (– 2) – 3(– 2) – 1 Substitute – 2 for x. f (– 2) = 4 + 6 – 1 Simplify. f (– 2) = 9 The value of f at – 2 is 9.
Example: Let f (x) = 4 x – x 2. Find f (x + 2). f (x) = 4 x – x 2 f (x + 2) = 4(x + 2) – (x + 2)2 Substitute x + 2 for x. f (x + 2) = 4 x + 8 – (x 2 + 4 x + 4) Expand (x + 2)2. f (x + 2) = 4 x + 8 – x 2 – 4 x – 4 f (x + 2) = 4 – x 2 Distribute – 1. is 4 – x 2. The value of f at x + 2
Equations as Relations variable used will not always be x and y. Sometimes it is obvious which variable is the domain and which is the range. Other times, how the equations are written will determine which variable stands for the domain and which variable stands for the range. On any test I give you, x will be the domain and y will be the range. Some problems in the book expect you to assume the domain is the letter closest to “A” in the alphabet. The letter furthest from “A” in the alphabet is the range. Unfortunately, this little rule does not always work. Reading Math Functions can be named with any letter; f, g, and h are the most common. You read f(6) as “f of 6, ” and g(2) as “g of 2. ”
Evaluate the function for the given input values. For , find h(r) when r = 600 & r = – 12. = 202 = – 2 For g(t) = 1. 5 t – 5, find g(t) when t = 6 & t = – 2. g(t) = 1. 5 t – 5 g(6) = 1. 5(6) – 5 g(t) = 1. 5 t – 5 g(– 2) = 1. 5(– 2) – 5 =9– 5 = – 3 – 5 =4 = – 8
Lesson Quiz: Part III Evaluate each function for the given input values. 4. For g(t) = t = – 12. g(20) = 2 g(– 12) = – 6 find g(t) when t = 20 and when 5. For f(x) = 6 x – 1, find f(x) when x = 3. 5 and when x = – 5. f(3. 5) = 20 f(– 5) = – 31
A. h(-3) If h(z) = z 2 - 4 z + 9, find each value. h(-3) = (-3)2 - 4(-3) + 9 = 9 + 12 + 9 = 30 B. h(5 c) = (5 c)2 - 4(5 c) + 9 = 25 c 2 - 20 c + 9 No like terms to combine, so that is the answer. C. 5[h(c)] First find h(c), then multiply by the whole thing by 5. h(c) = (c)2 - 4(c) + 9 = c 2 - 4 c + 9 No like terms to combine, so multiply by 5. 5[h(c)] = 5 c 2 - 20 c + 45
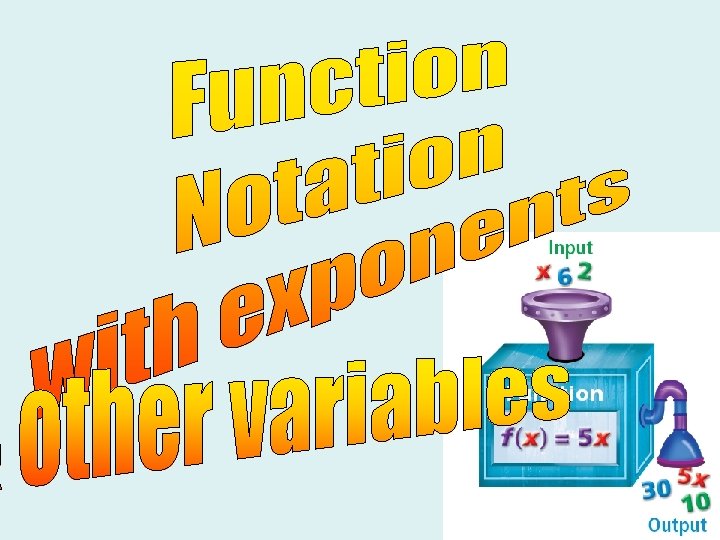
Function Notation f(x) is another way to write “y” in functional notation y is the dependent variable …it depends on x… SO y is a function of x… so, y = f(x). equation: functional notation: y = 3 x + 7 f(x) = 3 x + 7 Find the value of a function for a given domain, (same as finding out the y-value for a given x-value using the table method. ) EX : f(x) = 3 x + 7 means: find “f of 4” or f(4) = 3(4) + 7 f(4) = 12 + 7 f(4) = 19 plug in 4 where there is an x.
Graph
Let’s Graph Example 4
Let’s Graph Example 5
Let’s Graph Example 8
Let’s Graph Example 1
Let’s Graph Example 2
Let’s Graph Example 3 Timer
4 -1 Graphing Relationships Lesson Quiz: Part II 2. A pet store is selling puppies for $50 each. It has 8 puppies to sell. Sketch a graph for this situation.
4 -3 Writing and Graphing Functions Lesson Quiz: Part I 1. Graph y = |x + 3|.
4 -3 Writing and Graphing Functions Lesson Quiz: Part III Evaluate each function for the given input values. 4. For g(t) = find g(t) when t = 20 and when t = – 12. g(20) = 2 g(– 12) = – 6 5. For f(x) = 6 x – 1, find f(x) when x = 3. 5 and when x = – 5. f(3. 5) = 20 f(– 5) = – 31
4 -3 Writing and Graphing Functions Lesson Quiz: Part Il Identify the independent and dependent variables. Write a rule in function notation for each situation. 2. A buffet charges $8. 95 person. independent: number of people dependent: cost f(p) = 8. 95 p 3. A moving company charges $130 for weekly truck rental plus $1. 50 per mile. independent: miles dependent: cost f(m) = 130 + 1. 50 m
Solve the equation. 5. 2 x 6. 4 7. 8. 7 x 9. – 17 = 13 ANSWER 15 – 11 ANSWER 1 + 30 = 0 ANSWER 5 – 3 x = – 16 ANSWER – 4 = 15 x – 6 x – 3 10. 7 x MB = x + 5 x + 17 = – 25 1 ANSWER – 6 2
Without graphing, tell whether each point is on the graph of 6 x – 2 y = 8. 3. (1, 1) no 4. (3, 5) yes 5. The cost of a can of iced-tea mix at Save More Grocery is $4. 75. The function f(x) = 4. 75 x gives the cost of x cans of iced-tea mix. Graph this function and give its domain and range. D: {0, 1, 2, 3, …} R: {0, 4. 75, 9. 50, 14. 25, …}
Create a table of values for each equation, and graph it on grid paper: 1. 2. 3. 4.
Warm-Up Exercises Evaluate the expression. 1. – 23 ANSWER 23 2. 3 – 5 ANSWER 2 ANSWER – 2 3. – – 2 – ( – 4) Tell whether the number is a solution of the equation. 1. 2; 3 x – 4 = 2 ANSWER yes 2. – 5; 4 a – 6 = 14 ANSWER no
WARM UP Write four solutions for each equation. Write the solutions as ordered pairs. 1. y = 2 x – 4 2. y = x /2 – 3 3. x + y = 12 Determine whether each relation is linear. 4. x – y = 32 5. 25 – y 2 = x 2