Graph Sketching Asymptotes and Rational Functions 2 3


: The graph of a")


: The graph of a")

: Second, find the")


: Second, now we")

 Intercepts.")
: e)")
: g)")

: b) Asymptotes. Vertical:")
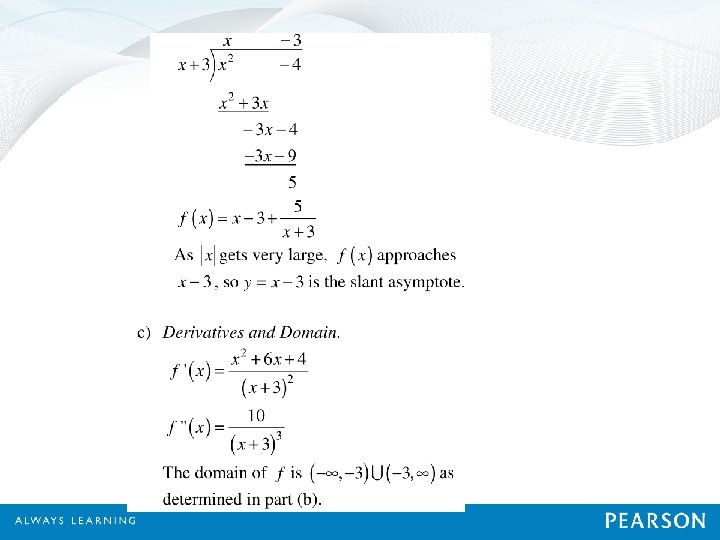
: Slant: There is")
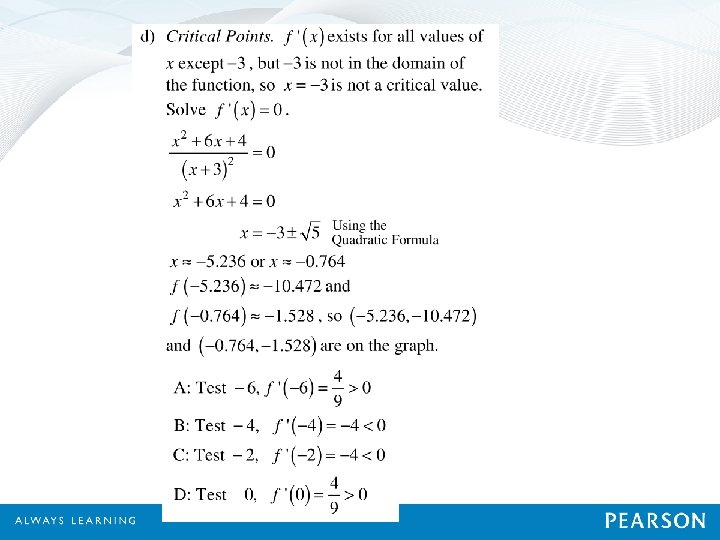
: d) Critical Values")
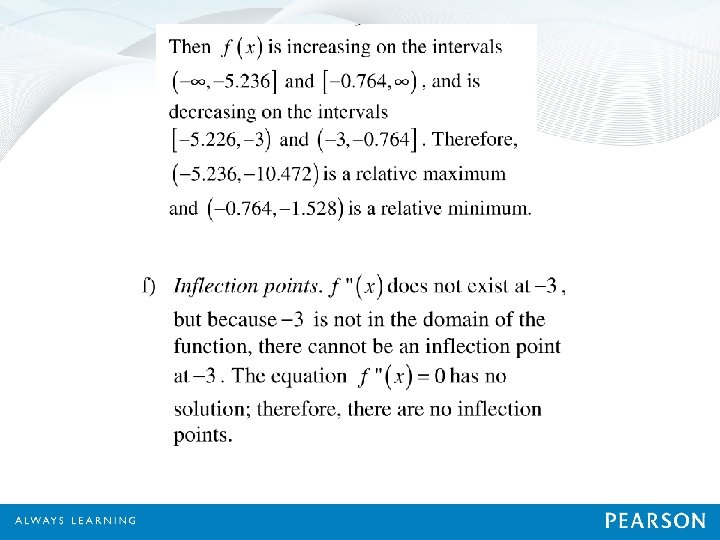
: e) Increasing and/or")
: So, f is")
: f) Inflection points.")
: g) Concavity. Since")
: Thus, f is")
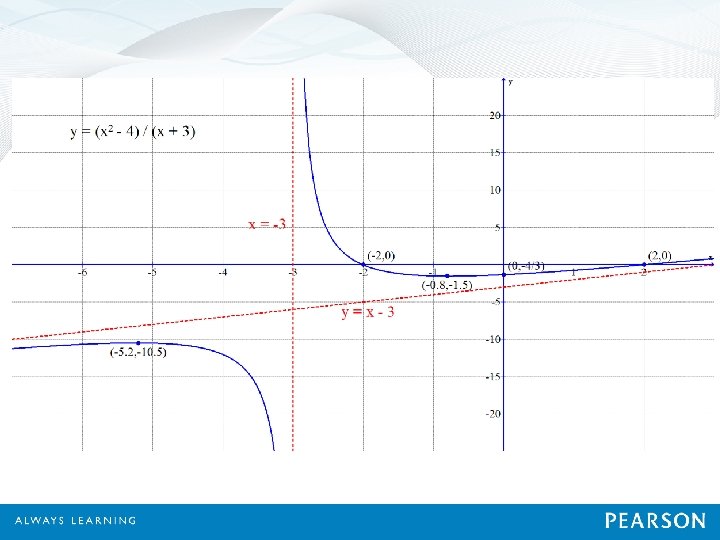
: h) Sketch the")


- Slides: 37
Graph Sketching: Asymptotes and Rational Functions 2. 3 OBJECTIVE • • • Find limits involving infinity. Determine the asymptotes of a function’s graph. Graph rational functions. Copyright © 2014 Pearson Education, Inc.
2. 3 Graph Sketching: Asymptotes and Rational Functions DEFINITION: A rational function is a function f that can be described by where P(x) and Q(x) are polynomials, with Q(x) not the zero polynomial. The domain of f consists of all inputs x for which Q(x) ≠ 0. Copyright © 2014 Pearson Education, Inc. Slide 2 - 2
2. 3 Graph Sketching: Asymptotes and Rational Functions DEFINITION: The line x = a is a vertical asymptote if any of the following limit statements are true: or or or Copyright © 2014 Pearson Education, Inc. Slide 2 - 3
2. 3 Graph Sketching: Asymptotes and Rational Functions DEFINITION (continued): The graph of a rational function never crosses a vertical asymptote. If the expression that defines the rational function f is simplified, meaning that it has no common factor other than – 1 or 1, then if a is an input that makes the denominator 0, the line x = a is a vertical asymptote. Copyright © 2014 Pearson Education, Inc. Slide 2 - 4
2. 3 Graph Sketching: Asymptotes and Rational Functions Example 1: Determine the vertical asymptotes of the function given by Since x = 1 and x = – 1 make the denominator 0, x = 1 and x = – 1 are vertical asymptotes. Copyright © 2014 Pearson Education, Inc. Slide 2 - 5
2. 3 Graph Sketching: Asymptotes and Rational Functions Quick Check 1 Determine the vertical asymptotes: After factoring out the denominator, we see that , , and make the denominator 0. Thus there are vertical asymptotes at , , and Copyright © 2014 Pearson Education, Inc. Slide 2 - 6
2. 3 Graph Sketching: Asymptotes and Rational Functions DEFINITION: The line y = b is a horizontal asymptote if either or both of the following limit statements are true: or Copyright © 2014 Pearson Education, Inc. Slide 2 - 7
2. 3 Graph Sketching: Asymptotes and Rational Functions DEFINITION (continued): The graph of a rational function may or may not cross a horizontal asymptote. Horizontal asymptotes occur when the degree of the numerator is less than or equal to the degree of the denominator. (The degree of a polynomial in one variable is the highest power of that variable. ) Copyright © 2014 Pearson Education, Inc. Slide 2 - 8
2. 3 Graph Sketching: Asymptotes and Rational Functions Example 2: Determine the horizontal asymptote of the function given by First, divide the numerator and denominator by x 2. Copyright © 2014 Pearson Education, Inc. Slide 2 - 9
2. 3 Graph Sketching: Asymptotes and Rational Functions Example 2 (continued): Second, find the limit as |x| gets larger and larger. and Thus, the line y = is a horizontal asymptote. Copyright © 2014 Pearson Education, Inc. Slide 2 - 10
2. 3 Graph Sketching: Asymptotes and Rational Functions Quick Check 2 Determine the horizontal asymptote of the function given by First we should multiply both the numerator and denominator out: Copyright © 2014 Pearson Education, Inc. Slide 2 - 11
2. 3 Graph Sketching: Asymptotes and Rational Functions Quick Check 2 Concluded Since both the numerator and denominator have the same power of x, we can divide both by that power: Now we can see that as gets very large, the numerator approaches 2 and the denominator approaches 15. Therefore the value of the function gets very close to. Thus, and Therefore there is a horizontal asymptote at Copyright © 2014 Pearson Education, Inc. Slide 2 - 12
2. 3 Graph Sketching: Asymptotes and Rational Functions DEFINITION: A linear asymptote that is neither vertical nor horizontal is called a slant, or oblique, asymptote. For any rational function of the form f (x) = p(x)/q(x), a slant asymptote occurs when the degree of p(x) is exactly 1 more than the degree of q(x). A graph can cross a slant asymptote. Copyright © 2014 Pearson Education, Inc. Slide 2 - 13
2. 3 Graph Sketching: Asymptotes and Rational Functions Quick Check 3 Find the slant asymptote: Use polynomial division to solve for this: Since we have a remainder of , we can see that as gets very large, the remainder approaches 0. Thus the dominant part of is. Therefore, there is slant asymptote at Copyright © 2014 Pearson Education, Inc. Slide 2 - 14
Copyright © 2014 Pearson Education, Inc. Slide 2 - 15
2. 3 Graph Sketching: Asymptotes and Rational Functions Example 3: Find the slant asymptote: First, divide the numerator by the denominator. Copyright © 2014 Pearson Education, Inc. Slide 2 - 16
2. 3 Graph Sketching: Asymptotes and Rational Functions Example 3 (concluded): Second, now we can see that as |x| gets very large, – 3/(x – 1) approaches 0. Thus, for very large |x|, the expression x + 1 is the dominant part of thus y = x + 1 is the slant asymptote. Copyright © 2014 Pearson Education, Inc. Slide 2 - 17
Copyright © 2014 Pearson Education, Inc. Slide 2 - 18
2. 3 Graph Sketching: Asymptotes and Rational Functions Strategy for Sketching Graphs: a) Intercepts. Find the x-intercept(s) and the y -intercept of the graph. b) Asymptotes. Find any vertical, horizontal, or slant asymptotes. c) Derivatives and Domain. Find f (x) and f (x). Find the domain of f. d) Critical Values of f. Find any inputs for which f (x) is not defined or for which f (x) = 0. Copyright © 2014 Pearson Education, Inc. Slide 2 - 19
2. 3 Graph Sketching: Asymptotes and Rational Functions Strategy for Sketching Graphs (continued): e) Increasing and/or decreasing; relative extrema. Substitute each critical value, x 0, from step (d) into f (x), and apply the Second Derivative Test. If no critical value exists, use f and test values to find where f is increasing or decreasing. f) Inflection Points. Determine candidates for inflection points by finding x-values for which f (x) does not exist or for which f (x) = 0. Find the function values at these points. Copyright © 2014 Pearson Education, Inc. Slide 2 - 20
2. 3 Graph Sketching: Asymptotes and Rational Functions Strategy for Sketching Graphs (concluded): g) Concavity. Use the values c from step (f) as endpoints of intervals. Determine the concavity by checking to see where f is increasing – that is, f (x) > 0 – and where f is decreasing – that is, f (x) < 0. Do this by selecting test points and substituting into f (x). Use the results of step (d). h) Sketch the graph. Use the information from steps (a) – (g) to sketch the graph, plotting extra points as needed. Copyright © 2014 Pearson Education, Inc. Slide 2 - 21
2. 3 Graph Sketching: Asymptotes and Rational Functions Example 4: Sketch the graph of a) Intercepts. The x-intercepts occur at values for which the numerator equals 0. Since 8 ≠ 0, there are no x-intercepts. To find the y-intercept, we find f(0). Thus, we have the point (0, – 2). Copyright © 2014 Pearson Education, Inc. Slide 2 - 22
2. 3 Graph Sketching: Asymptotes and Rational Functions Example 4 (continued): b) Asymptotes. Vertical: So, x = 2 and x = – 2 are vertical asymptotes. Horizontal: The degree of the numerator is less than the degree of the denominator. So, the x-axis, y = 0 is the horizontal asymptote. Copyright © 2014 Pearson Education, Inc. Slide 2 - 23
2. 3 Graph Sketching: Asymptotes and Rational Functions Example 4 (continued): Slant: There is no slant asymptote since the degree of the numerator is not 1 more than the degree of the denominator. c) Derivatives and Domain. Using the Quotient Rule, we get and The domain of f is all real numbers, x ≠ 2 and x ≠ – 2. Copyright © 2014 Pearson Education, Inc. Slide 2 - 24
2. 3 Graph Sketching: Asymptotes and Rational Functions Example 4 (continued): d) Critical Values of f. f (x) equals 0 where the numerator equals 0 and does not exist where the denominator equals 0. However, since f does not exist at x = 2 or x = – 2, x = 0 is the only critical value. Copyright © 2014 Pearson Education, Inc. Slide 2 - 25
2. 3 Graph Sketching: Asymptotes and Rational Functions Example 4 (continued): e) Increasing and/or decreasing; relative extrema. Thus, x = 0 is a relative maximum and f is increasing on (– 2, 0] and decreasing on [0, 2). Since f does not exist at x = 2 and x = – 2, we use f and test values to see if f is increasing or decreasing on (–∞, – 2) and (2, ∞). Copyright © 2014 Pearson Education, Inc. Slide 2 - 26
2. 3 Graph Sketching: Asymptotes and Rational Functions Example 4 (continued): So, f is increasing on (–∞, – 2). So, f is decreasing on (2, ∞). Copyright © 2014 Pearson Education, Inc. Slide 2 - 27
2. 3 Graph Sketching: Asymptotes and Rational Functions Example 4 (continued): f) Inflection points. f does not exist x = 2 and x = – 2. However, neither does f. Thus we consider where f equals 0. Note that for all real numbers x, so there are no points of inflection. Copyright © 2014 Pearson Education, Inc. Slide 2 - 28
2. 3 Graph Sketching: Asymptotes and Rational Functions Example 4 (continued): g) Concavity. Since there are no points of inflection, the only places where f could change concavity would be on either side of the vertical asymptotes. Note that we already know from step (e) that f is concave down at x = 0. So we need only test a point in (–∞, – 2) and a point in (2, ∞). Copyright © 2014 Pearson Education, Inc. Slide 2 - 29
2. 3 Graph Sketching: Asymptotes and Rational Functions Example 4 (continued): Thus, f is concave up on (–∞, – 2). Thus, f is concave up on (2, ∞). Copyright © 2014 Pearson Education, Inc. Slide 2 - 30
2. 3 Graph Sketching: Asymptotes and Rational Functions Example 4 (continued): h) Sketch the graph. Using the information in steps (a) – (g), the graph follows. Copyright © 2014 Pearson Education, Inc. Slide 2 - 31
2. 3 Graph Sketching: Asymptotes and Rational Functions Section Summary • A line is a vertical asymptote if • A line is a horizontal asymptote if or or • A graph may cross a horizontal asymptote but never a vertical asymptote. • A slant asymptote occurs when the degree of the numerator is 1 greater than the degree of the denominator. Long division of polynomials can be used to determine the equation of the slant asymptote. • Vertical, horizontal, and slant asymptotes can be used as guides for accurate curve sketching. Asymptotes are not a part of a graph but are visual guides only. Copyright © 2014 Pearson Education, Inc. Slide 2 - 32
2. 3