Graph Basics Y vertical axis X horizontal axis


Graph Basics
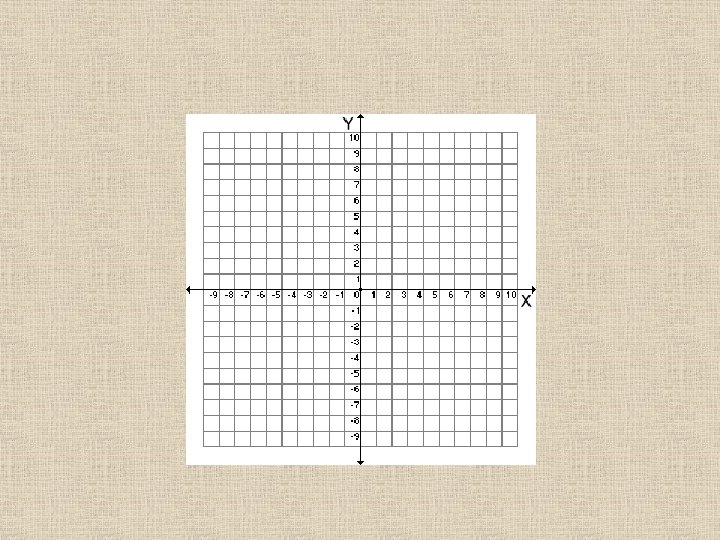

Y vertical axis X horizontal axis

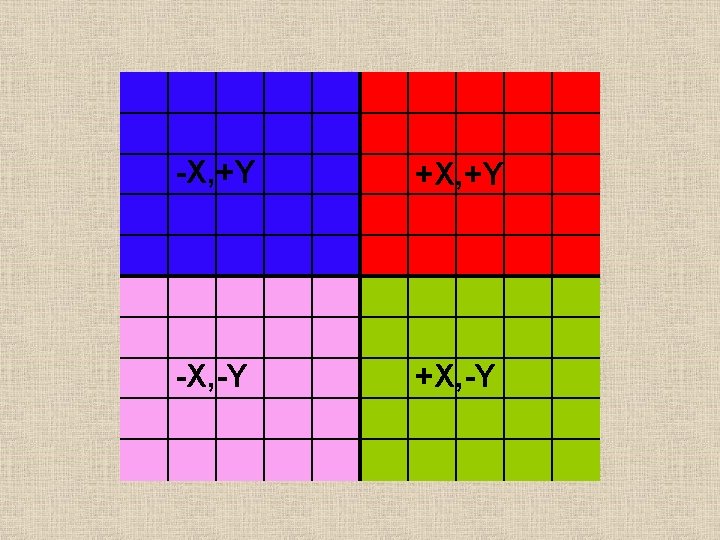
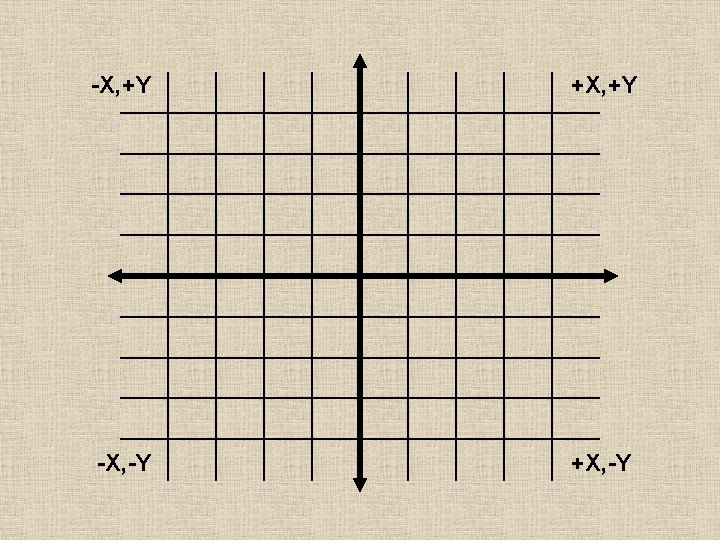
-X, +Y +X, +Y -4 -X, -Y -3 -2 -1 0 1 2 3 4 +X, -Y

-X, +Y +X, +Y 4 3 2 1 0 -1 -2 -3 -X, -Y -4 +X, -Y

-X, +Y +X, +Y 4 3 2 0, 0 1 -4 -3 -2 -1 -1 1 2 3 4 -2 -3 -X, -Y -4 +X, -Y

-X, +Y +X, +Y 4 3 2 1 -4 -3 -2 -1 -1 -2 -3 -X, -Y -4 +X 1 2 3 4 +X +X, -Y

-X, +Y +X, +Y -X -4 -3 -2 -1 -X -X, -Y 4 3 2 1 -1 1 2 3 4 -2 -3 -4 +X, -Y

-X, +Y +Y -4 -3 -2 -1 4 3 2 1 -1 +Y 1 2 3 4 -2 -3 -X, -Y -4 +X, -Y

-X, +Y +X, +Y 4 3 2 1 -4 -3 -2 -1 -Y -X, -Y -1 -2 -3 -4 1 2 3 4 -Y +X, -Y

Quadrant III Quadrant IV

O = -3, 2 N N = 3, 4 O M P M = -3, -4 P = 2, -4
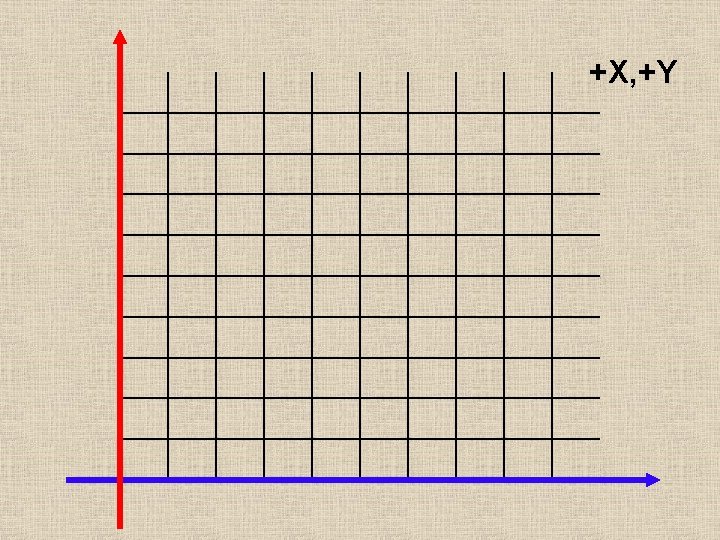

+X, +Y p r i c e quantity

1. Draw a blank graph with a vertical axis and a horizontal axis.

2. Label the vertical axis "price. "

3. Label the horizontal axis "quantities. "

4. On the vertical axis, mark points at prices $1 through $10, beginning at the bottom.

5. On the horizontal axis, mark points at quantities 10 through 100, beginning on the left.

6. This is the demand schedule. Plot the quantities demanded at each price. Price Qnty. Demanded 1 0 2 5 3 15 4 21 5 40 6 48 7 62 8 72 9 86 10 100

6. This is the demand schedule. Plot the quantities demanded at each price.

7. This is the supply schedule. Plot the quantities supplied at each price. Price Qnty. Supplied 1 0 2 5 3 15 4 21 5 40 6 48 7 62 8 72 9 86 10 100

7. This is the supply schedule. Plot the quantities supplied at each price.

8. Draw a line connecting the price/quantity marks on the demand curve.

9. Draw a line connecting the price/quantity marks on the supply curve.

- Slides: 29