Graduated Cylinders Measuring Lines and Graphs 44 ml


- Slides: 13
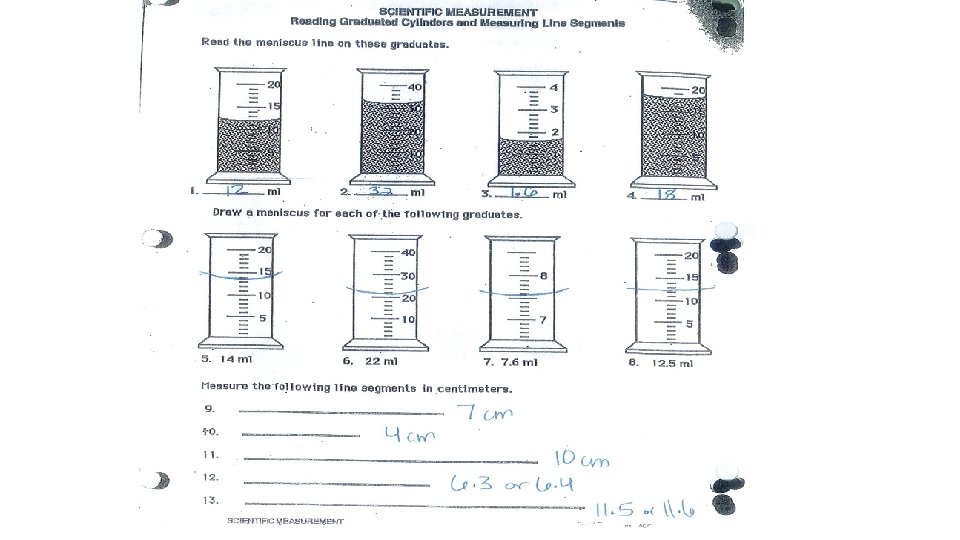
Graduated Cylinders, Measuring Lines, and Graphs
44 ml 24 ml 16 ml 10 ml 36 ml 18 ml 42 ml 22 ml 32 ml 26 ml
Water Displacement. Volume is a measure of the amount of space an object takes up. When a cylinder is submerged in thewater it pushes water out of the way. If you measure the amount the water level increases, you can find the volume of the water pushed out of the way
100 90 Temp in o. C 80 70 60 50 40 30 20 10 0 5 10 15 20 25 30 Time In mins 35 40 45 50 55 60 Time (mins) Temp in o. C 0 10 5 20 10 30 15 40 20 50 25 60 30 65 35 70 40 70 45 70 50 75 55 80 60 90
100 90 Temp in o. C 80 70 60 50 40 30 20 10 0 5 10 Time In mins 15 20 Time mins Temp Time Temp in o. C mins in o. C 0 10 71 1 95 11 70 2 90 12 68 3 85 13 65 4 80 14 60 5 75 15 55 6 72 16 50 7 71 17 45 8 71 18 40 9 71 19 35 20 30
Interpreting Ecological Data
Graph 1: Rabbits Over Time a. The graph shows a _______S Shaped___ growth curve. b. The carrying capacity for rabbits is ___~65___ c. During which month were the rabbits in exponential growth? June Time
Graph 2: Average Toe Length a. In 1800, about how many people surveyed had a 3 cm toe? ____~58___ How many in 2000? __~10 b. The data shows the ______Stabilizing___ selection has occurred? c. In 2000, what is the average toe length? ___~4. 5___ What is the average toe length in 1800? about the same, broader range
Graph 3: Mexico and US a. In Mexico, what percentage of the population is between 0 -4 years of age? ___16____ In the US? ____7__ b. Which population is growing the fastest? Mexico_ c. Which age group has the smallest number in both countries? ___80+__ Graph 3: Mexico and US
Chart 4: Trapping Geese In order to estimate the population of geese in Northern Wisconsin, ecologists marked 10 geese and then released them back into the population. Over a 6 year period, geese were trapped and their numbers recorded. Year Geese Trapped Number with Mark 1980 10 1 1981 15 1 1982 12 1 1983 8 0 1984 5 2 1985 10 1 a. Use the formula to calculate the estimated number of geese in the area studied? 60(10) / 6 = 100 b. This technique is called Mark & Recapture c. Supposing more of the geese found in the trap had the mark, would the estimated number of geese in the area be greater or lesser? less (bottom number would be greater in formula)
Chart 5: Mushroom Plots Another ecologist uses a different method to estimate the number of mushrooms in a forest. She plots a 10 x 10 area and randomly chooses 5 spots, where she counts the number of mushrooms in the plots and records them on the grid. a. Calculate the number of mushrooms in the forest based on the grid data: Average per grid = 3, 100 plots; total = 300 b. This technique is called ____Random Sampling__
Chart 6: Snakes & Mice The data shows populations of snake and mice found in an experimental field. a. During which year was the mouse population at zero population growth? __2000, closest to zero__ To determine this: (disregard b thru d) population growth = mice born – mice dead