Grading of Recommendations Assessment Development and Evaluation GRADE
 嘉義長庚醫院 感染醫學科 林皇伸 醫師")


 of")


![Large magnitude of effect • Direct evidence, relative risk [RR]=2– 5 or RR=0. 5–](https://slidetodoc.com/presentation_image_h/36a94099f099afe3367c90ab11f9ae2e/image-47.jpg "Large magnitude of effect • Direct evidence, relative risk [RR]=2– 5 or RR=0. 5–")


 Recommendations Strong Recommendation Weak (Conditional) Recommendation Patients Most")
 Recommendations Strong Recommendation Most individuals should receive the")

- Slides: 54
評估、發展與評值建議等級 (Grading of Recommendations Assessment, Development and Evaluation, GRADE) 嘉義長庚醫院 感染醫學科 林皇伸 醫師
Evolution— 1970
Evolution— 1980 -RCT
Evolution— 1990—SR/Meta
Evolution— 1990—SR/Meta
From: Infectious Diseases Society of America Guidelines for the Diagnosis and Treatment of Asymptomatic Bacteriuria in Adults Clin Infect Dis. 2005; 40(5): 643 -654. doi: 10. 1086/427507 Clin Infect Dis | © 2005 by the Infectious Diseases Society of America
Evolution
Evolution— 2000—GRADE
Evolution— 2004—GRADE
Evolution— 2008—GRADE
Evolution— 2011—GRADE
Evolution— 2016—GRADE
GRADE Centers • GRADE centers – – – – Mc. Master GRADE center, Canada 2010 Lanzhou GRADE center, China 2011 Barcelona GRADE center, Spain 2012 Freiburg GRADE center, Germany 2013 American University of Beirut GRADE center, Lebanon 2015 Rome GRADE center, Italy 2015 Joanna Briggs Institute, Australia 2016 Javeriana University GRADE center, Colombia 2016 • GRADE networks – UK GRADE Network 2013 – US GRADE Network 2014 – Dutch GRADE network 2015
Advantages of GRADE over other systems • Developed by a widely representative group of international guideline developers • Clear separation between quality of evidence and strength of recommendations • Explicit evaluation of the importance of outcomes of alternative management strategies • Explicit, comprehensive criteria for downgrading and upgrading quality of evidence ratings • Transparent process of moving from evidence to recommendations • Explicit acknowledgment of values and preferences • Clear, pragmatic interpretation of strong versus weak recommendations for clinicians, patients, and policy makers • Useful for systematic reviews and health technology assessments, as well as guidelines --Guyatt GH et a. BMJ 2008; 336: 924
Quality of evidence and definitions • High quality— Further research is very unlikely to change our confidence in the estimate of effect • Moderate quality— Further research is likely to have an important impact on our confidence in the estimate of effect and may change the estimate • Low quality— Further research is very likely to have an important impact on our confidence in the estimate of effect and is likely to change the estimate • Very low quality— Any estimate of effect is very uncertain --Guyatt GH et a. BMJ 2008; 336: 924
GRADE • A guideline’s formulation should include a clear question with specification of all outcomes of importance to patients • GRADE offers four levels of evidence quality: high, moderate, low, and very low • Randomised trials begin as high quality evidence and observational studies as low quality evidence • Quality may be downgraded as a result of limitations in study design or implementation, imprecision of estimates (wide confidence intervals), variability in results, indirectness of evidence, or publication bias • Quality may be upgraded because of a very large magnitude of effect, a dose-response gradient, and if all plausible biases would reduce an apparent treatment effect • Critical outcomes determine the overall quality of evidence • Evidence profiles provide simple, transparent summaries
Fig 1 Hierarchy of outcomes according to importance to patients to assess effect of phosphate lowering drugs in patients with renal failure and hyperphosphataemia. Gordon H Guyatt et al. BMJ 2008; 336: 995 -998 © 2008 by British Medical Journal Publishing Group
Fig. 3 Journal of Clinical Epidemiology 2011 64, 383 -394 DOI: (10. 1016/j. jclinepi. 2010. 04. 026) Copyright © 2011 Elsevier Inc. Terms and Conditions
From: 2017 Infectious Diseases Society of America’s Clinical Practice Guidelines for Healthcare-Associated Ventriculitis and Meningitis* Clin Infect Dis. 2017; 64(6): e 34 -e 65. doi: 10. 1093/cid/ciw 861 Clin Infect Dis | © The Author 2017. Published by Oxford University Press for the Infectious Diseases Society of America. All rights reserved. For permissions, e-mail: journals. permissions@oup. com
Factors on deciding on quality of evidence • Factors that might decrease quality of evidence – Study limitations – Inconsistency of results – Indirectness of evidence – Imprecision – Publication bias • Factors that might increase quality of evidence – Large magnitude of effect – Plausible confounding, which would reduce a demonstrated effect – Dose-response gradient
Factors on deciding on quality of evidence • Factors that might decrease quality of evidence – Study limitations – Inconsistency of results – Indirectness of evidence – Imprecision – Publication bias • Factors that might increase quality of evidence – Large magnitude of effect – Plausible confounding, which would reduce a demonstrated effect – Dose-response gradient
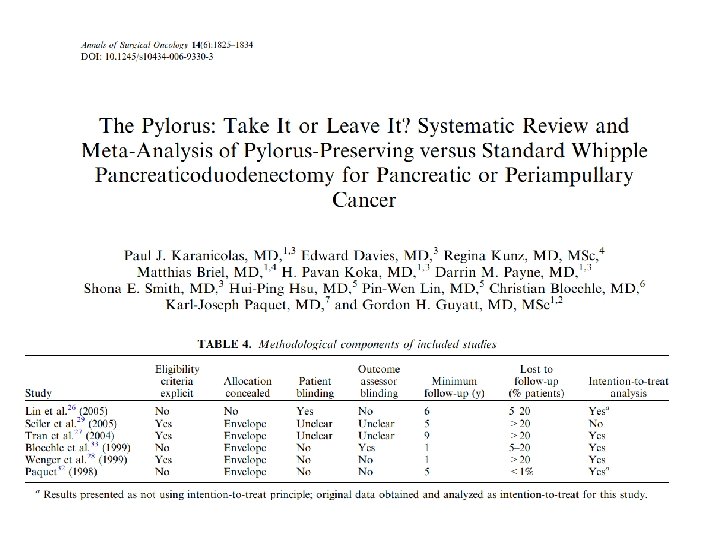
Study limitations • Study limitations in randomized trials – – – Lack of allocation concealment Lack of blinding Incomplete accounting of patients and outcome events Selective outcome reporting bias Other limitations • Study limitations in observational studie – Failure to develop and apply appropriate eligibility criteria (inclusion of control population) – Flawed measurement of both exposure and outcome – Failure to adequately control confounding – Incomplete follow-up
*Unclear allocation concealment in one study, patients blinded in only one study, outcome assessors not blinded in most studies, >20% loss to follow-up in three studies, not analysed using intention to treat in one study.
Factors on deciding on quality of evidence • Factors that might decrease quality of evidence – Study limitations – Inconsistency of results – Indirectness of evidence – Imprecision – Publication bias • Factors that might increase quality of evidence – Large magnitude of effect – Plausible confounding, which would reduce a demonstrated effect – Dose-response gradient
Four criteria for assessing inconsistency in results • Point estimates vary widely across studies; • Confidence intervals (CIs) show minimal or no overlap; • The statistical test for heterogeneity—which tests the null hypothesis that all studies in a metaanalysis have the same underlying magnitude of effect—shows a low P-value; • The I 2—which quantifies the proportion of the variation in point estimates due to among-study differences—is large.
Fig. 1 Journal of Clinical Epidemiology 2011 64, 1294 -1302 DOI: (10. 1016/j. jclinepi. 2011. 03. 017) Copyright © 2011 Elsevier Inc. Terms and Conditions
Fig. 2 Journal of Clinical Epidemiology 2011 64, 1294 -1302 DOI: (10. 1016/j. jclinepi. 2011. 03. 017) Copyright © 2011 Elsevier Inc. Terms and Conditions
Fig. 3 Journal of Clinical Epidemiology 2011 64, 1294 -1302 DOI: (10. 1016/j. jclinepi. 2011. 03. 017) Copyright © 2011 Elsevier Inc. Terms and Conditions
Fig 3 Effect on delayed gastric emptying of pylorus preserving pancreaticoduodenectomy compared with standard Whipple procedure for pancreatic adenocarcinoma. Gordon H Guyatt et al. BMJ 2008; 336: 995 -998 © 2008 by British Medical Journal Publishing Group
Factors on deciding on quality of evidence • Factors that might decrease quality of evidence – Study limitations – Inconsistency of results – Indirectness of evidence – Imprecision – Publication bias • Factors that might increase quality of evidence – Large magnitude of effect – Plausible confounding, which would reduce a demonstrated effect – Dose-response gradient
Evidence is lower quality if comparisons are indirect Question of interest Source of indirectness Oseltamivir for prophylaxis of avian flu caused by influenza A virus Differences in population: Randomized trials of oseltamivir are available for seasonal influenza, but not for avian flu Colonoscopic screening for prevention of colon cancer mortality Differences in intervention: Randomized trials of fecal occult blood screening provide indirect evidence bearing on the potential effectiveness of colonoscopy Sevelamer- vs. calcium-based phosphate binders in chronic renal failure Differences in outcome: Reducing the calcium-phosphate load is hypothesized to reduce vascular calcification, which is hypothesized to reduce vascular events Choice of antidepressant Indirect comparison: Some antidepressants have been compared directly with others, but many have not
Factors on deciding on quality of evidence • Factors that might decrease quality of evidence – Study limitations – Inconsistency of results – Indirectness of evidence – Imprecision – Publication bias • Factors that might increase quality of evidence – Large magnitude of effect – Plausible confounding, which would reduce a demonstrated effect – Dose-response gradient
Fig. 3 Journal of Clinical Epidemiology 2011 64, 1283 -1293 DOI: (10. 1016/j. jclinepi. 2011. 012) Copyright © 2011 Elsevier Inc. Terms and Conditions
Fig 2 Downgrading for imprecision: thresholds are key (threshold number needed to treat (NNT) of 200 does not require downgrading whereas the same result with a threshold of 100 requires downgrading). Gordon H Guyatt et al. BMJ 2008; 336: 995 -998 © 2008 by British Medical Journal Publishing Group
Factors on deciding on quality of evidence • Factors that might decrease quality of evidence – Study limitations – Inconsistency of results – Indirectness of evidence – Imprecision – Publication bias • Factors that might increase quality of evidence – Large magnitude of effect – Plausible confounding, which would reduce a demonstrated effect – Dose-response gradient
Publication bias Phases of research publication Actions contributing to or resulting in bias Preliminary and pilot studies Small studies more likely to be “negative” (e. g. , those with discarded or failed hypotheses) remain unpublished; companies classify some as proprietary information Report completion Authors decide that reporting a “negative” study is uninteresting; and do not invest the time and effort required for submission Journal selection Authors decide to submit the “negative” report to a nonindexed, non-English, or limitedcirculation journal Editorial consideration Editor decides that the “negative” study does not warrant peer review and rejects manuscript
Publication bias Phases of research publication Actions contributing to or resulting in bias Peer reviewers conclude that the “negative” study does not contribute to the field and recommend rejecting the manuscript. Author gives up or moves to lower impact journal. Publication delayed Author revision and resubmission Author of rejected manuscript decides to forgo the submission of the “negative” study or to submit it again at a later time to another journal (see “journal selection, ” above). Report publication Journal delays the publication of the “negative” study
Fig. 1 Journal of Clinical Epidemiology 2011 64, 1277 -1282 DOI: (10. 1016/j. jclinepi. 2011. 011) Copyright © 2011 Elsevier Inc. Terms and Conditions
Factors on deciding on quality of evidence • Factors that might decrease quality of evidence – Study limitations – Inconsistency of results – Indirectness of evidence – Imprecision – Publication bias • Factors that might increase quality of evidence – Large magnitude of effect – Plausible confounding, which would reduce a demonstrated effect – Dose-response gradient
Large magnitude of effect • Direct evidence, relative risk [RR]=2– 5 or RR=0. 5– 0. 2 with no plausible confounders • Very large with RR>5 or RR<0. 2 and no serious problems with risk of bias or precision (sufficiently narrow confidence intervals) • More likely to rate up if effect rapid and out of keeping with prior trajectory; usually supported by indirect evidence.
Fig. 1 Journal of Clinical Epidemiology 2011 64, 1311 -1316 DOI: (10. 1016/j. jclinepi. 2011. 06. 004) Copyright © 2011 Elsevier Inc. Terms and Conditions
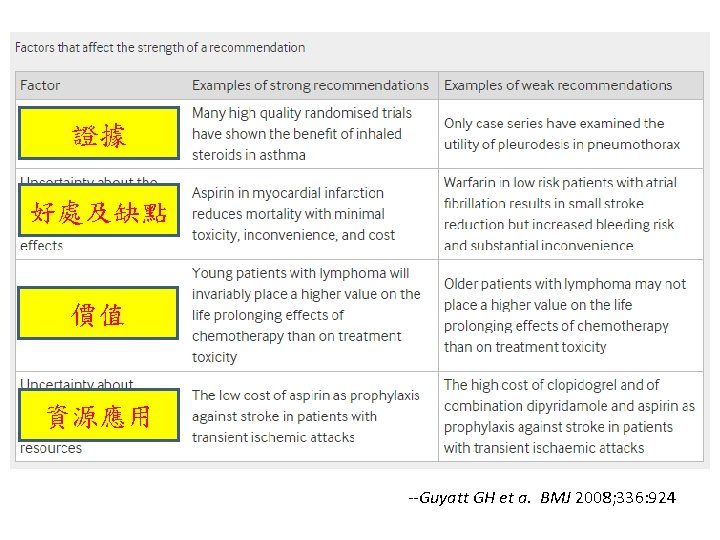
Determinants of strength of recommendation Factor Comment Balance between desirable and undesirable effects The larger the difference between the desirable and undesirable effects, the higher the likelihood that a strong recommendation is warranted. The narrower the gradient, the higher the likelihood that a weak recommendation is warranted Quality of evidence The higher the quality of evidence, the higher the likelihood that a strong recommendation is warranted Values and preferences The more values and preferences vary, or the greater the uncertainty in values and preferences, the higher the likelihood that a weak recommendation is warranted Costs (resource allocation) The higher the costs of an intervention—that is, the greater the resources consumed—the lower the likelihood that a strong recommendation is warranted
Fig 1 Varying thresholds of major gastrointestinal bleeding found acceptable by patients and physicians for prevention of eight strokes in 100 patients. Gordon H Guyatt et al. BMJ 2008; 336: 1049 -1051 © 2008 by British Medical Journal Publishing Group
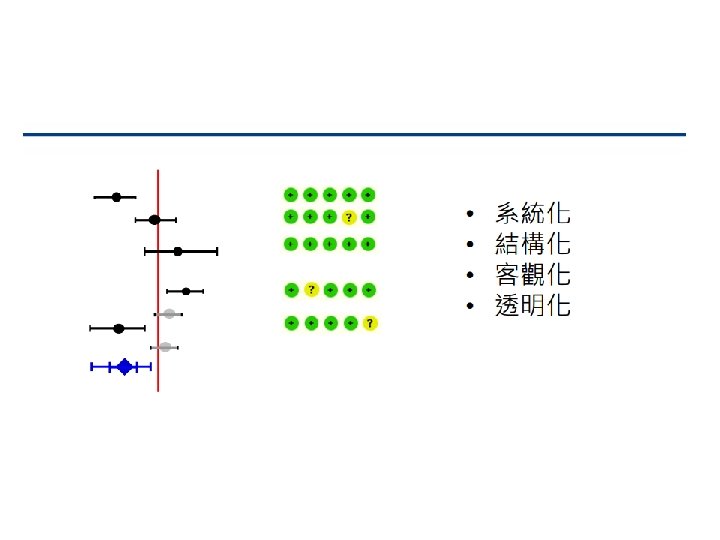
Fig 2 Representations of quality of evidence and strength of recommendations. Gordon H Guyatt et al. BMJ 2008; 336: 1049 -1051 © 2008 by British Medical Journal Publishing Group
Interpretation of Strong and Weak (Conditional) Recommendations Strong Recommendation Weak (Conditional) Recommendation Patients Most individuals in this situation would want the recommended course of action, and only a small proportion would not. The majority of individuals in this situation would want the suggested course of action, but many would not. Policy makers Policymaking will require The recommendation can be substantial debate and adopted as policy in most involvement of various situations. stakeholders.
Interpretation of Strong and Weak (Conditional) Recommendations Strong Recommendation Most individuals should receive the intervention. Adherence to this recommendation according to the guideline could be used as Clinicians a quality criterion or performance indicator. Formal decision aids are not likely to be needed to help individuals make decisions consistent with their values and preferences. Weak (Conditional) Recommendation Recognize that different choices will be appropriate for individual patients and that you must help each patient arrive at a management decision consistent with his or her values and preferences. Decision aids may be useful in helping individuals to make decisions consistent with their values and preferences.