
Grade B Quartiles and interquartile range Interpret and

Grade B Quartiles and interquartile range Interpret and calculate quartiles and interquartile range If you have any questions regarding these resources or come across any errors, please contact helpful-report@pixl. org. uk
Key Vocabulary Lower quartile Upper quartile Interquartile range
What are quartiles? If we put all our data in order, the lower quartile would be the 25 th percent value, the upper quartile would be the 75 th percent value. The interquartile range shows the difference between the highest and lowest values of the middle 50% of values.
Finding the quartiles We can use a cumulative frequency graph to find quartiles (using grouped data), but this is treated in the Cumulative Frequency Therapy. This Therapy looks at the case where you have a set of individual data values. To find the quartile values we • Put the data in order • Split the data into two equal halves • Find the middle value of each half. These values are the quartiles. • Interquartile range = Upper quartile – Lower quartile
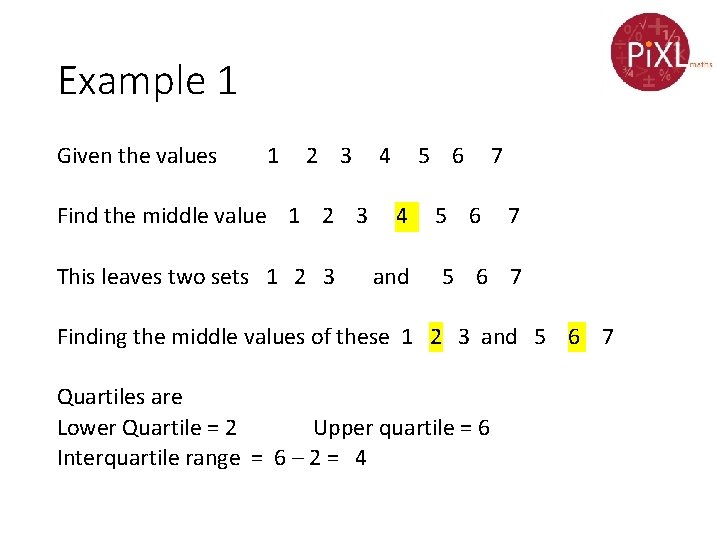
Example 1 Given the values 1 2 3 Find the middle value 1 2 3 This leaves two sets 1 2 3 4 5 6 4 and 5 6 7 7 5 6 7 Finding the middle values of these 1 2 3 and 5 6 7 Quartiles are Lower Quartile = 2 Upper quartile = 6 Interquartile range = 6 – 2 = 4
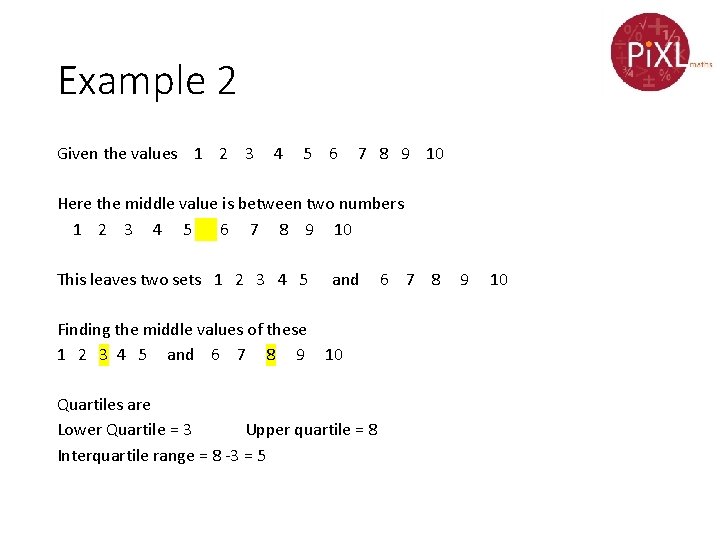
Example 2 Given the values 1 2 3 4 5 6 7 8 9 10 Here the middle value is between two numbers 1 2 3 4 5 6 7 8 9 10 This leaves two sets 1 2 3 4 5 Finding the middle values of these 1 2 3 4 5 and 6 7 8 9 and 10 Quartiles are Lower Quartile = 3 Upper quartile = 8 Interquartile range = 8 -3 = 5 6 7 8 9 10
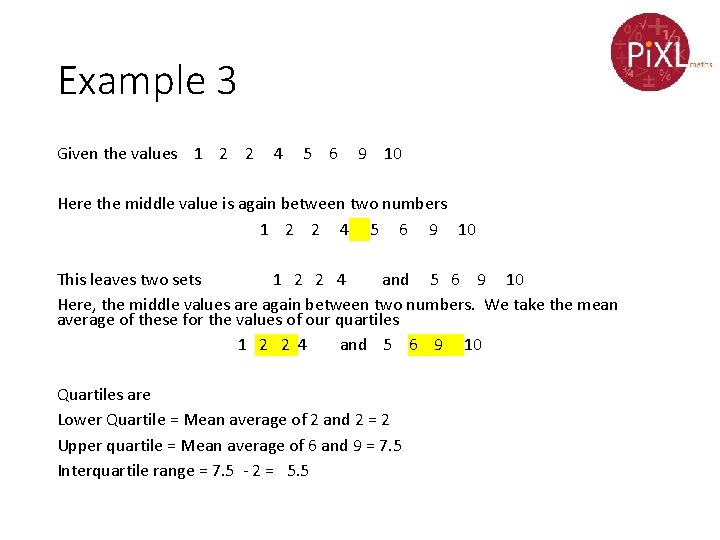
Example 3 Given the values 1 2 2 4 5 6 9 10 Here the middle value is again between two numbers 1 2 2 4 5 6 9 10 This leaves two sets 1 2 2 4 and 5 6 9 10 Here, the middle values are again between two numbers. We take the mean average of these for the values of our quartiles 1 2 2 4 and 5 6 9 10 Quartiles are Lower Quartile = Mean average of 2 and 2 = 2 Upper quartile = Mean average of 6 and 9 = 7. 5 Interquartile range = 7. 5 - 2 = 5. 5
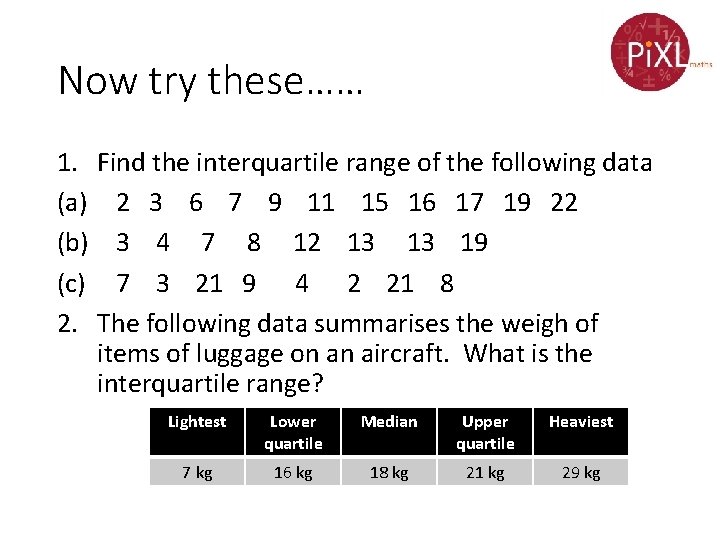
Now try these…… 1. Find the interquartile range of the following data (a) 2 3 6 7 9 11 15 16 17 19 22 (b) 3 4 7 8 12 13 13 19 (c) 7 3 21 9 4 2 21 8 2. The following data summarises the weigh of items of luggage on an aircraft. What is the interquartile range? Lightest Lower quartile Median Upper quartile Heaviest 7 kg 16 kg 18 kg 21 kg 29 kg
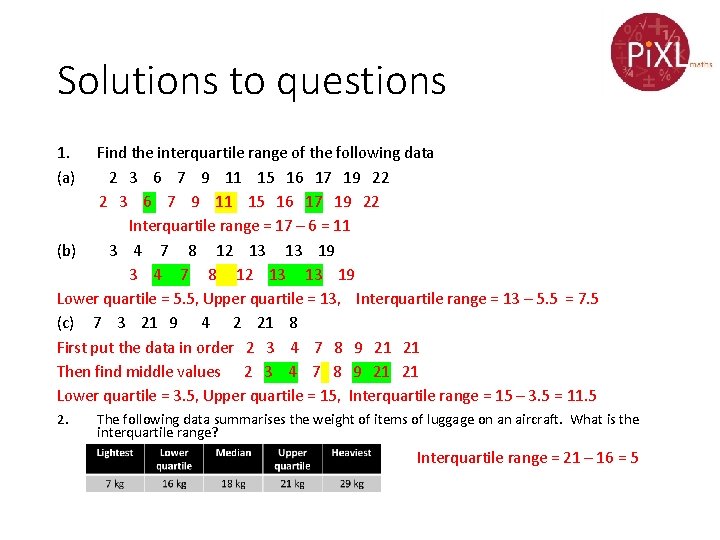
Solutions to questions 1. (a) Find the interquartile range of the following data 2 3 6 7 9 11 15 16 17 19 22 Interquartile range = 17 – 6 = 11 (b) 3 4 7 8 12 13 13 19 Lower quartile = 5. 5, Upper quartile = 13, Interquartile range = 13 – 5. 5 = 7. 5 (c) 7 3 21 9 4 2 21 8 First put the data in order 2 3 4 7 8 9 21 21 Then find middle values 2 3 4 7 8 9 21 21 Lower quartile = 3. 5, Upper quartile = 15, Interquartile range = 15 – 3. 5 = 11. 5 2. The following data summarises the weight of items of luggage on an aircraft. What is the interquartile range? Interquartile range = 21 – 16 = 5
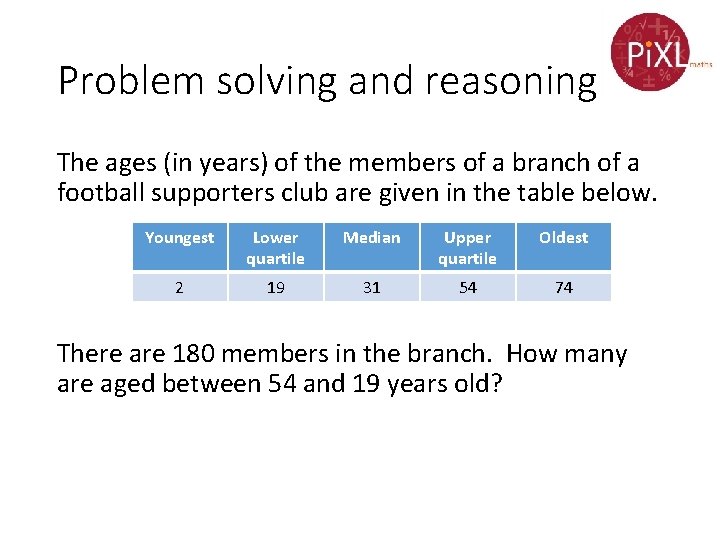
Problem solving and reasoning The ages (in years) of the members of a branch of a football supporters club are given in the table below. Youngest Lower quartile Median Upper quartile Oldest 2 19 31 54 74 There are 180 members in the branch. How many are aged between 54 and 19 years old?
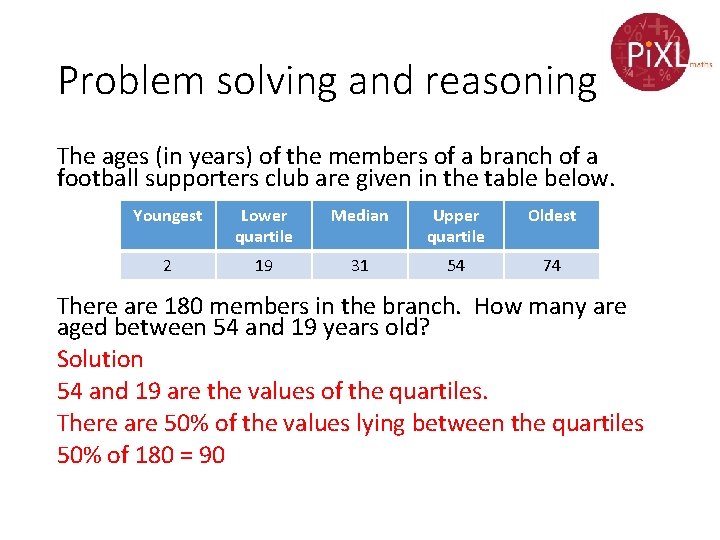
Problem solving and reasoning The ages (in years) of the members of a branch of a football supporters club are given in the table below. Youngest Lower quartile Median Upper quartile Oldest 2 19 31 54 74 There are 180 members in the branch. How many are aged between 54 and 19 years old? Solution 54 and 19 are the values of the quartiles. There are 50% of the values lying between the quartiles 50% of 180 = 90
- Slides: 11