Grade 8 Science Test 2012 1 The data

. Apparent")


 most likely move over")


- Slides: 70
Grade 8 Science Test 2012
1 The data table below shows apparent air temperature in degrees Fahrenheit (°F). Apparent air temperature is how hot the air feels at different air temperatures and different relative humidities. If the air temperature is 90°F and the relative humidity is 70%, the apparent air temperature is 1. 2. 3. 4. 20°F 71°F 106°F 113°F Table
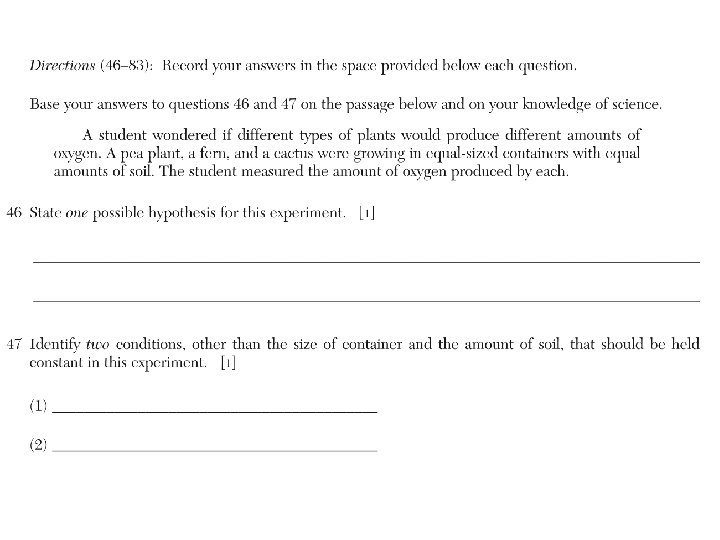
2 A student set up the experiment shown below to determine if radish seeds take in oxygen as they germinate. Methylene blue is a chemical that is blue when oxygen is present, but is colorless when oxygen is not present. Containers A and B each contained 200 m. L of water and 10 drops of methylene blue. Ten radish seeds were added to container A. Container B had no radish seeds. The purpose of container B in this experiment is to 1. serve as the control container 2. serve as the experimental container 3. show that seeds do not give off oxygen 4. show that seeds do not give off carbon dioxide Table
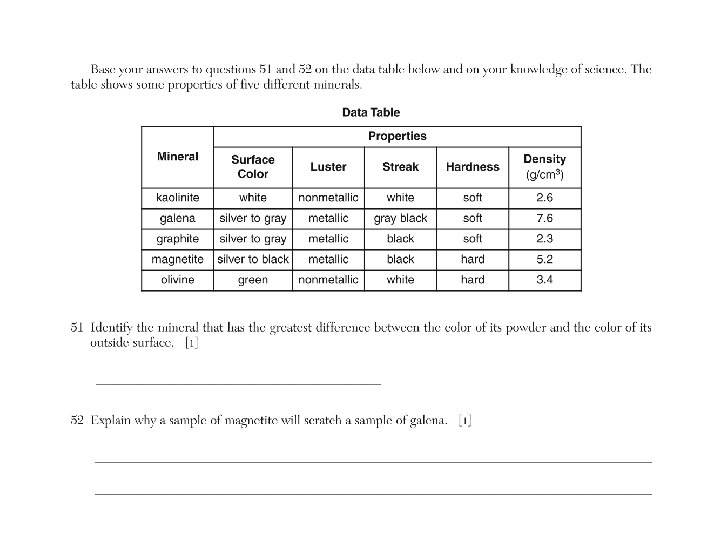
3 Which statement is an inference? 1. A thermometer shows that the air temperature is 56°F. 2. A mineral sample of galena produced a gray-black streak when tested. 3. Based on previous data, ten hurricanes may occur in the year 2013. 4. A weather vane indicates the wind is coming from the west. Table
4 The graph below shows a runner’s distance from the starting line during a 30 -minute race. Distance was measured in meters (m). Time was measured in minutes (min). During which time interval was the runner moving at the greatest average speed? 1. 2. 3. 4. 0– 5 minutes 10– 15 minutes 15– 20 minutes 25– 30 minutes Table
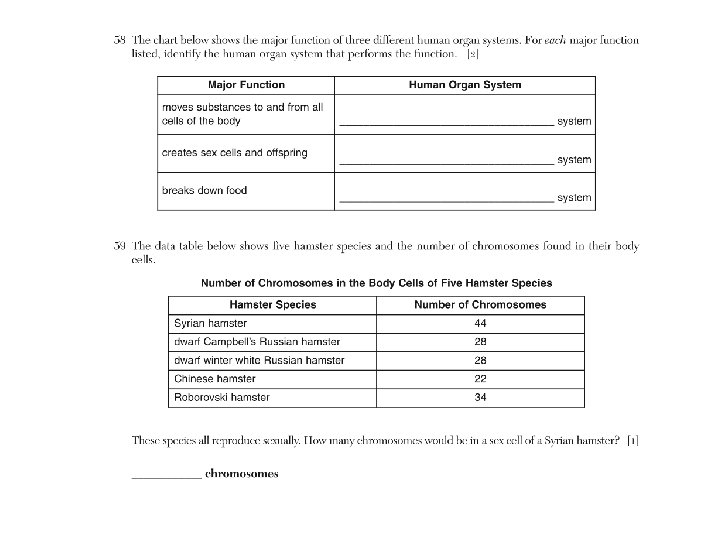
5 Which human organ system produces most of the hormones that regulate body functions? 1. 2. 3. 4. digestive nervous muscular endocrine Table
6 The fur of the snowshoe rabbit changes to a lighter color in the winter. This allows the rabbit to blend in with its surroundings. This change is an example of 1. 2. 3. 4. extinction competition biological adaptation ecological succession Table
7 The label below shows the nutrition facts for a snack food. How many grams of fat would be consumed if a person ate the entire box of snack food? 1. 2. 3. 4. 3 g 27 g 30 g 65 g Table
8 The diagram below shows a human organ system. Which human organ system is shown? 1. 2. 3. 4. nervous digestive circulatory respiratory Table
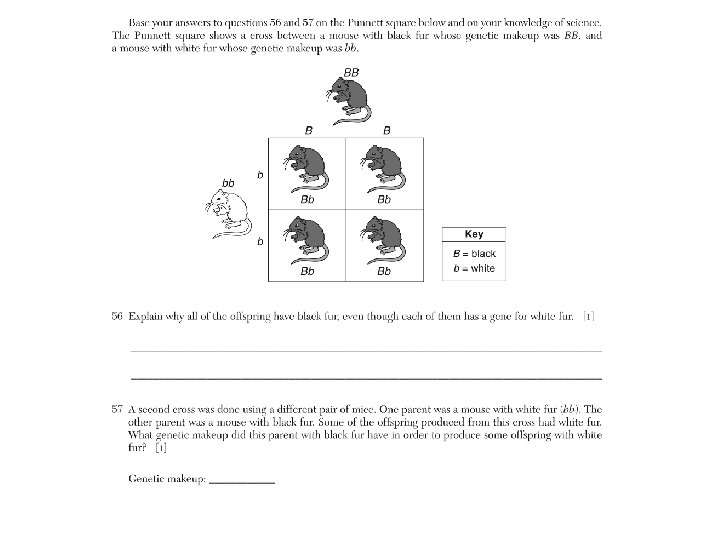
9 In living things, traits are passed on from one generation to the next by the transfer of 1. 2. 3. 4. blood minerals Calories DNA Table
10 The diagram below shows part of the human excretory system. The structures shown are primarily involved in 1. 2. 3. 4. transporting blood producing sex cells removing wastes breaking down food Table
11 Which health condition is an infectious disease? 1. pneumonia caused by microorganisms 2. heart problem caused by a high-fat diet 3. lung cancer caused by smoking 4. eye damage caused by ultraviolet light Table
12 A structure that carries a single unit of hereditary information is a 1. 2. 3. 4. gene tissue sex cell pedigree chart Table
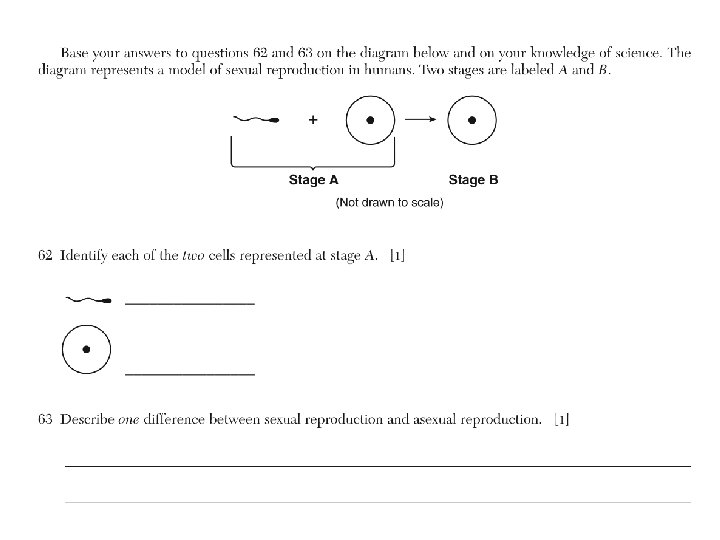
13 Which pair of terms describes the usual location for fertilization and the first stages of development in human reproduction? 1. external fertilization and external development 2. external fertilization and internal development 3. internal fertilization and external development 4. internal fertilization and internal development Table
14 Abnormal cell division in humans may result in 1. 2. 3. 4. cancer fertilization asexual reproduction dynamic equilibrium Table
15 Which process involves choosing certain organisms to reproduce with one another in order to pass on specific, desirable traits to their offspring? 1. 2. 3. 4. selective breeding asexual reproduction resource acquisition natural selection Table
16 During which process do cells use oxygen to release stored energy? 1. 2. 3. 4. photosynthesis respiration circulation digestion Table
17 The basic life functions of an organism are carried on by 1. 2. 3. 4. cells nutrients atoms hormones Table
18 The sum of all chemical reactions that take place within an organism is known as 1. 2. 3. 4. evolution metabolism circulation reproduction Table
19 Which factor would most likely limit the number of mice living in an area? 1. 2. 3. 4. plentiful resources stable climate more predators less competition Table
20 The flowchart below represents the process of photosynthesis. One step in the process is labeled X. Which activity occurs at X? 1. Plants are eaten by animals for food. 2. Carbon dioxide and water are used to make 3. sugar. 4. Plants release water into the soil. 5. Animals breathe out carbon dioxide Table
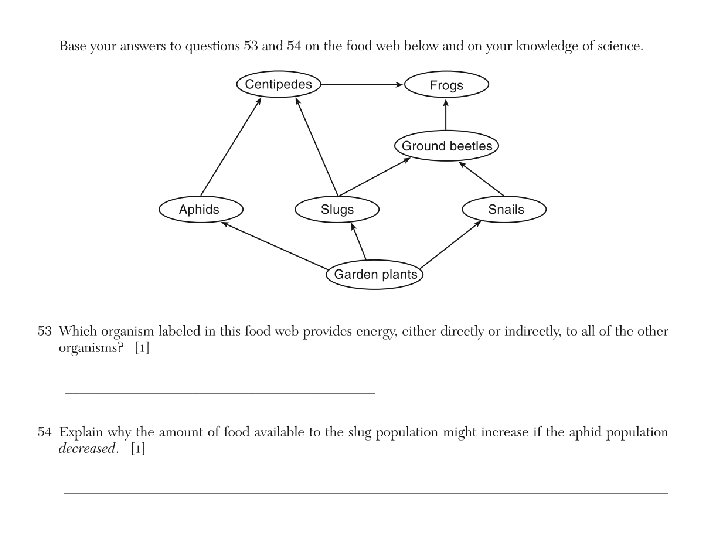
21 The diagram below shows a food chain. Which organisms in this food chain are herbivores? 1. 2. 3. 4. green plants caterpillars birds snakes Table
22 The diagram below shows several different organisms found in an area. The worms in the diagram represent 1. 2. 3. 4. a community an ecosystem a habitat a population Table
23 The diagram below shows how a plant community changed over 300 years. Which process caused the gradual changes shown in this plant community? 1. 2. 3. 4. urban growth global warming environmental pollution ecological succession Table
24 Which diagram best represents light being reflected after striking the flat surface of a mirror? 1. 2. 3. 4. Diagram 1 Diagram 2 Diagram 3 Diagram 4 Table
25 The diagram below shows the positions of the Sun, Earth, and the Moon as seen from space. Which event is caused by the Moon passing through Earth’s shadow? 1. 2. 3. 4. a meteor shower a change of seasons an eclipse an earthquake Table
26 A bright object with a long tail of glowing gases is in orbit around the Sun. This object is most likely 1. 2. 3. 4. a planet a star an asteroid a comet Table
27 The thin layer of rock on Earth’s surface is the 1. 2. 3. 4. atmosphere hemisphere hydrosphere lithosphere Table
28 Under which conditions would a sugar cube dissolve most quickly when placed in a liter of water at room temperature? 1. 2. 3. 4. A whole sugar cube is added and the water is stirred. A whole sugar cube is added and the water is not stirred. A crushed sugar cube is added and the water is not stirred. Table
29 All of the liquid from a test tube is poured into a beaker, as shown in the diagram below. Compared to the liquid that was in the test tube, the liquid in the beaker has 1. a different volume, but the same shape 2. a different volume and a different shape 3. the same volume, but a different shape 4. the same volume and the same shape Table
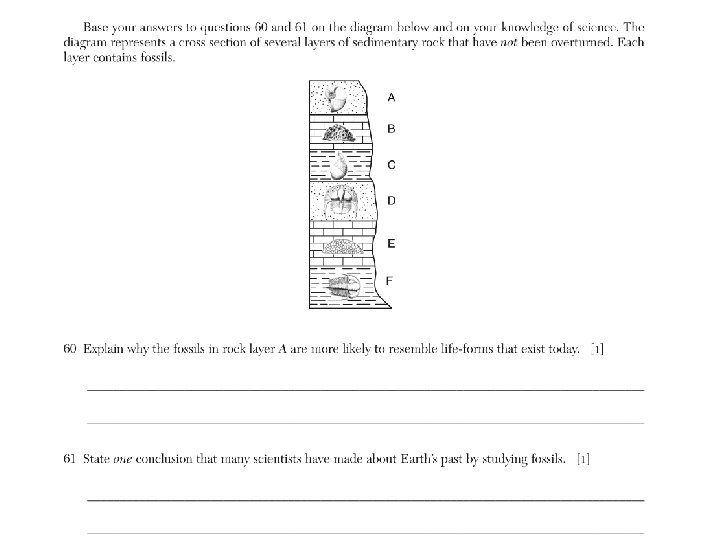
30 Rocks are classified as sedimentary, metamorphic, or igneous on the basis of the 1. age of the rocks 2. way the rocks were formed 3. types of fossils the rocks contain 4. number of minerals found in the rocks Table
31 Which temperature and moisture conditions describe an air mass that originates over the Atlantic Ocean near the equator? 1. 2. 3. 4. warm and dry warm and humid cool and dry cool and humid Table
32 Which property of a substance indicates whether the substance is a liquid or a solid at room temperature? 1. 2. 3. 4. melting point electrical conductivity flexibility solubility Table
33 The photograph below shows a satellite image of a hurricane. A satellite image of a hurricane helps weather forecasters to 1. warn residents of hazardous weather conditions 2. explain the effects of global warming on the ocean currents 3. predict the times of high tide and low tide 4. predict the total number of storms to occur in one year Table
Base your answers to questions 34 through 36 on the weather map below and on your knowledge of science. The center of a storm system (Low) over part of the United States and the frontal boundaries associated with this system are shown. Point A represents a location on the map. 34 The word Low on the map refers to 1. 2. 3. 4. air temperature air pressure relative humidity amount of cloud coverage Table
35 Precipitation is most likely occurring at A because it is located 1. 2. 3. 4. on a cold ocean surface on a warm land surface near the cold front near the warm front Table
36 In which compass direction will the storm center (Low) most likely move over the next few days if it follows a typical storm track? 1. 2. 3. 4. northeast southeast northwest southwest Table
37 The photograph below shows a phase of the Moon as seen by an observer in New York State. 1. 2. 3. 4. Diagram 1 Diagram 2 Diagram 3 Diagram 4 Table
38 Approximately how much snow falls in an average year at location X? 1. 2. 3. 4. 39 inches 40 inches 41 inches 42 inches Table
39 Which part of Pennsylvania has the greatest average yearly snowfall? 1. 2. 3. 4. northern eastern southern western Table
40 Fossil fuels are considered nonrenewable because they 1. produce pollution 2. are no longer used by humans 3. often contain microscopic animals 4. take millions of years to form Table
41 The diagram below shows a cross section of a waterfall. Points A, B, C, and D represent locations in the stream. At which location does the water have the greatest kinetic energy? 1. 2. 3. 4. A B C D Table
42 If the force used to push a shopping cart increases, the cart’s acceleration will 1. decrease 2. increase 3. remain the same Table
43 Sound waves are not able to travel through 1. 2. 3. 4. a cloud a vacuum metal water Table
44 The diagram below shows two magnets. If the magnets are brought closer together, they will 1. attract each other with a stronger force 2. attract each other with a weaker force 3. repel each other with a stronger force 4. repel each other with a weaker force Table
45 The diagram below shows a person using a simple machine to move a rock. Which simple machine is the person using? 1. 2. 3. 4. pulley inclined plane wheel and axle lever Table
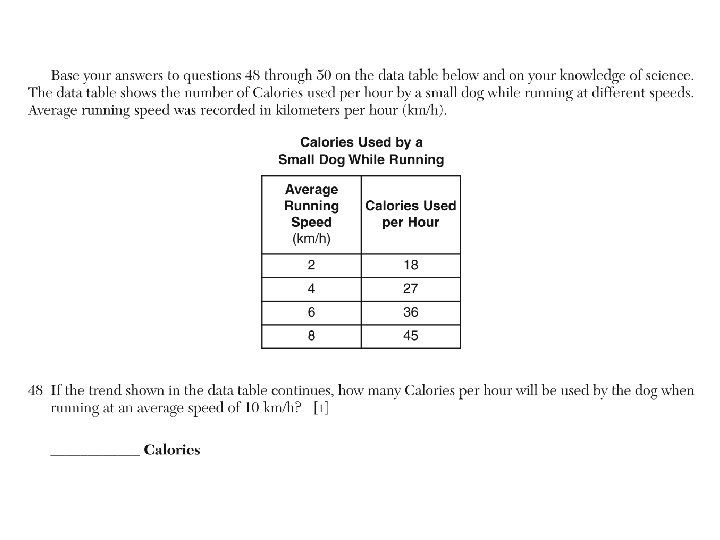
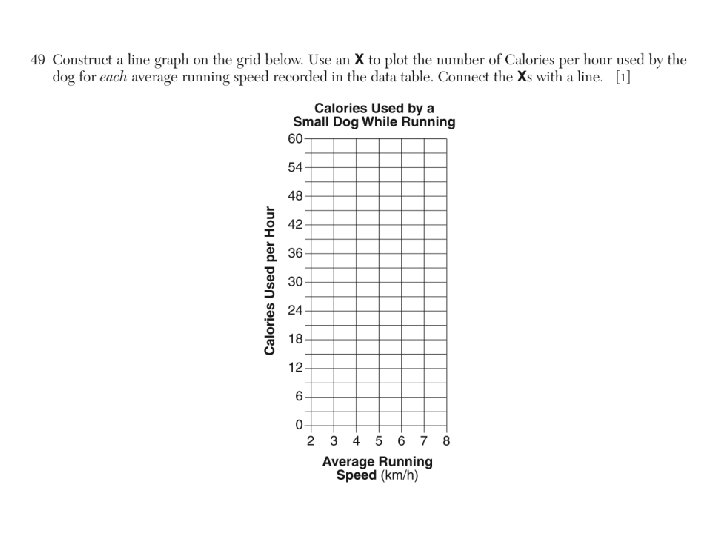
50 Describe the relationship between the dog’s average running speed and the number of Calories used per hour. [1] ________________________________________________________________
55 Use the terms below to complete the sequence of the levels of organization in a multicellular organism. [1] organs organ systems tissues cells → ______________________ → organism