GOES and POES Overview Bernie Connell Cooperative Institute

GOES and POES Overview Bernie Connell Cooperative Institute for Research in the Atmosphere Colorado State University/NOAA June 2016

850 km 35, 800 km Geostationary Operational Environmental Satellite geo-synchronous orbit 35, 800 km above the earth Polar-orbiting Operational Environmental Satellite sun-synchronous orbit ~450 -850 km above the earth

Characteristics of GOES • • Observes events and their evolution Repeat coverage in minutes Full earth disk every 3 hours Resolution at nadir : visible – 1 km , infrared 4 km, sounder – 10 km • Excellent viewing of the tropics; restricted viewing of high-latitudes • Same viewing angle for fixed point Satellite Meteorology: Remote Sensing Using the New GOES Imager

GOES Equator GOES I-M Data. Book GOES West at 135° W currently GOES-15 GOES East at 75° W currently GOES-13
 (CONtinental")
GOES EAST IMAGER ROUTINE SCHEDULE SCANS S. CONUS (Pacific Continental U. S. ) (CONtinental U. S. )

Characteristics of POES • • Observes events at fixed and infrequent times Repeat coverage twice daily Global coverage Resolution: visible and infrared 0. 375 -1 km, sounders: microwave – 10 -50 km, infrared 20 km • Excellent viewing of all latitudes • Varying viewing angle Satellite Meteorology: Remote Sensing Using the New GOES Imager
 in about 100 min; i. e.")
Orbital Coverage • Satellite makes one orbit (360°) in about 100 min; i. e. , it goes about 3. 6°/min, or about 10° in 3 minutes. • With a knowledge of which way the satellite is moving and how fast it is moving, one can estimate viewing time at a particular point. Introduction to POES data and products – COMET/VISIT teletraining

Image Resolution The design of the sensor and resulting image resolution is determined by many factors: • Detail in the horizontal (imagers) • Detail in the vertical (sounders) • Satellite distance from earth – (36, 000 km vs. 850 km) • Resolving power of the lens and the ’s $ wavelength of radiation. $ , $ • Size of sensor/satellite , $$ $$

Active vs. Passive Sensors • A passive sensor measures energy emitted by another source. • An active sensor, such as a weather radar, measures the return signal from a pulse of energy emitted by the sensor itself.
 of narrow contiguous")
Multispectral vs. Hyperspectral • Hyperspectral –a large number (hundreds or thousands) of narrow contiguous wavelength bands • Multispectral –a small number numbe of broad wavelength bands

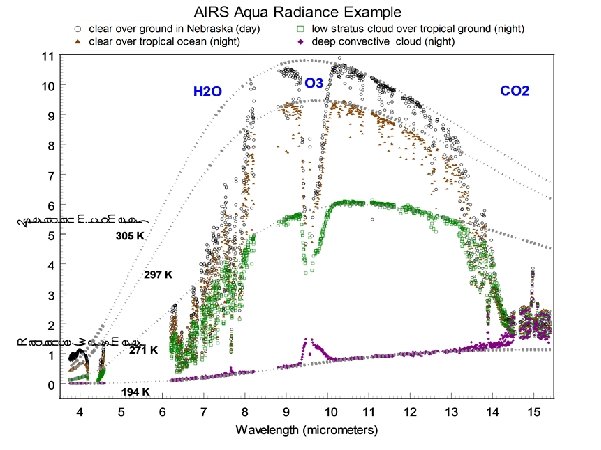
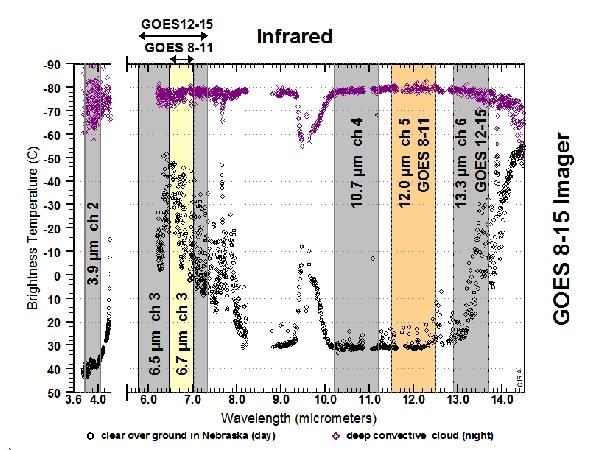
10. 7 m 6. 5 m Current GOES 13. 3 m 299 K ~ 26 C ~ 79 F, 230 K ~ -43 C ~ -45 F 3. 9 m NOAA/NESDIS STAR and GOES-R Imagery Team 0. 65 m

0. 86 m 1. 38 m GOES-R launch in Oct 2016 WG Proxy ABI Simulations of Hurricane Katrina 1. 61 m 2. 26 m 3. 9 m 6. 95 m 7. 34 m 8. 5 m 10. 35 m 11. 2 m 12. 3 m 6. 19 m 9. 61 m 13. 3 m 299 K ~ 26 C ~ 79 F, 230 K ~ -43 C ~ -45 F 0. 64 m NOAA/NESDIS STAR and GOES-R Imagery Team 0. 47 m
 The sun – solar radiation 2) The")
The main sources of radiation are: 1) The sun – solar radiation 2) The earth - atmosphere – terrestrial radiation. Both these bodies emit radiation at a rate which: < Sun emitted radiation depends on their temperatures (given by Stefan-Boltzman’s Law) and which varies with wavelength (given by Planck’s Law) M. E. Pestaina-Jeffers CIMH, Barbados

Schematic diagram of: Solar Radiation - peaks at around 0. 5 µm Terrestrial Radiation - peaks at around 10 µm < Sun emitted radiation Diagram from COMET Forecaster’s Multimedia Library: M. E. Pestaina-Jeffers CIMH, Barbados Satellite Meteorology: Remote sensing Using the New Goes Image

Illustration of the measurement of monochromatic radiance – the satellite measures the energy per unit time per unit area in a small wavelength interval over a certain small solid angle striking it’s detection area = radiant flux/unit area/wavelength/solid angle Diagram from COMET Forecaster’s Multimedia Library: Satellite Meteorology: Remote sensing Using the New Goes Image M. E. Pestaina-Jeffers CIMH, Barbados

What affects radiation that the satellite senses? Interaction with “targets” and the atmosphere and aerosols Cloud

Visible

Infrared 10. 7 um

Water Vapor 6. 7 um

Image with enhancement

Visible Figure courtesy of S. Bachmeier, CIMSS Navigation is Important Shortwave Window GOES-12: animation GOES-13: Upper Peninsula MI Fires 21

Calibration is Important GOES Satellite and Sensors GOES Calibration: satellite measurements GVAR counts GOES Scaling: GVAR counts image display GOES-R will have GRB counts

Hyperspectral: The visible to near infrared portion of the spectrum GOES VIS (520 – 720 nm)

Spectral animation of a single AVIRIS scene reveals the power of being able to observe with high spectral resolution. AVIRIS Image - Linden CA 20 -Aug-1992 224 Spectral Bands: 0. 4 - 2. 5 mm Pixel: 20 mx 20 m Scene: 10 kmx 10 km AVI Loop courtesy of: Dr. Mike Griffin MIT Lincoln Laboratory 520 – 720 nm

AVIRIS Spectral Information from the Scene Depicting Cloud, Smoke and Active Burn Areas AVIRIS Image Linden CA 20 -Aug-1992 224 Spectral Bands 0. 4 - 2. 5 m Pixel: 20 m x 20 m Scene: 10 km x 10 km Smoke - large particles Shadow < Grass Lake > Fire Hot Area Cloud Soil > Smoke small particles

Schematic diagram of: Solar Radiation - peaks at around 0. 5 µm Terrestrial Radiation - peaks at around 10 µm < Sun emitted radiation Diagram from COMET Forecaster’s Multimedia Library: M. E. Pestaina-Jeffers CIMH, Barbados Satellite Meteorology: Remote sensing Using the New Goes Image

Planck’s Irradiance Equation describes the monochromatic irradiance of a surface of a black body as a function of temperature and wavelength. Equation from: COMET Forecaster’s Multimedia Library: Satellite Meteorology: Remote sensing Using the New Goes Image M. E. Pestaina-Jeffers CIMH, Barbados

13+ km AIRS Venezuela Colombia 1 km MODIS Aqua

GOES 6. 5 um GOES 3. 9 um GOES 10. 7 um GOES 13. 3 um GOES 10. 7 um GOES 12. 0 um
 Inverse Planck function: temperature = B -1")
GVAR IR radiance temperature brightness count (non-linear) Inverse Planck function: temperature = B -1 (R) Teff = (c 2 v) / ln [ 1 + ( c 1 v 3) / R ] where: Teff = effective blackbody temperature c 1 = 1. 191066 E-5 m W / (m 2 sr cm -1) c 2 = 1. 438833 K / cm -1 v = central wavenumber of the channel R = radiance (m. W/(m 2 sr cm -1))

POES
 • Normalized Difference Vegetation Index (NDVI)")
AVHRR Products SST • Sea Surface Temperature (SST) • Normalized Difference Vegetation Index (NDVI) • Atmospheric aerosols • Volcanic Ash detection • Fire detection NDVI Aerosols Fires Volcanic Ash

Microwave Spectrum Higher Frequency Lower Frequency

Levizzani

Levizzani
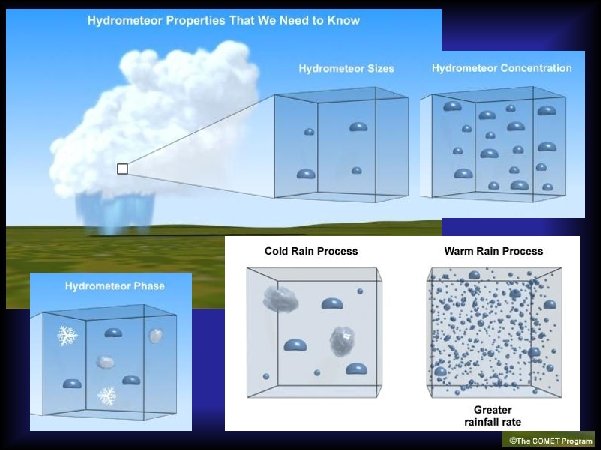

Meteorological Parameters Summary of Key Interactions and Potential Uses Frequencies AMSU SSMI Microwave Processes Potential Uses 23 GHz 22 GHz Absorption and emission by water vapor Oceanic precipitable water 31, 50, 89 GHz 19, 37, 85 GHz Absorption and emission by cloud water Oceanic cloud water and rainfall 89 GHz 85 GHz Scattering by cloud ice Land ocean rainfall 31, 50, 89 GHz 19, 37, 85 GHz Variations in surface emissivity: Land/water boundaries Soil moisture/wetness Surface vegetation Ocean surface wind speed Snow and ice cover L H –Land vs. water –Different land types –Differenc ocean surfaces Scattering by snow and ice Polar Satellite Products for the Operational Forecaster – COMET CD

Thank You! bernie. connell@colostate. edu
- Slides: 40