Glucose quantitative determination Hormonal regulation of blood glucose

Glucose, quantitative determination

Hormonal regulation of blood glucose

Methods • Chemical • Enzymatic


CHEMICAL METHODS • Oxidation - Reduction Methods – Folin – Wu – Somogyi - Nelson • Condansation Methods – Orto - Toluidine

Benedict reaction

Folin - Wu Glucose + Cu 2+ >>>Gloconate + Cu+ p. H > 7 , heat Cu+ + phosphomolybdate Blue molybdenium complex λ = 660 nm

Somogyi - Nelson Glucose + Cu 2+ >>> Gloconate + Cu+ p. H > 7 , heat Cu+ + arsenomolybdate >>> blue molybdenium complex λ = 660 nm

O - Toluidine Method o - Toluidine + Glucose >>> Glycosylamine p. H < 7 , heat NH 2 Schiff Base CH 3 λ = 630 nm color complex


Interference • • Bilirobin Galactose Mannose Hemoglobin

Enzymatic Methods • Glucose Oxidase • Hexokinase • Glucose dehydrogenase

Glucose Oxidase α -D-Glucose Mutarotase glucose oxidase β-D-Glucose O 2 Gluconic acid + H 2 O 2 + chromogen Peroxidase (o-dianisidine) Color complex + H 2 O (phenylamine) λ = 520 nm

• Glucose oxidase Inhibited by – High concentrations of uric acid, ascorbic acid, bilirubin, glutathione, creatinine. L-cysteine, Ldopa. Dopamine, methyldopa and citric acid

Hexokinase method

Glucose dehydrogenase method
 Fasting 12 - 14")
Clinical Significance • • F. B. S (Fasting Blood Suger) Fasting 12 - 14 hours Normal Range 70 - 110 mg/d. L Decrease – Hypoglycemia • Increase – Hyperglycemia

Criteria for the diagnosis of diabetes mellitus

Diagnosis of Pre-Diabetes and Diabetes Mellitus
 – IDDM (type")
Hyperglycemia • FBS > 140 mg/d. L • Primary (Diabetes Mellitus) – IDDM (type I) – NIDDM (type II)
 • Absolute deficiency of insulin – Make up about")
Insulin Dependent Diabetes Mellitus (IDDM) • Absolute deficiency of insulin – Make up about 10% of all patients with D. M. • IDDM persent at an early age (usually before 30) • Clinical signs : – Blood glucose – Insulin (decreased) – Ketosis – Loss of body weight
 • Deficiency of insulin receptor • Patients are commonly")
Noninsulin Dependent Diabetes Mellitus (NIDDM) • Deficiency of insulin receptor • Patients are commonly obese • NIDDM is the most common from of D. M. ( 8090%) • Usually first present at an age over 40 • Clinical signs – Blood glucose – Insulin – Osmotic diuresis – Dehydration

Characteristics of Type 1 and Type 2 Diabetes

Response of plasma insulin to glucose stimulation

Secondary hyperglycemia • • Pancratectomy Acromegaly Cushing’s syndrome Glucagonoma

Hypoglycemia • Adult < 45 - 50 mg/d. L in fasting • Infant – Preterm < 25 mg/d. L – Fullterm < 35 mg/d. L
 • Glycogen Storage Diseases (GSD) •")
Causes of hypoglycemia • Insulinoma (islet cell tumors) • Glycogen Storage Diseases (GSD) • Addison’s disease

OGTT Fasting 80 mg/d. L 0. 5 1 2 3 155 mg/d. L 165 mg/d. L 140 mg/d. L 80 mg/d. L
")
Oral Glucose Tolerance Tests (OGTT)

Screening and diagnosis of gestational diabetes mellitus

OGTT curve
 – To screen for")
2 hpp • 2 hpp (two hours postprandial plasma glucose) – To screen for diabetes mellitus – To monitor glucose control

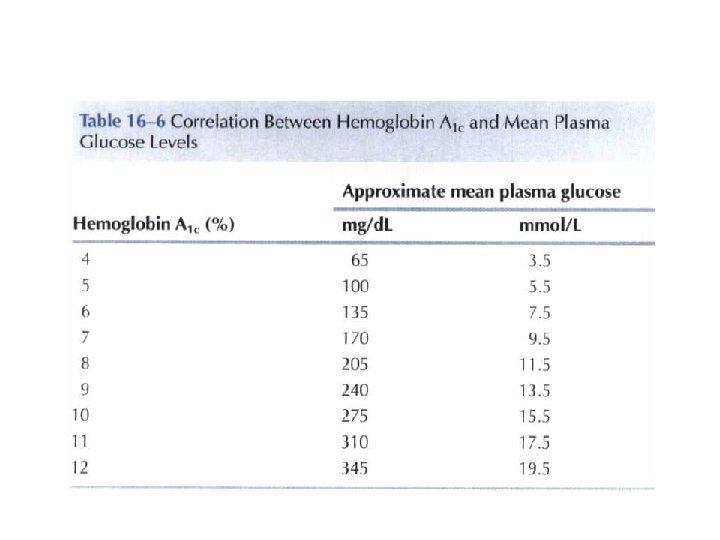
Glycated hemoglubin • Hb. A 1 c

• an index of average blood glucose levels over the past 2 -4 months. • People without diabetes have Hb. A 1 c levels between 4 -6%. • Measure Hb. A 1 C levels every 3 -6 months to monitor glycemic control
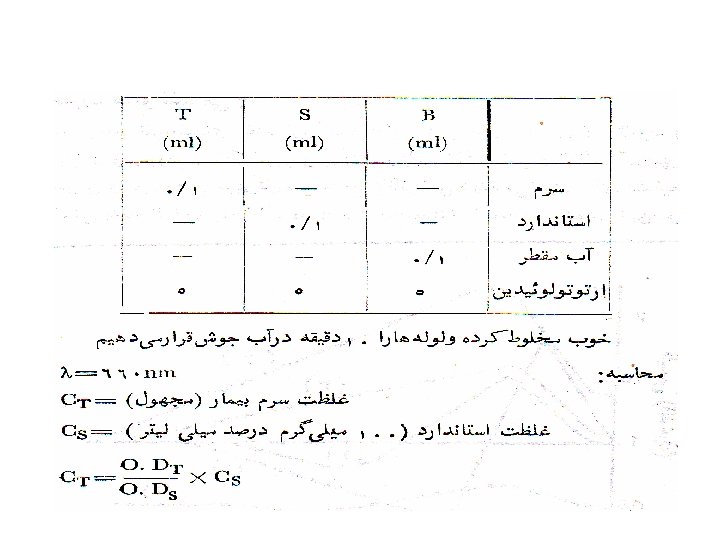


• Put 10 minute in boil water bath • read at 630 nm • Ct = At / Ast * Cst
- Slides: 40