Globalization and the BRICs Emergence Understanding challenges and

Globalization and the BRIC’s Emergence – Understanding challenges and opportunities

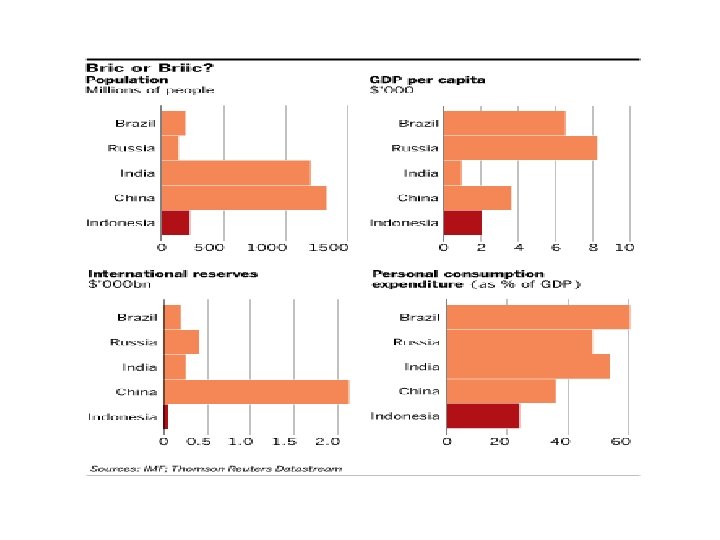
The BRICs
 Environment and resources – – Geography, climate, disease and")
Determinants of economic well-being a) Environment and resources – – Geography, climate, disease and demography (human and animal) Human and non-human capital; Land b) Culture, philosophy and religion – Impact on motives, incentives and opportunities c) Political and social institutions – – – d) Individual freedom vs. authoritarian control Rule of law: extent of arbitrary confiscation or taxation Order vs. anarchy: stimulate or retard economic expansion? Markets: “The Division of Labour is Limited by the Extent of the Market” – Incentives to trade and save (requires protection of property rights) – Competition versus exercise of monopoly power – Extraction of surplus: what remains for capital accumulation? e) Technologies and their application – – Diffusion of new ideas and incentives for their application (Commercial links promoted the spread of new technologies) Freedom to reap the rewards from investment (capital accumulation)

Specificities of BRICS • Wide variation of production structures – heterogeneity of production systems – heterogeneity of demand – Shortage of capital and knowledge • Wide regional differences – gap between the most and the least developed regions enormous and still growing. • Wide income differences – extremely high open and hidden unemployment among unskilled workers – there may be shortages of skilled labour

How to analyze the BRICs? • • History Politics Culture modes of insertion in globalization – FDI (scale and type very different) – Migration • source of both capital and skilled labour (Diasporas in China and India) • Brain Drain

BRICs Fundamentals
 (millions)")
Size matters: geography and demography Frontières Surface Population terrestres Urbanisation (millions km 2) (millions) (nombre) (%) Etats-Unis 9, 61 310 2 82 Japon 0, 38 127 0 66 Union Européenne (27) 4, 42 501 19 74 Brésil 8, 51 191 10 86 Russie 17, 10 143 14 73 Inde 3, 29 1210 6 29 Chine 9, 64 1340 14 43 TRIADE 14, 41 938 . . 74 BRIC 38, 54 2884 . . 41 Sources: ONU, World Population Prospects; Instituto Brasileiro de Geografia e Estatística; China National Bureau of Statistics; Office of the Registrar General and Census Commissioner, India; Rosstat.

Population, area, density, total and per capita GDP Population total 2009 thousands Area 2 km Density inhabitants 2 per km Nominal GDP 2008 total per capita Brazil 193. 734 8. 547. 403 22 1. 552. 656 3. 225 Mexico 105. 699 1. 958. 201 54 948. 476 6. 397 China 1. 345. 751 9. 560. 961 134 4. 348. 303 1. 474 India 1. 198. 003 3. 287. 263 331 1. 252. 903 626 48. 333 99. 268 480 888. 023 14. 266 140. 874 17. 075. 400 8 984. 927 4. 047 39 283. 088 4. 507 Korea Russia South Africa 50. 110 1. 221. 037 Source: UNCTAD Handbook of Statistics, 2009.

The BRICs: Population and GDP Source: EIU Country Reports; Nominal GDP converted to US $ billion for comparison

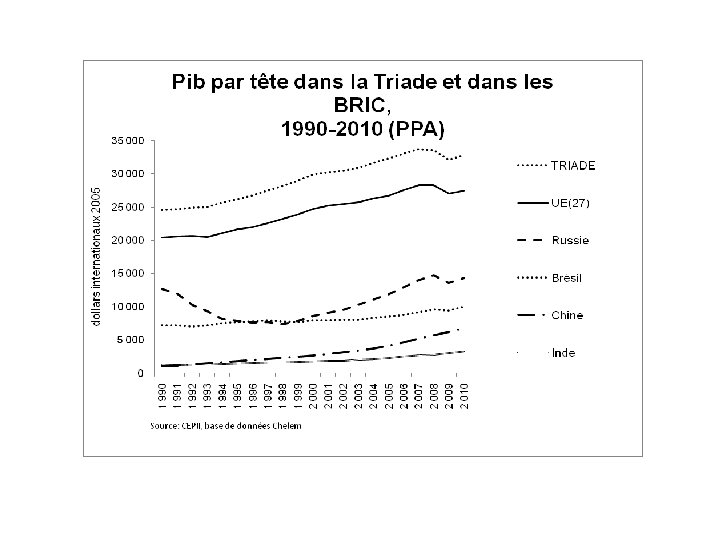
Share of global GDP Dollars courants 1990 2000 PPA 2010 1990 2000 2010 États-Unis 26 31 23 22 23 20 Japon 14 14 9 9 8 6 Union Européenne (27) 33 26 26 27 25 20 Brésil 2 2 3 3 Russie 1 1 2 5 3 3 Inde 1 1 3 3 4 6 Chine 2 4 9 3 7 13 Monde 100 100 100 Triade 73 71 58 58 56 46 BRIC 6 8 17 14 17 25 PPA: Parité de pouvoir d'achat, dollars internationaux 2005 Source: CEPII, base de données Chelem

The BRICs: GDP per Capita Source: EIU 2011 Country Reports; GDP per Capita at PPP

The BRICs: Growth Rates
 1700 1820 1950 1973 Brésil ,")
Distribution du PIB mondial (dollars internationaux de 1990) 1700 1820 1950 1973 Brésil , , , 0, 4 1, 6 2, 4 Russie/Union soviétique 4, 4 5, 4 9, 6 9, 4 Inde 24, 4 16, 0 4, 2 3, 1 Chine 22, 3 32, 9 4, 5 4, 6 BRIC 51, 1 54, 7 19, 9 19, 5 Etats Unis 0, 1 1, 8 27, 3 22, 0 Europe 25, 4 26, 6 29, 8 29, 1 Japon 4, 1 3, 0 7, 7 Monde 100 100 Source Maddison [2003] et Maddison [1995]
 1700 1820 1950 1973 527 1 287")
PIB par habitant (dollars internationaux de 1990) 1700 1820 1950 1973 527 1 287 9 573 16 607 1 024 1 228 5 513 11 694 Japon 570 704 1 873 11 017 Russie 611 751 2 834 6 058 670 1 673 3 913 États-Unis Europe occidentale Brésil Chine 600 523 614 1 186 Inde 550 531 597 853
 Fonte:")
Rates of Growth of World GDP, 1700 -2003 (annual average compound growth rates) Fonte: Maddison A. , Chinese Economic Performance in the Long Run, OECD Development Centre, 2007.

Eurasia: economic integration & development • Europe was in relative decline after collapse of Roman Empire – Dark Ages and Middle Ages, through to c 1500 – Centuries of change, not stagnation but not sustained progress either – Contact with rest of world (Asia) via Middle East: upheavals of political & religious conflict, but trade continues too, even expands • East Asia: Chinese civilisation developed early relative to Europe – Subject to Mongol invasion & domination from 12 th to 14 th centuries – Sea-borne trade with south Asia, gradually extending westwards – Overland trade via “silk road”, the Levant and Venice • South Asia: long history of diverse civilisations – Subject to periodic invasions (e. g. Moghuls) overland from the west – Sea-borne trade via Arabia, the Levant and Venice • Development of the “European exception” (economic success) – A “great divergence” emerged, but when? Probably not until after 1500, some argue not until as late as 1800 (the “California School”)
 and England")
• The divergence between the richest parts of China (Yangzi delta) and England occurred between 1750 and 1800 • What gave England/Europe the decisive advantages over the Yangzi delta/China were • 1) Colonies which ensured the supply of cotton, produced and processed with cheep slave labour • 2) Coal in locations near the industrial centers • Therefore England could escape the land constraint

Pomeranz – pros and cons • Against “involution” thesis – diminishing marginal returns because of population increase (Philip C. Huang) • Since then: lively debates on issues of calculation and miscalculation • West was advanced in comparison to China: Education (indicator: book production) • China had coal and iron, not near Yangzi delta, but near Hankou, another industrial/entrepot city. • Moreover, transport was sophisticated in 18 th c. China
 Source: Maddison A.")
Per capita GDP, main areas and countries: (1990 PPP US$ billion) Source: Maddison A. , Chinese Economic Performance in the Long Run, OECD Development Centre, 2007.
 Source: Maddison A.")
GDP growth rate, main areas and countries: (1990 PPP US$ billion) Source: Maddison A. , Chinese Economic Performance in the Long Run, OECD Development Centre, 2007.
 Consommation Investissements Gouvernem Brésil Russie Inde Chine Source: UN Solde")
GDP structure (demand side) Consommation Investissements Gouvernem Brésil Russie Inde Chine Source: UN Solde Ménages ent Capital fixe Stocks extérieur 2000 64 19 17 1 -2 2009 63 21 17 0 0 2000 46 15 17 2 20 2009 55 20 21 -3 7 2000 64 13 23 1 -1 2009 57 12 34 1 -5 2000 46 16 34 1 2 2009 37 14 44 2 9

Growth Conditions – – – Sound, stable macroeconomic policies Strong, stable political institutions Openness High levels of education ‘Miracle’ conditions are not needed.

China • Linear economic transformation since 1979 – SOE reform – Private entrepreneurship – FDI • Less clear-cut political transformation – Beijing – Local level Russia • As a single geopolitical entity, has existed for barely twenty years. • drastic political, economic and intellectual changes from the 1991 dissolution of the Soviet Union • Oil/natural resources dependence Dutch disease • Kremlin

India • Much greater diversity • A democratic miracle? • Economic transformation since 1991 • Political alternance • Less stable than it seems? Brazil • Internal cleavages complex political economy • Military experience • Political alternance • More stable than it seems?
 Transformation to market oriented economy (1979 -2004)")
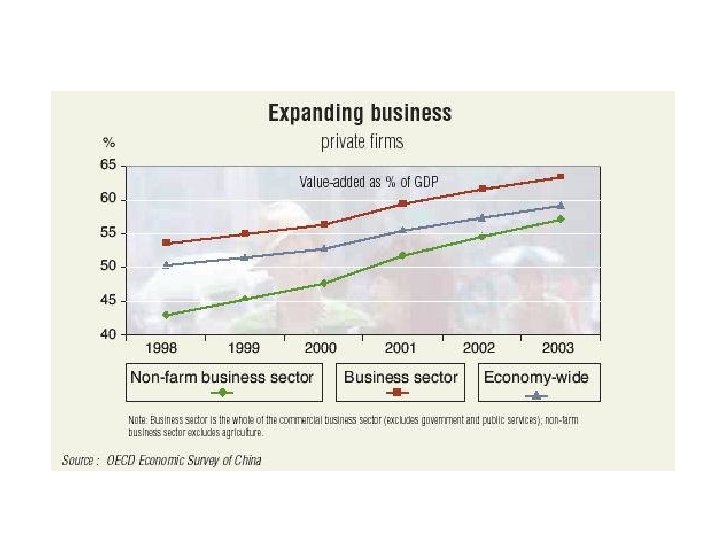
China’s economic development Planned economy (1953 -1978) Transformation to market oriented economy (1979 -2004) 9% New era of development (2005 -present) 10% 5% Approximate average GDP growth rate Source : National Statistics Bureau, http: //www. stats. gov. cn/tjsj/ China Research Center for Public Policy , http: //www. crcpp. org/cpipphtml/en/en_sum_report/2007 -11/20/200711200940. html
 PIB Brésil Russie Inde Chine 2010 2009 e 2010 100")
GDP structure (supply side) PIB Brésil Russie Inde Chine 2010 2009 e 2010 100 100 6 4 20 10 Industrie&bâtiment 27 37 25 47 Services 67 59 55 43 Agriculture Note : e = estimation Sources: Statistiques nationales

Social development Brésil 1993 Russie 2009 1993 Inde 2008 1993 Chine 2005 1993 2005 Pauvres en % de la population < $1, 25 13 4 3 0 49 42 54 16 < $2, 00 25 10 8 2 82 76 79 37 60 54 48 42 31 33 36 35 Inegalité Coefficient de Gini (%)

Poverty measures: income and multidimensional

Poverty Reduction in Brazil, China and India Headcount indices of poverty for a common international poverty line Survey-based Mixed method Source: Chen and Ravallion (2009).

BRICS and selected countries: Gini index/ social unequality Brazil Russia India China South Africa Mexico Korea, Rep. USA Japan Most recent data 59. 3 31. 0 32. 5 44. 7 57. 8 54. 6 31. 6 40. 8 24. 9 Source: UNDP Is the highly unevenly distributed income a serious development problem for Brazil and South Africa? Is China increasing social unequality a problem for the future?

Rémunération totale horaire dans le secteur manufacturier, 2002 -2008

Households according to disposable income bracket in BRIC countries: 2002/2007 ‘ 000 households Source: Euromonitor International from national statistics
")
Growth in volume of world merchandise trade and GDP (Annual % change, 2005 -13)

Growth in trade was strongest for Europe and Asia

EU has retained its importance as “central” in the global trade network

Asian intraregional trade has expanded rapidly since 1990

The Diffusion of Key Global Trade Players

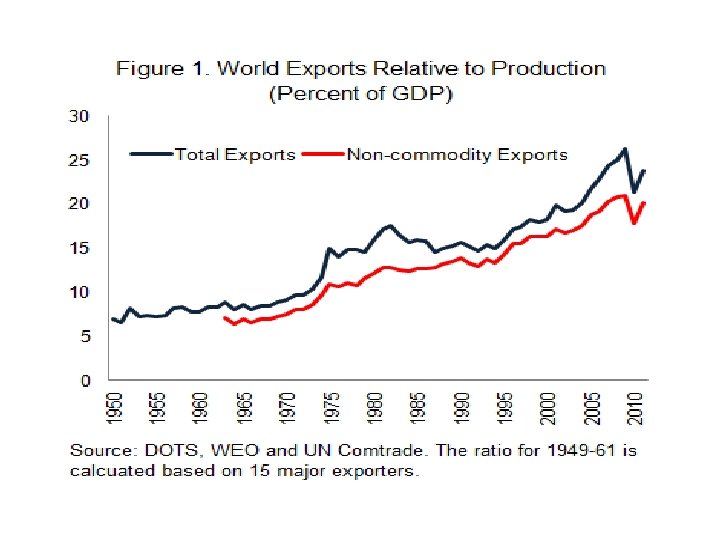
Ratio of exports and imports of goods and commercial services to GDP, 2007 Source: WORLD TRADE DEVELOPMENTS
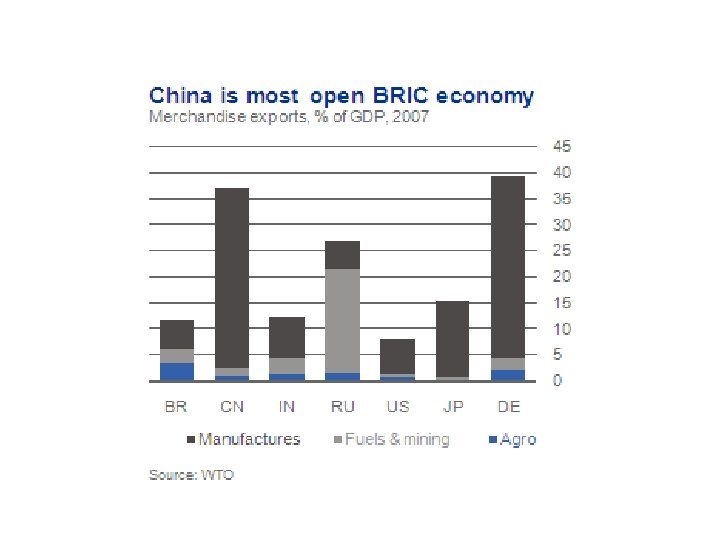

Trade openness Exportations de biens et services Importations de biens et en % du PIB services en % du PIB 1990 2009 Brésil 8 11 7 11 Chine 16 27 13 22 Inde 7 20 9 24 Russie 18 28 18 20 Japon 10 13 9 12 Etats-Unis 10 11 11 14 Source: World Development Indicators
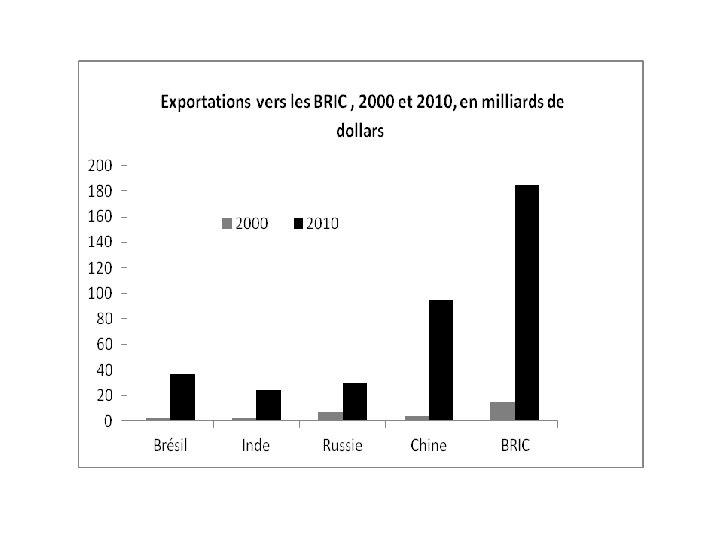
 Exportations Importations 1990 2000")
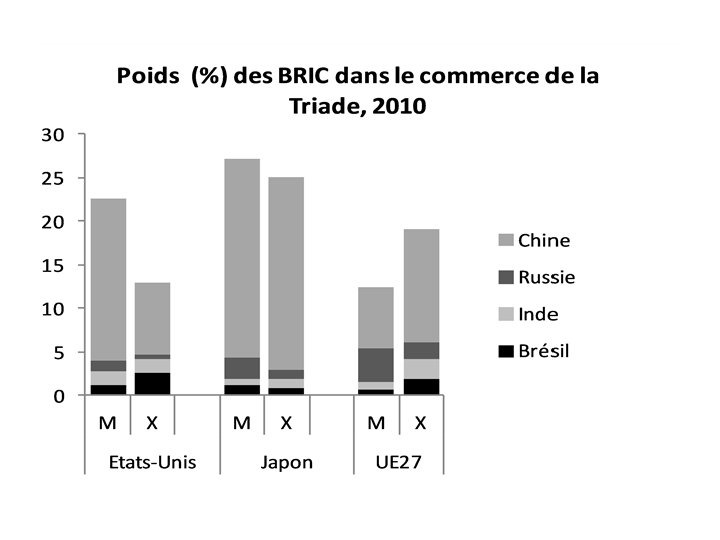
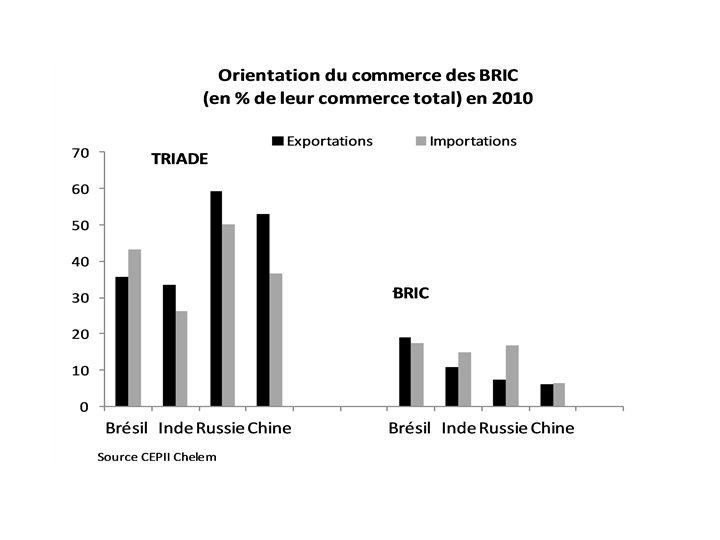
Poids des BRIC dans le commerce mondial de marchandises (%) Exportations Importations 1990 2000 2010 100, 0 100, 0 Brésil 1, 3 1, 2 1, 7 0, 9 1, 2 1, 6 Russie n. d. 2, 2 3, 4 n. d. 0, 9 2, 1 inde 0, 7 0, 9 1, 8 0, 9 1, 0 2, 7 Chine 2, 5 5, 2 13, 3 2, 1 4, 4 11, 6 BRIC 4, 5 9, 4 20, 2 3, 9 7, 5 18, 0 Japon 11, 6 10, 0 6, 5 9, 2 7, 5 5, 8 Etats-Unis 15, 9 16, 3 10, 8 20, 1 24, 9 16, 4 UE* 21, 4 16, 4 15, 0 22, 5 18, 1 16, 5 Triade 49, 0 42, 8 32, 3 51, 8 50, 5 38, 6 Monde* Source: OMC

Composition des exportations de biens et services en 2009 Agro- Pr. industriels Autres Service Total manufacturés Pr. primaires alim pr. s Brésil 100 33 20 28 3 15 Inde 100 34 11 6 14 35 Russie 100 19 59 5 7 12 Chine 100 86 2 2 2 10 Source: CEPII Base de données Chelem

China surpassing Japan as a more significant regional and global consumer

Gross exports may not appropriately capture the extent of domestic value added export

Vertical specialization has increased since the mid-1990 s

G 7 exports are still differentiated by price and quality characteristics
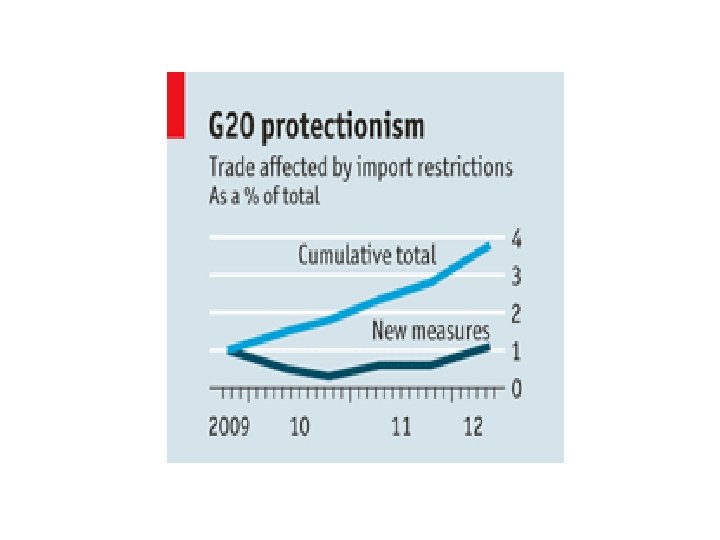
 Tariffs, import licences and customs controls • Governments often justify these steps as")
1) Tariffs, import licences and customs controls • Governments often justify these steps as short -term remedies for particular problems – AR new minimum prices for backpacks and prams – new tariffs on lawn-mower-blades in South Africa • cumulative impact is significant – barriers are easier to put in place than to remove – the share of trade held back by protectionist measures tends to grow over time – longer-run strategic decisions to distort markets in order to promote national industries
 \"Buy National\" policies • Sarkozy 2012: “Free trade, yes. Disloyal competition, no. Europe")
2) "Buy National" policies • Sarkozy 2012: “Free trade, yes. Disloyal competition, no. Europe that opens all its public-procurement markets when others do not open them at all—it's no. ” • EU must deal with the world with less “naïveté” (De Gucht) • Recovery and Reinvestment Act 2009 (U. S. -made steel and iron in federally funded construction projects). • China since 2009 – – purchase of foreign products or services in government-invested projects obtain approval by the relevant government authorities expanded to other areas of government procurement, such as plans to limit official vehicle purchases to domestic brands) • Plano Brasil Maior (August 2011) + local content requirements • Buy Indian policy (early 2012) – 80% of telecom equipment thru domestic manufacturing by 2020
 technical barriers and safety regulations • TBT notifications per year (as of 2011)")
3) technical barriers and safety regulations • TBT notifications per year (as of 2011) – 14 for DCs, 8 for EEs • notifications from emerging countries – TBT total number from 506 in 2007 to 968 in 2011 – SPS from 488 in May 10 -May 11 to 519 in May 11 -May 12 – CN certification requirements for imported wind turbine generators (2011) – IN certification of seven new steel products to conform to national standards – China Ro. HS rules which mirrored EU restrictions on the use of hazardous substances in electrical and electronic equipment.
 controls on foreign investment • Indonesia – 40% cap on ownership of any")
4) controls on foreign investment • Indonesia – 40% cap on ownership of any domestic commercial banks – foreign mining investors to reduce ownership to 49% within 10 years, starting from the 6° year of commencement of production. • Argentina – 15% cap on foreigners' ownership of productive rural land + 30% foreigners of the same nationality (2011) – expropriation of 51% of Repsol shares in YPF (2012) • India – shelved legislation to open its retail sector to foreign companies, and in early 2012, a finance bill was proposed to allow India to retroactively tax the sale of Indian assets by non-Indian entities as far back as 1962, in an attempt to shore up tax revenues.

Is the EU naif? • public-procurement market accounts for 15 -20% of GDP • some 40 countries have signed up to the governmentprocurement agreement (GPA) to open public contracts. – About € 350 billion of EU contracts are open to foreign bidders – twice as much as in America and 13 times as much as in Japan – China is not a signatory, despite years of negotiations. • EC ideas – exclude tenders that contain more than 50% of goods and services from foreign countries not covered by GPA or other accords – allow national governments, municipalities and other bodies (though only with explicit EC support) to reserve contracts above € 5 m to bidders with 50% domestic content.

Doha development round • launched by the World Trade Organisation in 2001 • Multilateral deals mean common standards and lower barriers for all • DDR is dead in all but name • the cause of liberalisation is being advanced by RTAs – from around 70 in 1990 to over 300 today. – China-ASEAN Free-Trade Area (30% of the world's population in 2010) + Colombia and Peru w/EU, US, KR latest, EU-Singapore, announced on December 16 th. – Bigger deals are on the horizon • between EU and US (could be struck in 2013) and Japan (2014? ) • Trans-Pacific Partnership between US and Pacific countries (2013)

East Asian countries are likely to emerge as the largest trading bloc by 2015

Southern Multinationals? Emerging firms are superseding companies from established countries Source: Fortune magazine; A. T. Kearney analysis

An increase in deals between developing and developed countries Source: Dealogic; A. T. Kearney analysis

Southern Multinationals? Firms from both developed and developing countries target the same industries Source: Dealogic; A. T. Kearney analysis
 Home Country 1980")
Table 2: Outward FDI, Top 20 Emerging Economies, 1980 -2006 (US$Millions) Home Country 1980 1990 2006 Rank (2006) South Africa 5 541 15 004 32 333 43 499 1 Argentina 5 970 6 057 19 276 24 047 Brazil 38 545 41 044 51 946 87 049 3 6 Chile 885 1 149 11 154 26 787 4 13 Colombia 136 402 2 989 9 960 5 20 Venezuela 23 1 221 7 676 11 559 6 19 Mexico 1 632 2 672 8 273 35 144 7 11 Panama 730 3 876 10 507 21 176 8 15 British Virgin Islands . . 875 67 132 123 512 9 3 Cayman Islands 72 648 20 788 40 395 10 10 - 2 14 1 938 11 830 11 18 China . . 4 455 27 768 73 330 12 7 Hong Kong 148 11 920 388 380 688 974 13 1 Korea 127 2 301 26 833 46 760 14 8 Taiwan 13 009 30 356 66 655 113 910 15 5 India 78 124 1 859 12 964 16 17 Indonesia 6 86 6 940 17 350 17 16 Malaysia 305 753 15 878 27 830 18 12 Singapore 623 7 808 56 766 117 580 19 4 - - 20 141 156 824 20 2 United Arab Emirates Russia 9 14

Source: OECD, June 2009 Southern Multinationals?
 spreads Jan 2007 – Feb 2009")
Surging corporate bond spreads Emerging-market corporate bond (CEMBI) spreads Jan 2007 – Feb 2009 Southern Multinationals? Basis points Source: JPMorgan

Policy implications What consequences for OECD countries? • More competition in developing countries (e. g. , resources in Africa) : Southern FDI as an alternative to MNCs from the North ? • A subtle game: OECD MNCs maintain complex and multi -level relations (e. g. Chevron-CNOOC, competing for Unocal, cooperating elsewhere) • FDI promotion: pro-active policies to attract FDI from emerging economies • As in the case of developing countries, issues related to impact have to be considered.
 du total mondial chercheur (millier scientifiques de")
Chercheurs, en % DIRD par Publications (milliers) du total mondial chercheur (millier scientifiques de dollars Ppa) 2002 2009 2002 2007 Croissanc % total e 2002/08 mondiale 2007 Brésil 72 125* 1, 2 1, 7 181 162 110, 6 2, 7 Russie 492 442 8, 5 6, 5 32 50 6, 2 2, 7 Inde 116 155* 2, 3 2, 2 103 127 91, 7 3, 7 Chine 811 1152 13, 9 19, 7 48 72 174, 7 10, 6 BRIC 1490 1844 25, 9 30, 1 91 103 95, 8 19, 7 OCDE 3588 4200 61, 7 57, 6 184 216 22, 3 76, 4

Brazil • in 1906, Alberto Santos Dumont claimed to have built the world’s first practical airplane following the Wright Brothers demonstration • Research workforce capacity and investment are expanding rapidly, offering many new possibilities in a diversifying research portfolio • Relative to the rest of the world, has exceptional capacity in biologybased disciplines (40% of the world’s bio-ethanol) and research related to natural resources • main international partners are led by G 7 economies. It also has growing links with Portugal, and appears to be a key player in an emerging regional network. • produces over 500 k new graduates and about 10 k Ph. D researchers each year, a similar number to FR and KR (10 -fold increase in 20 yrs)

Russia • The old Soviet Union was a scientific force to be reckoned with. The 1957 launch of the Sputnik satelliterally changed the practice of world science, spurring not only the “space race” with the United States but a new global era of government investment in science and technology • budgets for science and technology have been sharply reduced (budgets for research amounting to 3 -5% of comparably sized institutes in the United States) • Russian scientists are aging • serious “brain drain” dates from the early 1990 s • decline in the prestige of science as a profession

India • The tradition of science in India extends back millennia, with Aryabhatta, Bhaskara, Brahmagupta, and others still celebrated for their foundational contributions to the fields of mathematics, astronomy, and chemistry. • notable scientific successes via government directives such as the Scientific Policy Resolution (1958), the Technology Policy Statement (1983), and Science and Technology Policy (2003) • government spending on science research currently accounts for roughly 0. 9% of GDP; by 2012, the figure is expected to rise to 1. 2% • availability of qualified researchers has not kept pace with the increased funding • “brain drain” “talent circulation” return of expatriate researchers

China • more than half of the nation’s technologies, including atomic energy, space science, high-energy physics, biology, computer science, and information technology, have reached or are close to a recognizable international level of achievement – successful launch in October 2003 of the “Shenzhou V” manned spacecraft made China the third country to master manned spaceflight technology. – The ‘Moon Probe’ project started in February 2004 forecasts that China will soon launch unmanned probes to the moon and is targeted to gather moon soil samples before 2020. • state programs for science and technology (Key Technologies Research and Development Program, 863 Program, 973 Program) • now ranks third worldwide in volume of Gross Expenditure on R&D • current number of university students studying has reached 25 million, a five-fold increase in only nine years

Global knowledge challenges • Knowledge as an essential input as problem solving tool for global challenges ranging from agriculture, health, to energy saving, climate change to migration • Education very differentiated in terms of bilateral international relations (Bologna agreement spread to 36 countries) • Technology/innovation (local competitiveness: Lisbon logic: strong internal focus employment, increased tradability of technology output (licences, firms’ driven, etc. ) • Different public-private involvement with on the public side a national tax payer obsessions (geographically bounded) • Rapidly growing different costs factors: researchers’ costs in China (10 to 20% of US/Europe) as opposed to manufacturing (30%) • Different mobility factors: researchers/highly skilled much more mobile.
 2009")
EU 27 Innovation Lead vis-à-vis BRIC Countries European Innovation Scoreboard (EIS) 2009

EU 27 -BRIC comparison • although the lead of the EU 27 towards each of the BRIC countries is still significant, there are signs that IN and in particular CN are closing their gap – BR is outperforming in ICT expenditures and Knowledgeintensive services exports – CN is outperforming in ICT expenditures and High-tech exports – IN is outperforming in ICT expenditures and Knowledgeintensive services exports – RU is outperforming in Tertiary education and Researchers

CO 2 emissions

N-11
 2000")
The world in 2000 and in 2040 (Shares of world GDP at PPP) 2000 2040* United States 22 14 14 EU-15/27 21 6 12 China 11 40 26 Others 46 41 50 * Goldman Sachs Source: Robert Fogel (2009)

Expected average annual growth rates over next 50 years Source: Goldman Sachs

Largest Economies in 2005

The Largest Economies in 2050

Labor Force 87

Working Age Peaks Later Than in Developed World 88
 Country or area 2009 Percentage of")
Population aged 60 years or over Number (million) Country or area 2009 Percentage of total population 2050 2009 2050 Share of persons 80 years or over 2009 2050 World 737 2 008 11 22 14 20 More developed regions 264 416 21 33 20 29 Less developed regions 473 1 592 8 20 11 17 Brazil 19 64 10 29 14 22 Russia 25 37 18 32 16 19 India 89 316 7 20 9 13 China 160 440 12 31 12 23 16 22 26 39 22 34 Italy UN-DESA, Population Division
- Slides: 89