
Global Warming Climate Change Is the science settled
Global Warming & Climate Change: Is the science settled? Madhav L. Khandekar Environmental Consultant Unionville ON Canada
Synopsis • Basic Definitions and Overview of Science • Media Hype on Global Warming & Impact • Observed Warming over various regions • Impact of Urbanization/Land-use Change • Solar Variability & Earth’s Climate • Global Warming & Extreme Weather • Summary & Concluding Remarks
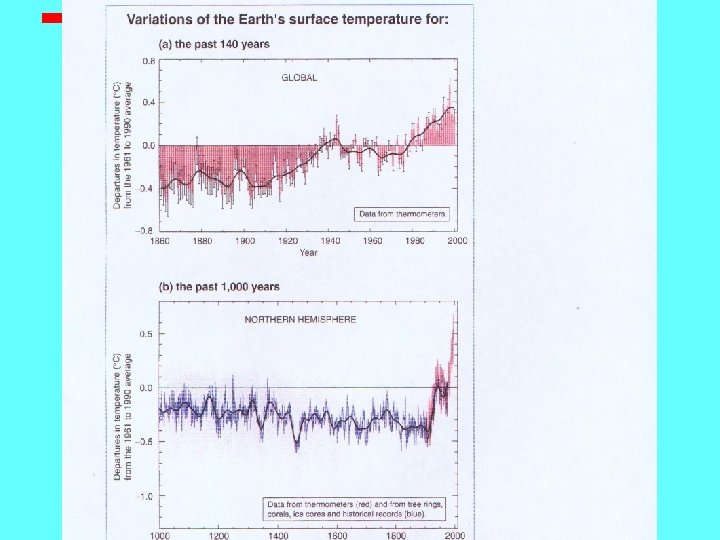
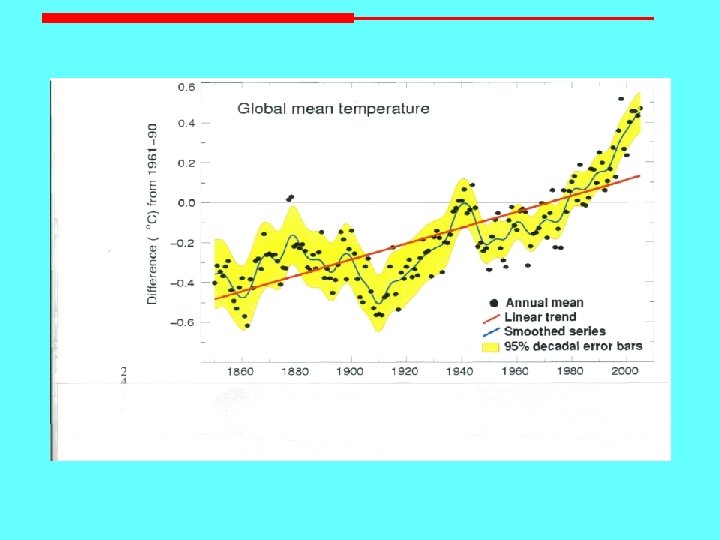
Basic Definitions & Facts • Global warming is the warming of the earth’s surface ( and the atmosphere above it) due to increasing concentration of Greenhouse Gases( GHG) as a result of increasing human activity world-wide • Climate change refers to a change ( gradual or abrupt) in the average weather experienced at a location or over a region. • Based on a careful analysis of observed data, it is estimated that the earth’s surface has warmed by about 0. 6 C in the mean over the last 150 years. • Atmospheric concentration of GHG-Carbon Dioxide, Methane, Nitrous Oxide, have increased rapidly in the last 25 years.
Prevailing Hypothesis & Uncertainties Hypothesis • The present Earth surface warming is intimately linked to increasing Greenhouse gasses (GHG) of the atmosphere • This warming will continue in future leading to increased incidences of extreme weather events worldwide Uncertainties • Link between surface warming and GHG is not unequivocal at this time. Impact of other processes like urbanization, solar variability, large-scale circulation changes etc. has not been fully taken into account. • Link between warming and extreme weather events is tenuous at best.
Global Warming: Historical Notes • French Mathematician Joseph Fourier first put forward the concept that the Earth acts like a greenhouse (1827) • Swedish Scientist Arrhenius estimated how changes in global concentrations of carbonic acid might affect mean global surface temperature(1896) • Arrhenius estimated that increase in CO 2 concentration by a factor of two would increase Earth’s mean temperature 5/6 C • American Geologist Chamberlin studied processes of CO 2 emissions into atmosphere from volcanic eruptions, absorption and outgassing of CO 2 into and out of world’s oceans (1899) • Work of Arrhenius and Chamberlin did not receive support since absorption of long wave radiation by water vapour was considered too strong. • British Engineer Callender showed that CO 2 has important absorption bands outside of water vapour bands(1938/1940)
Global Warming: Historical Notes Contd. . • American Geophysicist Roger Revelle proposed “humans are carrying out a large scale geophysical experiment through world-wide industrial activity which could lead to build of CO 2 greater than the rate of CO 2 production from volcanoes • CO 2 monitoring stations were established in Hawaii 1956 and later at South Pole. Some Numbers to consider…. Since (~ 1750), CO 2 concentration has increased by 31%. Other Greenhouse gasses: Methane (CH 4) 151% increase Nitrous Oxide(N 2 O) 17% increase Direct Radiative forcing of greenhouse gasses: CO 2: 1. 46 W/m 2 CH 4: 0. 48 W/m 2 N 2 O: 0. 15 W/m 2 Solar radiation at top of atmosphere: 343 W/m 2 Radiative forcing under average cloudy skies: -18 W/m 2 Total Solar Irradiance (TSI) at the top of atmosphere has longterm variations of less than 1%, however this small change can influence earth’s climate.

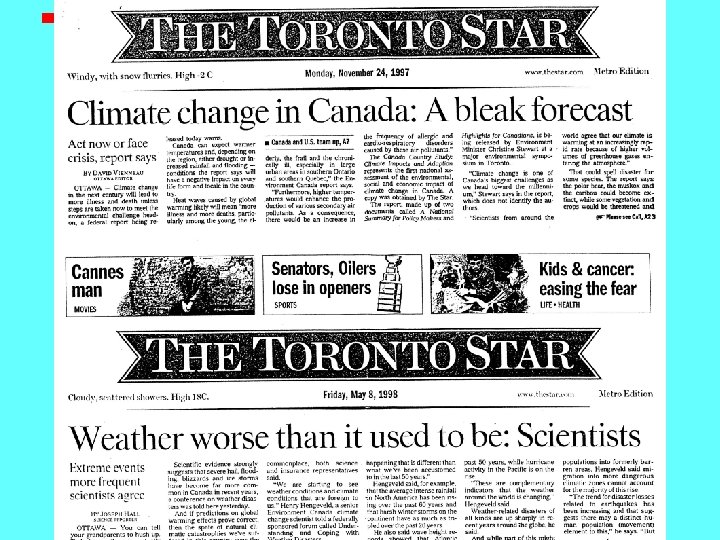
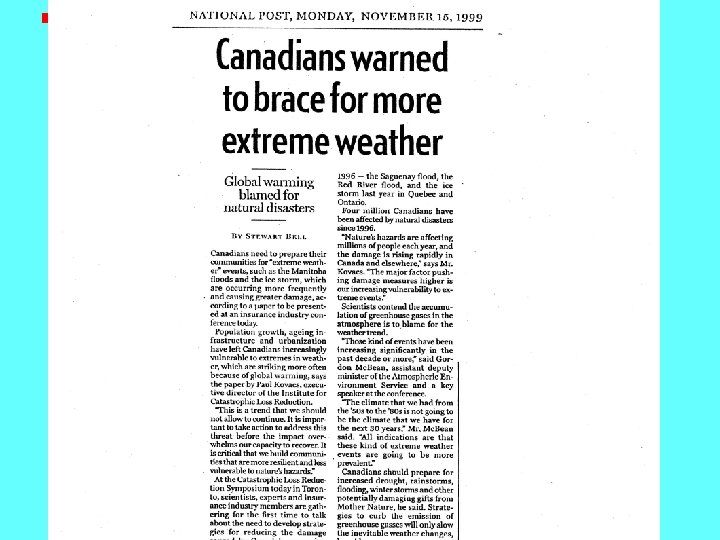
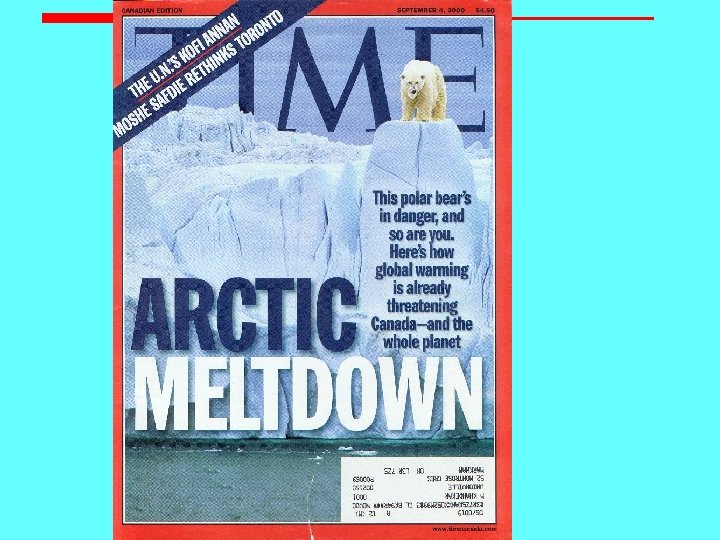
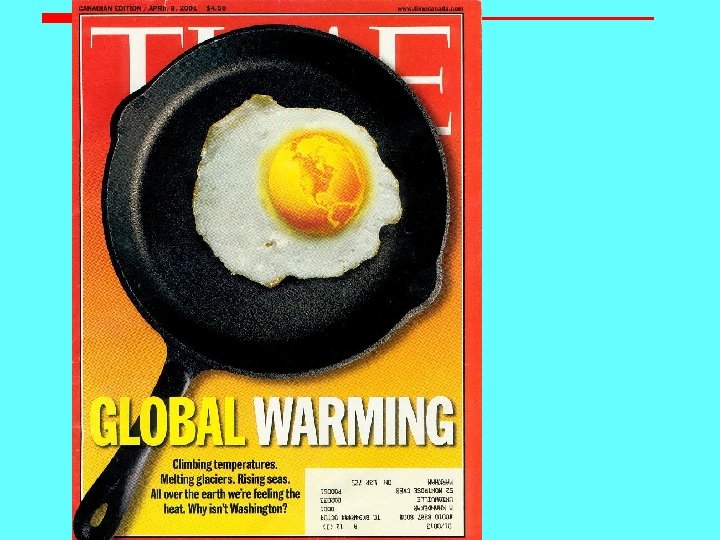
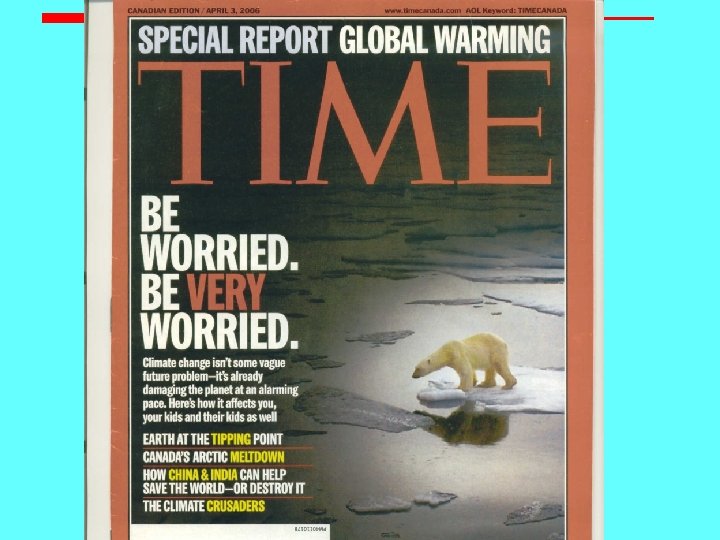
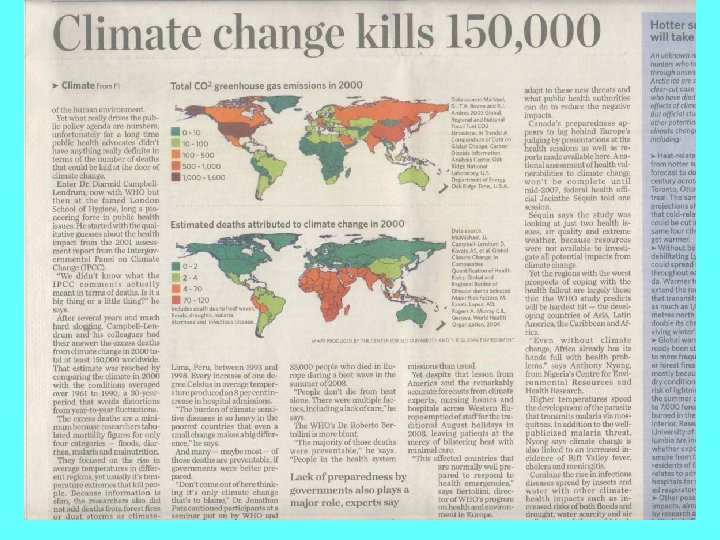
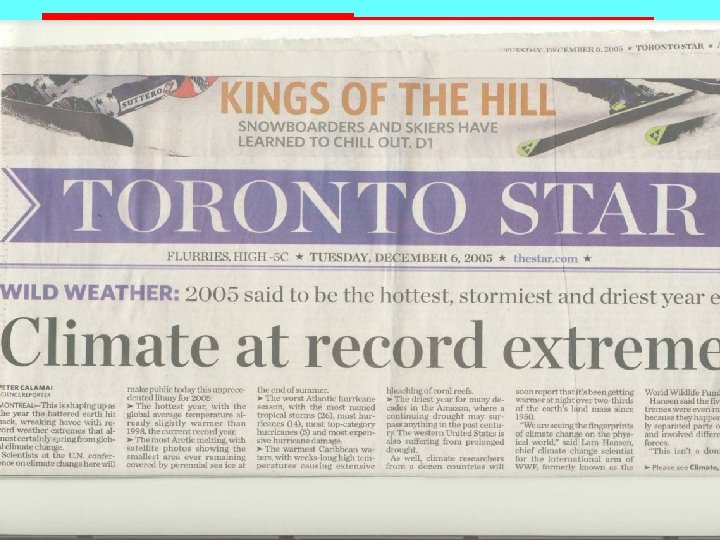
Media Hype about global warming & Impacts
Observed Warming of the Earth’s Surface
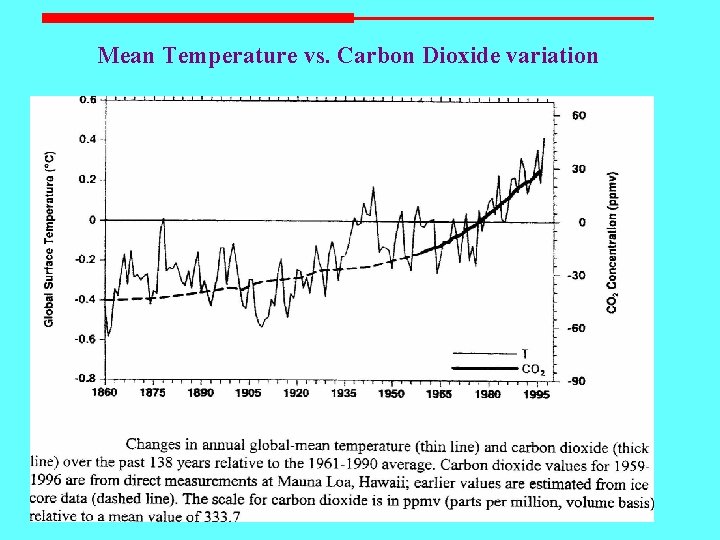
Mean Temperature vs. Carbon Dioxide variation
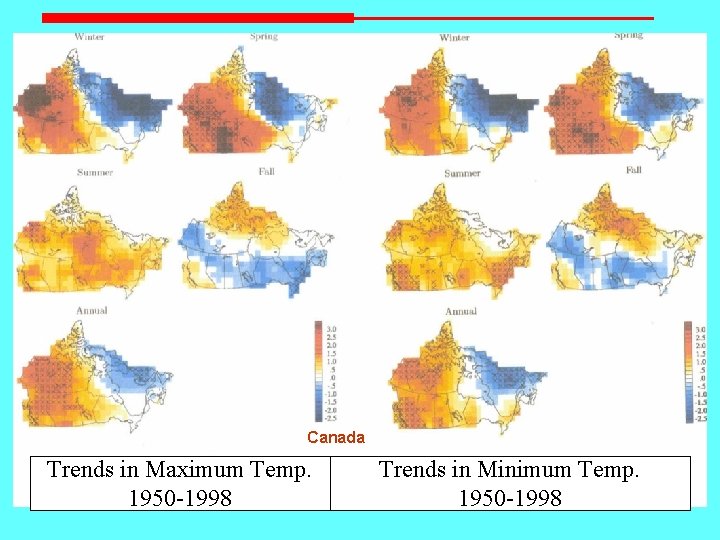
Canada Trends in Maximum Temp. 1950 -1998 Trends in Minimum Temp. 1950 -1998
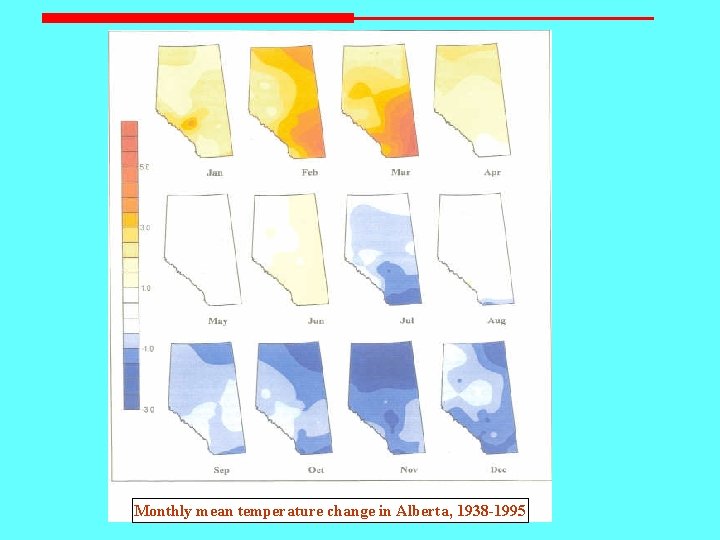
Monthly mean temperature change in Alberta, 1938 -1995
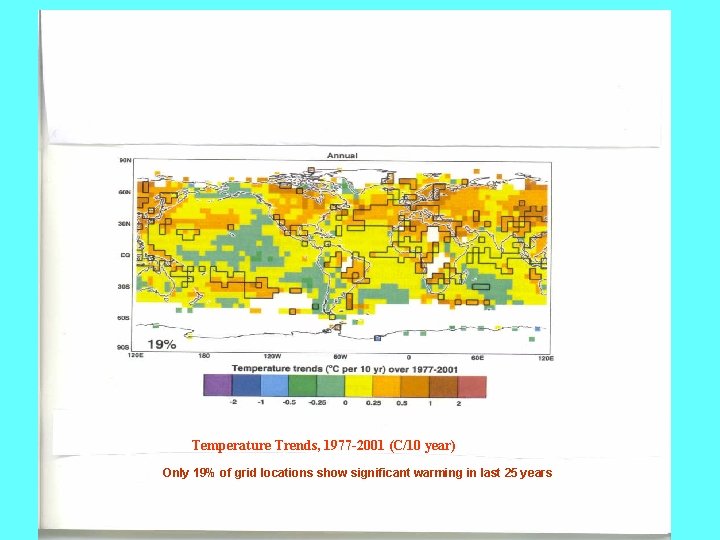
Temperature Trends, 1977 -2001 (C/10 year) Only 19% of grid locations show significant warming in last 25 years
Impact of other processes on surface temperature trends 1. Urbanization & land-use change 2. Solar variability & changes in cloud cover 3. Large-scale circulation changes Also industrial aerosols (e. g. , sulfates) and volcanic ash influence earth’s mean temperature
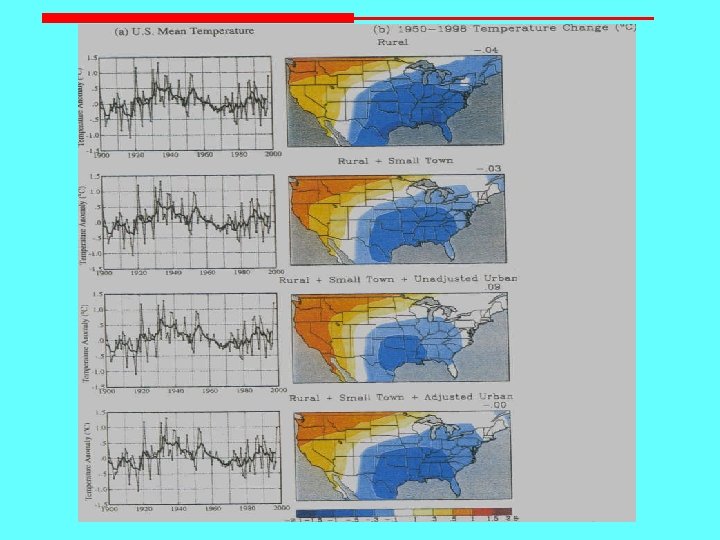
Urbanization & Land-use Change • IPCC (2001) obtains urbanization impact of ~0. 06 C over 100 years. This value appears too small when compared to individual stations which show urbanization (heat island) impact of up to 10 C • Urbanization/Land-use change impact shows up for stations with long data and is estimated at 0. 5 C to 1. 0 C over 100 years for many locations • Kalnay & Cai study (2003) obtains value for urbanization impact of ~0. 27 C over 20 th century and ~0. 18 C for recent 25 -year period.
Urbanization & Land-use Change (Contd. . ) • Pielke et al study (2002) suggests landuse change and landscape dynamics providing climate forcing which may overwhelm GHG forcing in future. • Removing urbanization impact will reduce the present warming to just about 0. 2 C in 25/30 years, which is only modest and not of major concern.
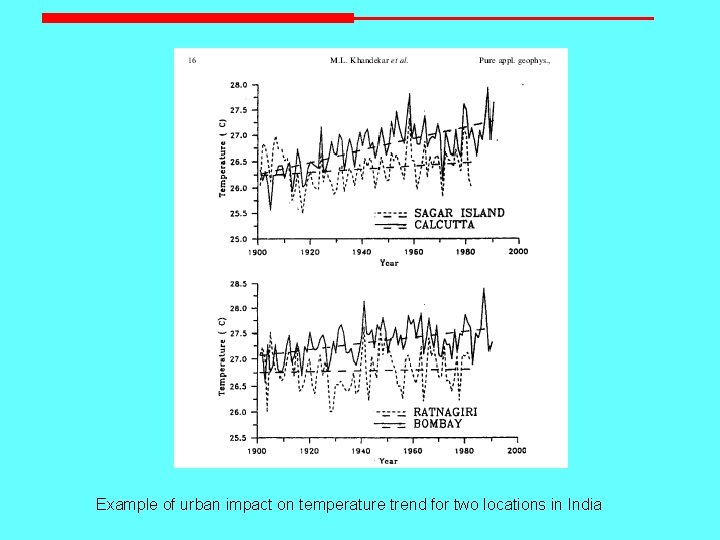
Example of urban impact on temperature trend for two locations in India
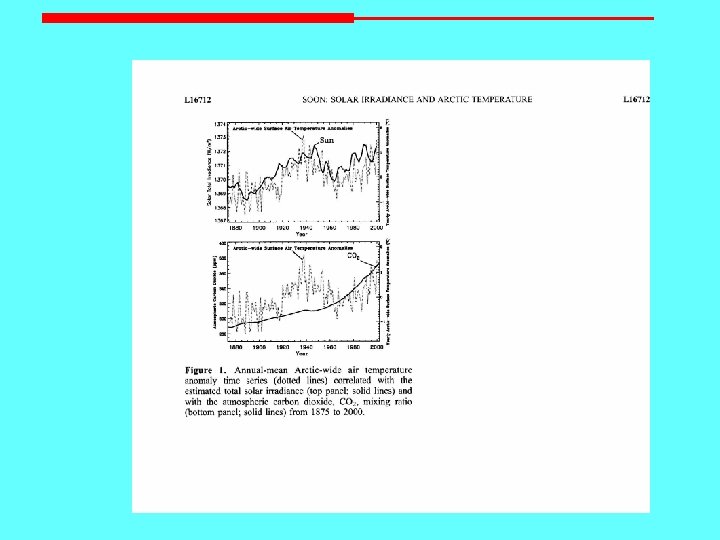
Solar Variability & Earth’s Climate • Sunspot cycles and relation to weather elements like rain have been studied extensively for many years. Regional rainfall variations & drought cycles appear to be strongly correlated to sunspot cycles of 11 or 22 years (Currie, 1990) • In recent years, solar variability is being linked to climate and to mean temp. changes, through cloud cover changes (Hoyt 1993: Lean 1998: Svensmark 1997) • More recent studies (Soon 2005, Weng 2005) link solar variability to Arctic Surface Temp. and to Global & N. Pacific sea-surface temperature.
Solar Variability & Earth’s Climate • Almost half of twentieth century warming can be explained by solar forcing, esp. in the early part of the century. • Solar variability and associated cosmic ray flux can influence earth’s cloud cover and earth’s mean surface temperature. • Arctic surface temperature, 1875 -2000 is strongly correlated with total solar irradiance • Droughts on the Canadian Prairies during Dust Bowl years of 1930 s as well as recent droughts (1999 -2001) may have been influenced by solar variability
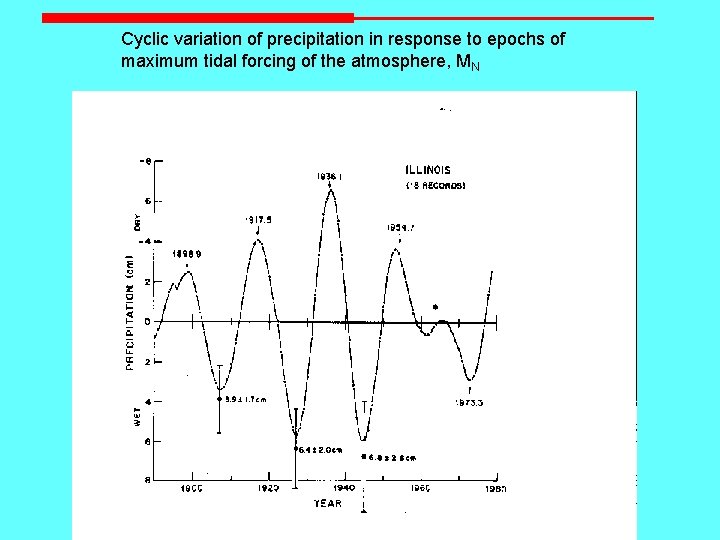
Cyclic variation of precipitation in response to epochs of maximum tidal forcing of the atmosphere, MN
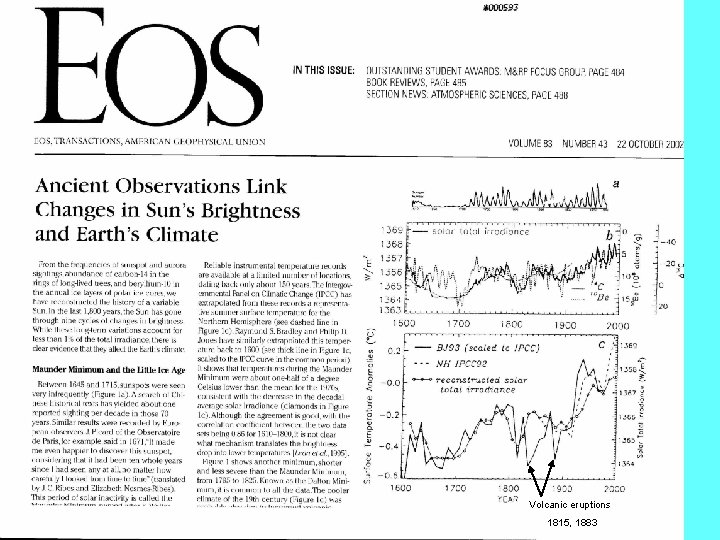
Volcanic eruptions 1815, 1883
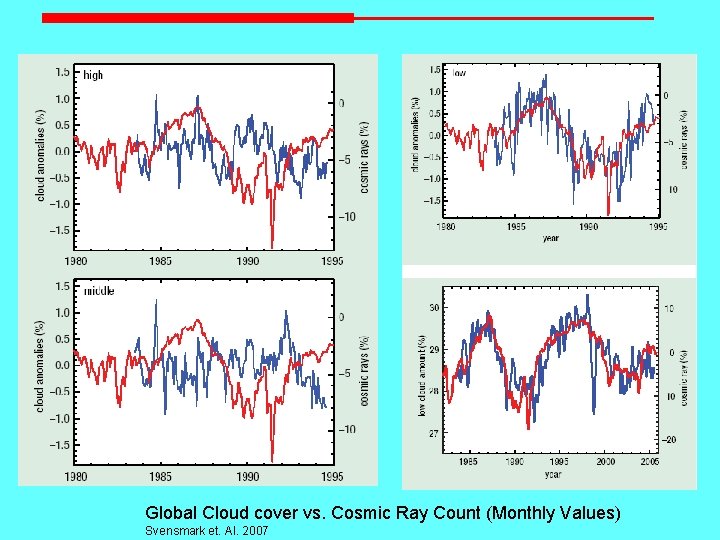
Global Cloud cover vs. Cosmic Ray Count (Monthly Values) Svensmark et. Al. 2007
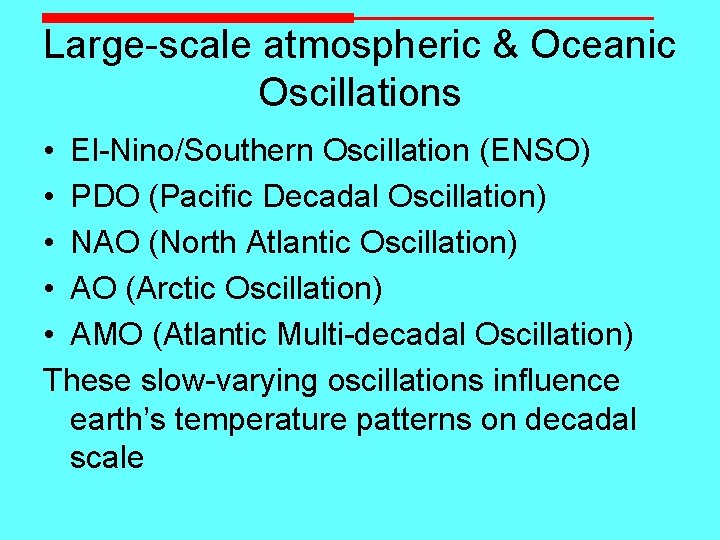
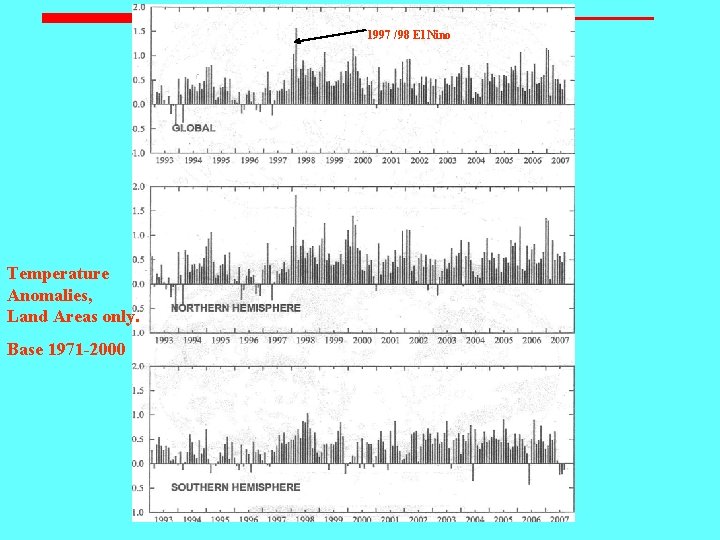
Large-scale atmospheric & Oceanic Oscillations • El-Nino/Southern Oscillation (ENSO) • PDO (Pacific Decadal Oscillation) • NAO (North Atlantic Oscillation) • AO (Arctic Oscillation) • AMO (Atlantic Multi-decadal Oscillation) These slow-varying oscillations influence earth’s temperature patterns on decadal scale
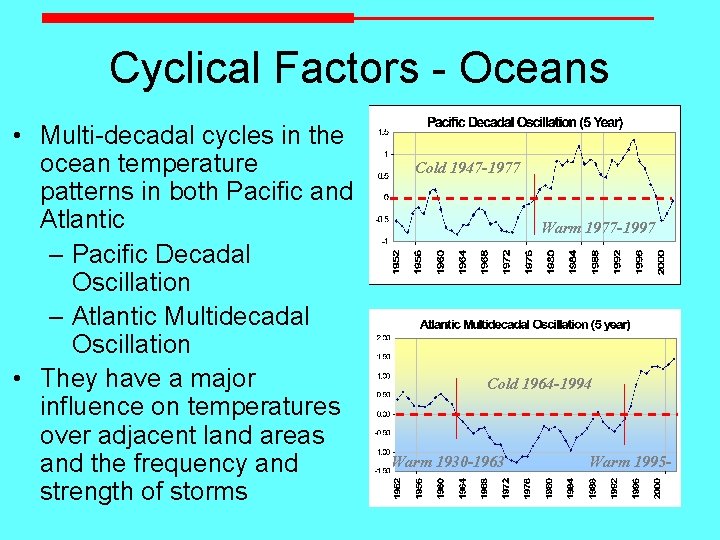
Cyclical Factors - Oceans • Multi-decadal cycles in the ocean temperature patterns in both Pacific and Atlantic – Pacific Decadal Oscillation – Atlantic Multidecadal Oscillation • They have a major influence on temperatures over adjacent land areas and the frequency and strength of storms Cold 1947 -1977 Warm 1977 -1997 Cold 1964 -1994 Warm 1930 -1963 Warm 1995 -
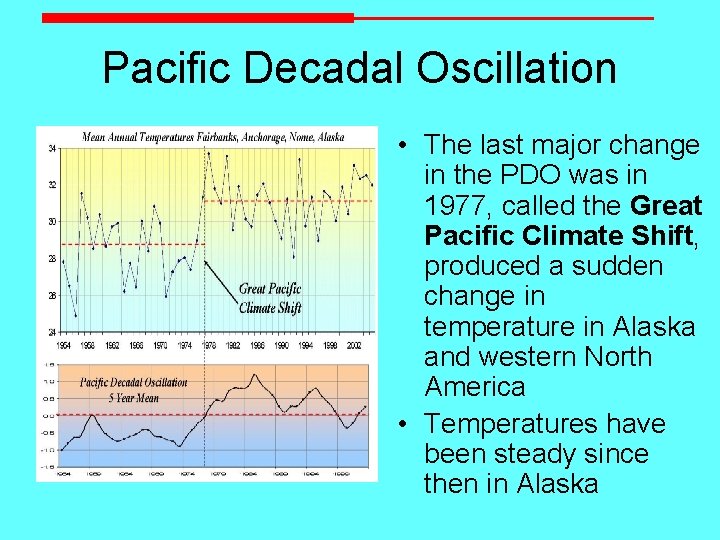
Pacific Decadal Oscillation • The last major change in the PDO was in 1977, called the Great Pacific Climate Shift, produced a sudden change in temperature in Alaska and western North America • Temperatures have been steady since then in Alaska
1997 /98 El Nino Temperature Anomalies, Land Areas only. Base 1971 -2000
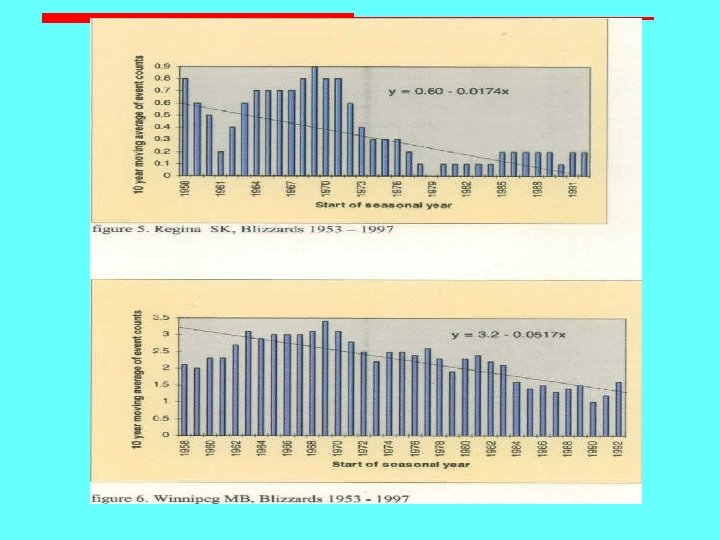
Trends and changes in extreme weather events in Canada
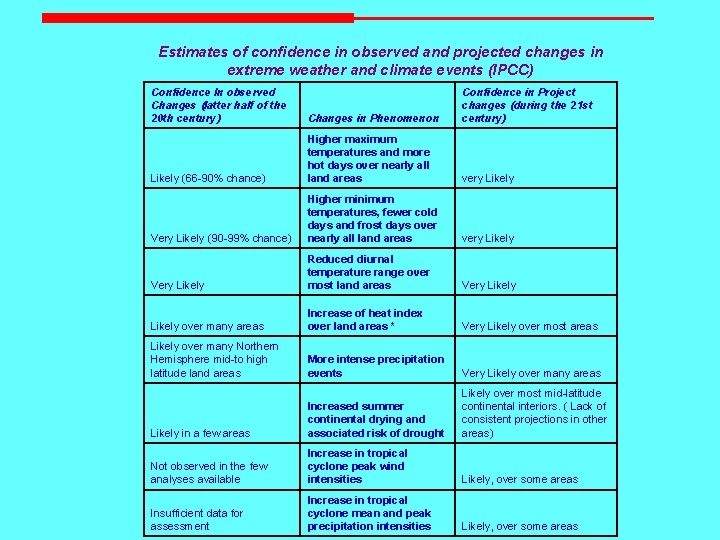
Estimates of confidence in observed and projected changes in extreme weather and climate events (IPCC) Confidence In observed Changes (latter half of the 20 th century) Changes in Phenomenon Confidence in Project changes (during the 21 st century) Likely (66 -90% chance) Higher maximum temperatures and more hot days over nearly all land areas very Likely Very Likely (90 -99% chance) Higher minimum temperatures, fewer cold days and frost days over nearly all land areas very Likely Very Likely Reduced diurnal temperature range over most land areas Very Likely over many areas Increase of heat index over land areas * Very Likely over most areas Likely over many Northern Hemisphere mid-to high latitude land areas More intense precipitation events Very Likely over many areas Likely in a few areas Increased summer continental drying and associated risk of drought Likely over most mid-latitude continental interiors. ( Lack of consistent projections in other areas) Not observed in the few analyses available Increase in tropical cyclone peak wind intensities Likely, over some areas Insufficient data for assessment Increase in tropical cyclone mean and peak precipitation intensities Likely, over some areas
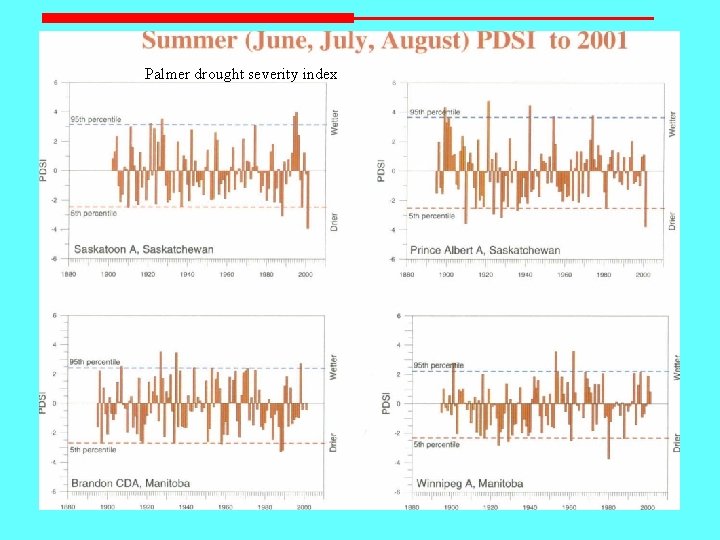
Palmer drought severity index
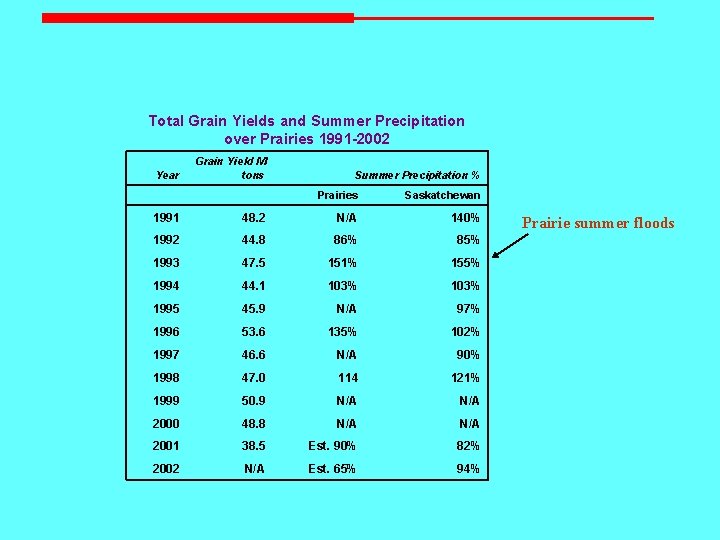
Total Grain Yields and Summer Precipitation over Prairies 1991 -2002 Year Grain Yield M tons Summer Precipitation % Prairies Saskatchewan 1991 48. 2 N/A 140% 1992 44. 8 86% 85% 1993 47. 5 151% 155% 1994 44. 1 103% 1995 45. 9 N/A 97% 1996 53. 6 135% 102% 1997 46. 6 N/A 90% 1998 47. 0 114 121% 1999 50. 9 N/A 2000 48. 8 N/A 2001 38. 5 Est. 90% 82% 2002 N/A Est. 65% 94% Prairie summer floods
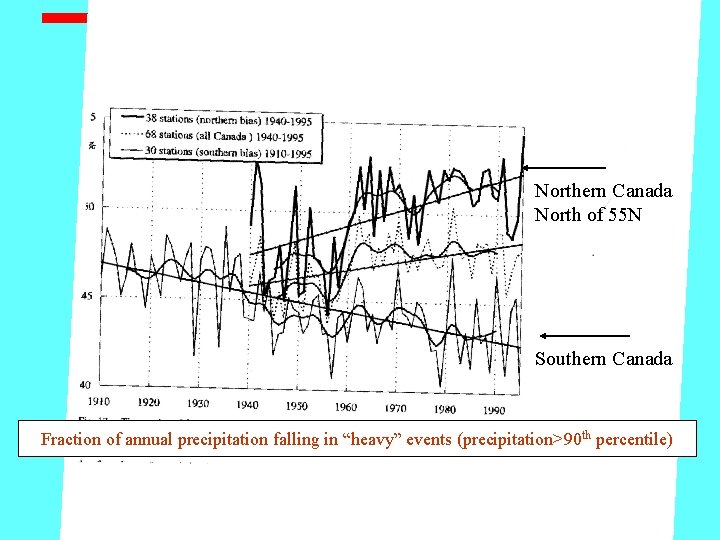
Northern Canada North of 55 N Southern Canada Fraction of annual precipitation falling in “heavy” events (precipitation>90 th percentile)
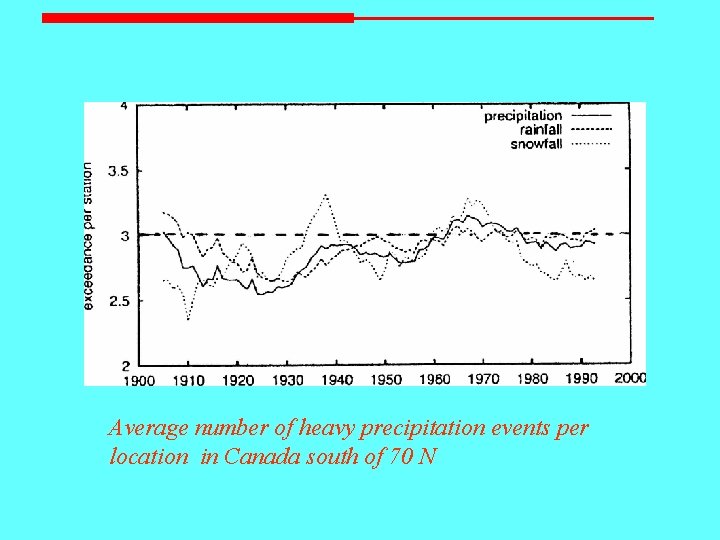
Average number of heavy precipitation events per location in Canada south of 70 N
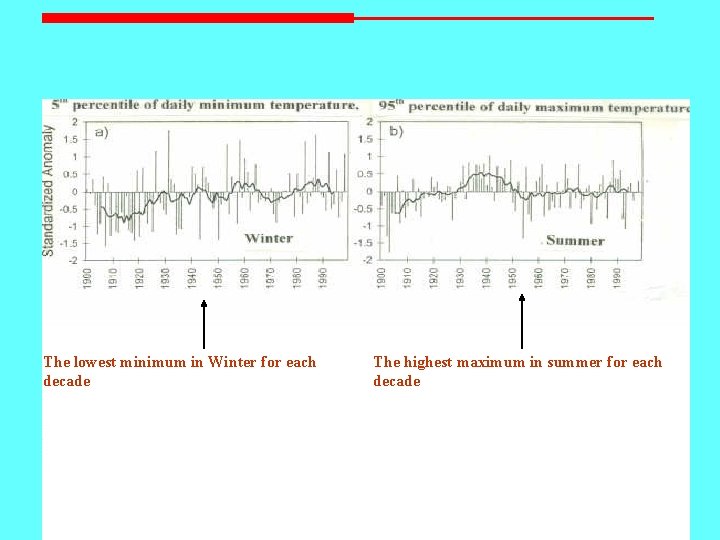
The lowest minimum in Winter for each decade The highest maximum in summer for each decade
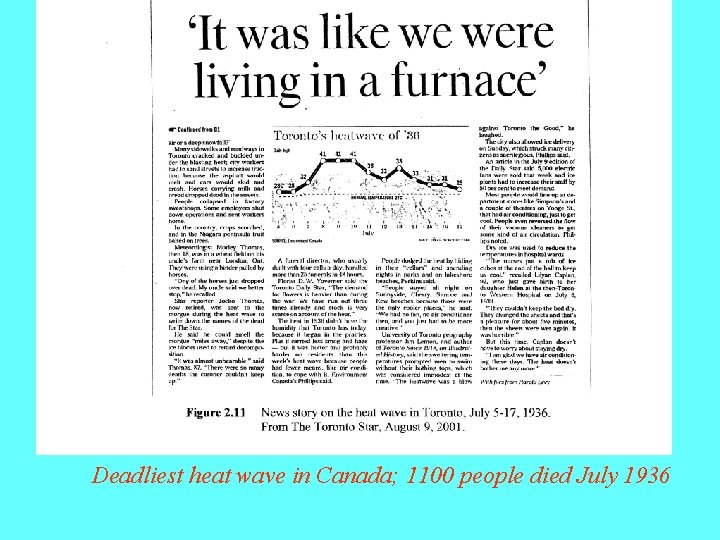
Deadliest heat wave in Canada; 1100 people died July 1936
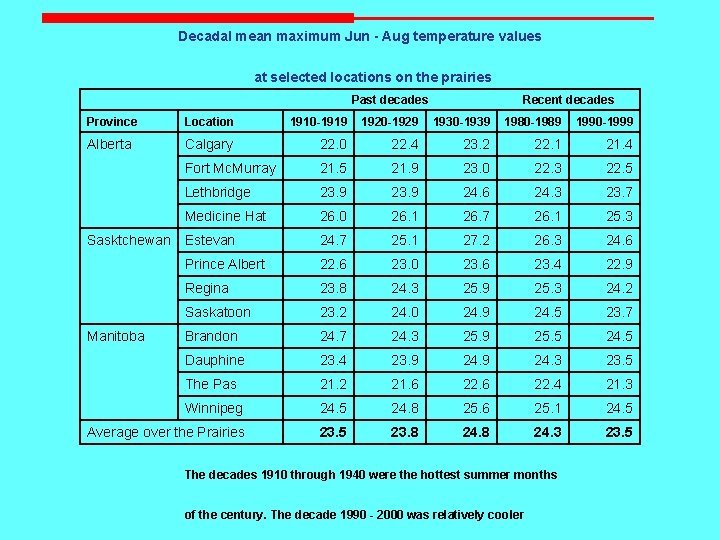
Decadal mean maximum Jun - Aug temperature values at selected locations on the prairies Past decades Recent decades Province Location 1910 -1919 1920 -1929 1930 -1939 1980 -1989 1990 -1999 Alberta Calgary 22. 0 22. 4 23. 2 22. 1 21. 4 Fort Mc. Murray 21. 5 21. 9 23. 0 22. 3 22. 5 Lethbridge 23. 9 24. 6 24. 3 23. 7 Medicine Hat 26. 0 26. 1 26. 7 26. 1 25. 3 Sasktchewan Estevan 24. 7 25. 1 27. 2 26. 3 24. 6 Prince Albert 22. 6 23. 0 23. 6 23. 4 22. 9 Regina 23. 8 24. 3 25. 9 25. 3 24. 2 Saskatoon 23. 2 24. 0 24. 9 24. 5 23. 7 Manitoba Brandon 24. 7 24. 3 25. 9 25. 5 24. 5 Dauphine 23. 4 23. 9 24. 3 23. 5 The Pas 21. 2 21. 6 22. 4 21. 3 Winnipeg 24. 5 24. 8 25. 6 25. 1 24. 5 Average over the Prairies 23. 5 23. 8 24. 3 23. 5 The decades 1910 through 1940 were the hottest summer months of the century. The decade 1990 - 2000 was relatively cooler
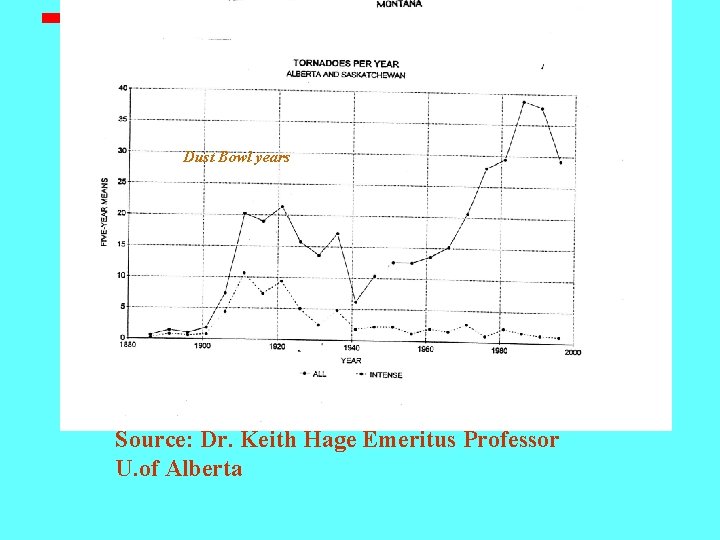
Dust Bowl years Source: Dr. Keith Hage Emeritus Professor U. of Alberta
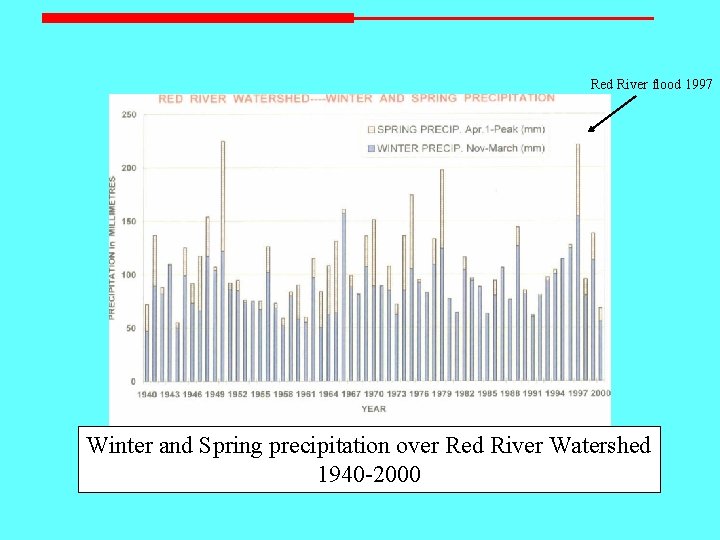
Red River flood 1997 Winter and Spring precipitation over Red River Watershed 1940 -2000
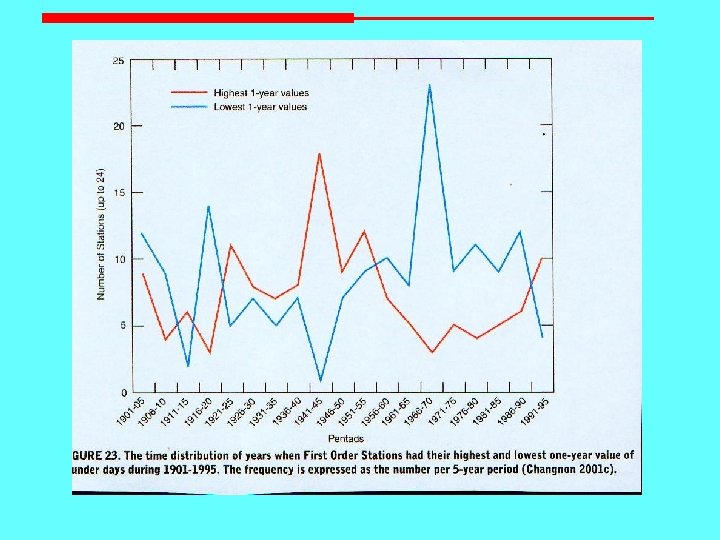
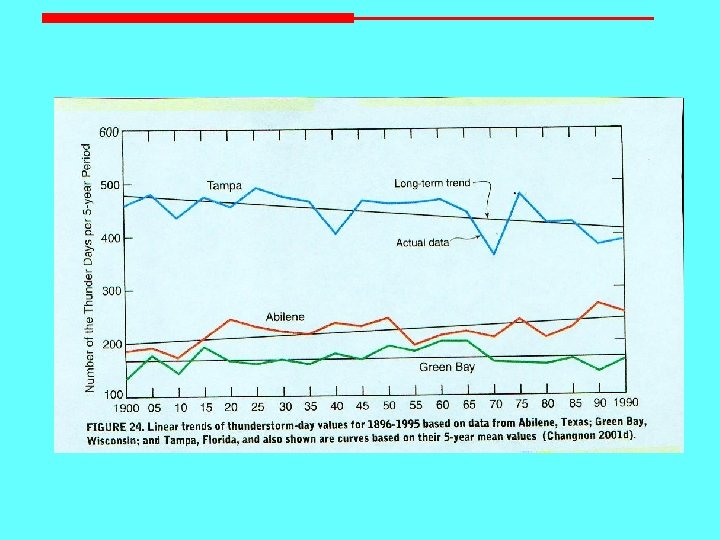
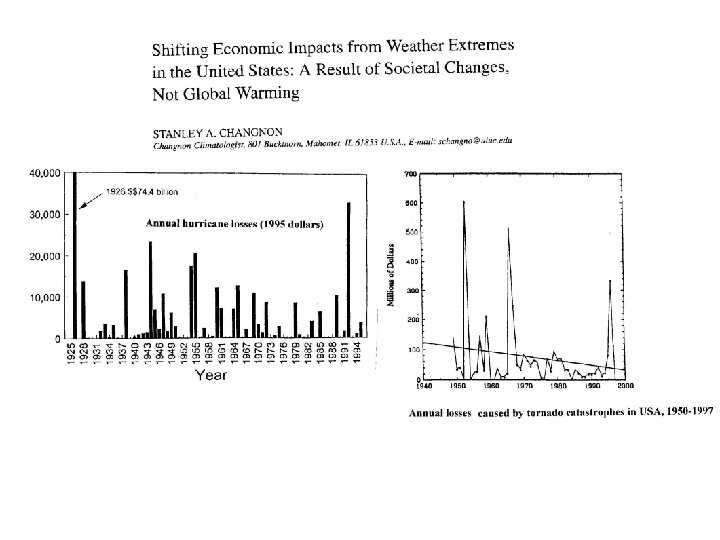
Extreme weather trends over USA
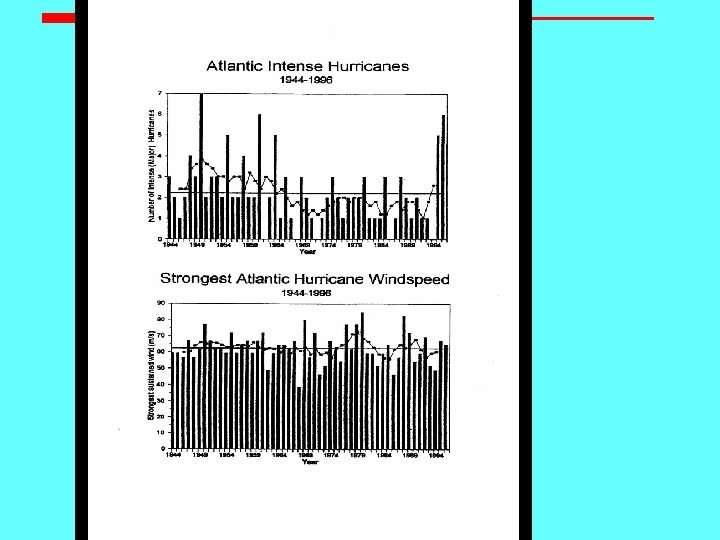
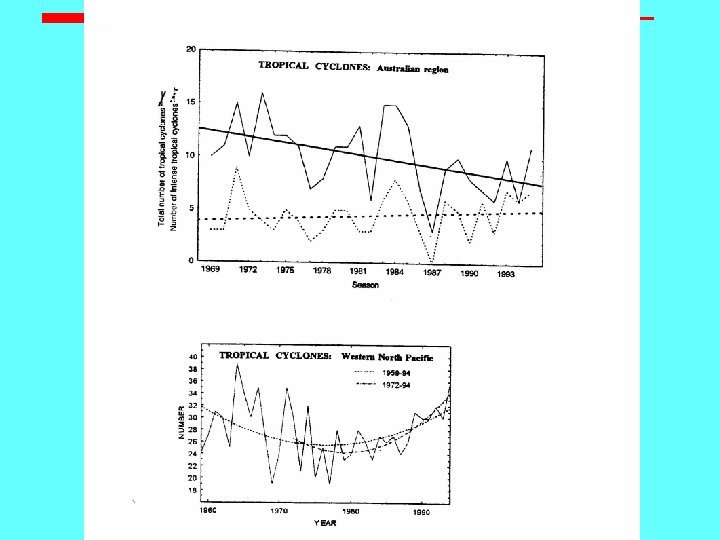
Extreme Weather trends elsewhere
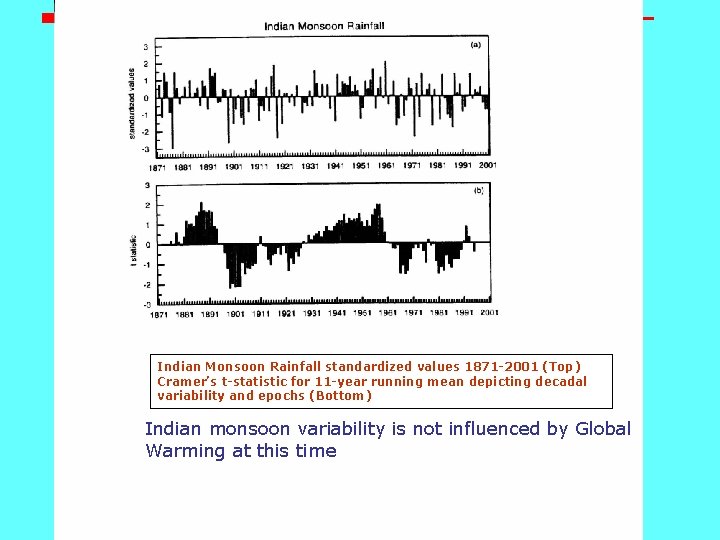
Indian Monsoon Rainfall standardized values 1871 -2001 (Top) Cramer’s t-statistic for 11 -year running mean depicting decadal variability and epochs (Bottom) Indian monsoon variability is not influenced by Global Warming at this time
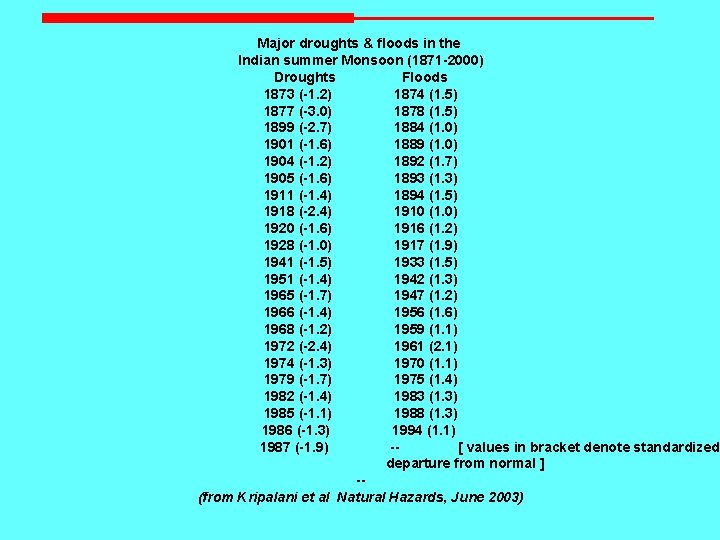
Major droughts & floods in the Indian summer Monsoon (1871 -2000) Droughts Floods 1873 (-1. 2) 1874 (1. 5) 1877 (-3. 0) 1878 (1. 5) 1899 (-2. 7) 1884 (1. 0) 1901 (-1. 6) 1889 (1. 0) 1904 (-1. 2) 1892 (1. 7) 1905 (-1. 6) 1893 (1. 3) 1911 (-1. 4) 1894 (1. 5) 1918 (-2. 4) 1910 (1. 0) 1920 (-1. 6) 1916 (1. 2) 1928 (-1. 0) 1917 (1. 9) 1941 (-1. 5) 1933 (1. 5) 1951 (-1. 4) 1942 (1. 3) 1965 (-1. 7) 1947 (1. 2) 1966 (-1. 4) 1956 (1. 6) 1968 (-1. 2) 1959 (1. 1) 1972 (-2. 4) 1961 (2. 1) 1974 (-1. 3) 1970 (1. 1) 1979 (-1. 7) 1975 (1. 4) 1982 (-1. 4) 1983 (1. 3) 1985 (-1. 1) 1988 (1. 3) 1986 (-1. 3) 1994 (1. 1) 1987 (-1. 9) -- [ values in bracket denote standardized departure from normal ] -(from Kripalani et al Natural Hazards, June 2003)
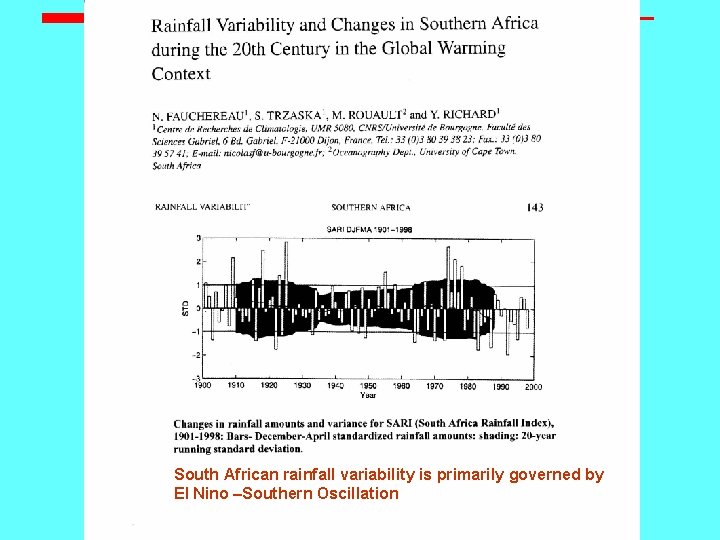
South African rainfall variability is primarily governed by El Nino –Southern Oscillation
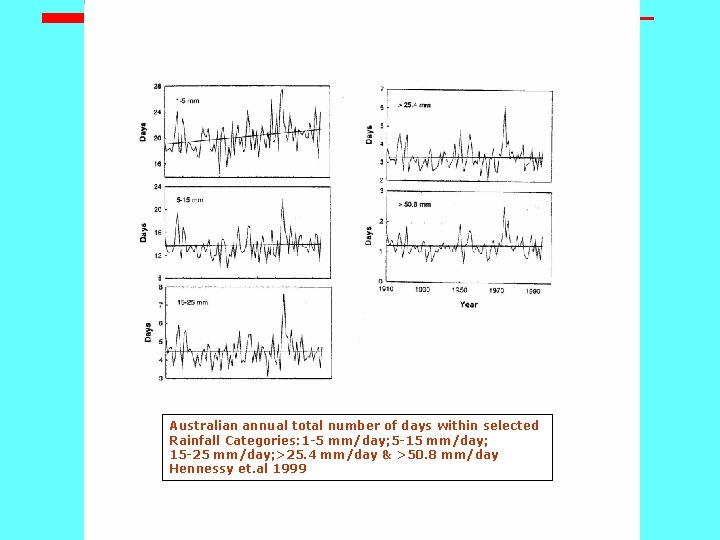
Australian annual total number of days within selected Rainfall Categories: 1 -5 mm/day; 5 -15 mm/day; 15 -25 mm/day; >25. 4 mm/day & >50. 8 mm/day Hennessy et. al 1999
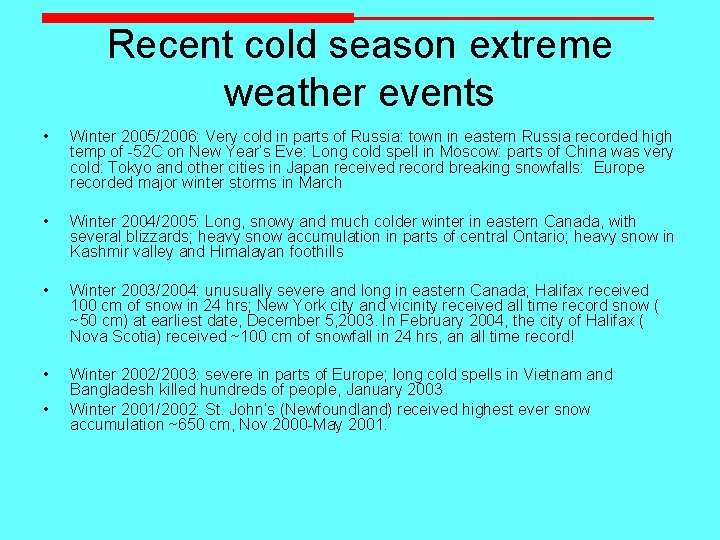
Recent cold season extreme weather events • Winter 2005/2006: Very cold in parts of Russia: town in eastern Russia recorded high temp of -52 C on New Year’s Eve: Long cold spell in Moscow: parts of China was very cold: Tokyo and other cities in Japan received record breaking snowfalls: Europe recorded major winter storms in March • Winter 2004/2005: Long, snowy and much colder winter in eastern Canada, with several blizzards; heavy snow accumulation in parts of central Ontario; heavy snow in Kashmir valley and Himalayan foothills • Winter 2003/2004: unusually severe and long in eastern Canada; Halifax received 100 cm of snow in 24 hrs; New York city and vicinity received all time record snow ( ~50 cm) at earliest date, December 5, 2003. In February 2004, the city of Halifax ( Nova Scotia) received ~100 cm of snowfall in 24 hrs, an all time record! • Winter 2002/2003: severe in parts of Europe; long cold spells in Vietnam and Bangladesh killed hundreds of people, January 2003 Winter 2001/2002: St. John’s (Newfoundland) received highest ever snow accumulation ~650 cm, Nov. 2000 -May 2001. •
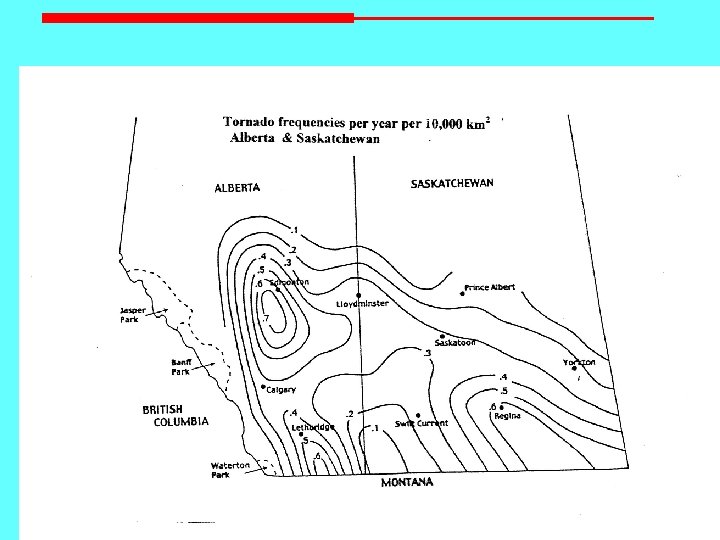
Summary • • • Recent increase in earth’s mean surface temperature appears to be primarily due to human activity on ground (urbanization etc. ) and NOT due to increased concentration of carbon dioxide in the atmosphere. Solar variability and large-scale atmospheric circulation changes may also have contributed to the earth’s mean temperature change. The recent warming of the Arctic Basin appears to be in response to change in the PDO (Pacific Decadal Oscillation). • Heat waves and summer maximum temperatures are not increasing in Canada, USA or elsewhere at present. • Intense precipitation events show increasing trends over USA but not over Canada. Elsewhere, trends are mixed. Natural climate variability, increased sea surface temperatures and local/regional influences are considered as possible causes. • Thunderstorms/tornadoes have declined over North America in recent years, compared to the Dust Bowl years of the 1920 s and 1930 s. • Indian/Asian Monsoon is governed primarily by large-scale features and not influenced by global warming at present. • World-wide tropical cyclone variability and intensity does not appear to be influenced by global warming at this time.
Conclusions • The present warming appears to be modest and there is no evidence of catastrophic warming in the next ten to twenty-five years. • Extreme weather events as identified by IPCC are not increasing anywhere in North America or elsewhere at this point in time. Interestingly, cold season extreme weather events appear to be on the increase in last five years, for which neither IPCC nor climate models have any explanation. Climate model projections of next 100 years have very little reliability. • The present climate change appears to be part of natural climate variability and does not appear to be driven by human activity and in particular by increasing concentration of Carbon Dioxide
- Slides: 63