Global Status of Crowdfunding Latin Americas Position within

Global Status of Crowdfunding & Latin America’s Position within the Landscape: Insights from the Cambridge Reports 8 April 2019 Tania Ziegler, Cambridge University Centre for Alternative Finance, UK

The Global Alternative Finance Platform Indicator Analysis of Online Channels of Finance Outside of the Banking System • Taxonomy of alternative finance: debt, equity, non investment – based online channels • Excludes payments, aggregator and information-only platforms Ten Month Research Project • 50+ research partner organizations globally • 1, 800 Survey Entries from unique firms in 175+ Countries & Territories

Snapshot from across the Globe Billions $400 $ 358. 28 $350 97% $300 $250 $200 $150 $100 $ 42. 81 $50 $ 7. 98 $ 3. 80 $ 3. 64 $ 0. 87 $ 0. 66 UK Europe APAC Canada LAC $0 CHINA USA

Alternative Finance Volumes – A Global Snapshot Billions $4 $ 3. 80 $ 3. 64 $4 $3 $3 $2 $2 $ 0. 87 $1 $ 0. 66 $1 $0 Europe APAC Canada LAC

Alternative Finance Volumes – A Global Snapshot Billions $4 $ 3. 80 $ 3. 64 TOP 6 MODELS ( +90% of Market) $4 EUROPE SHARE ASIA-PACIFIC SHARE P 2 P Consumer 41% P 2 P Consumer 23% Invoice Trading 16% BS Business 19% P 2 P Business 14% P 2 P Property 19% Real Estate CF 8% P 2 P Business 17% Equity CF 6% Real Estate CF 10% Reward CF 5% Invoice Trading 5% $3 $3 $2 $2 $ 0. 87 $1 $ 0. 66 $1 $0 Europe APAC Canada LAC

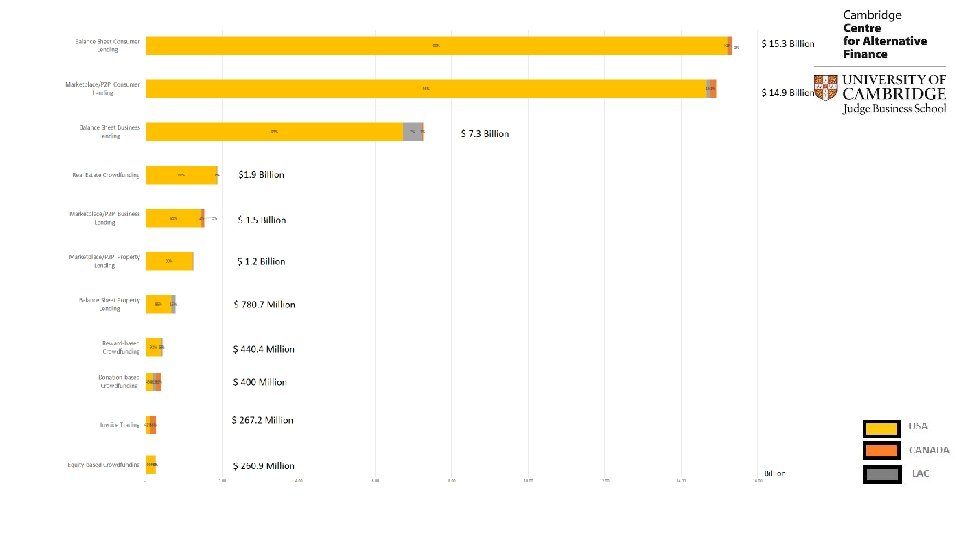
Alternative Finance Volumes – A Global Snapshot Billions $4 $ 3. 80 TOP 6 MODELS ( +90% of Market) $ 3. 64 $4 CANADA SHARE LAC SHARE 57% Marketplace Consumer Lending 27% 13. 3% Invoice Trading 23. 4% 10. 8% Balance Sheet Consumer Lending 18. 4% 10. 2% Marketplace/P 2 P Business Lending 11% 3% Balance Sheet Business Lending 6% 1. 6% Donation 4% $3 Balance Sheet Business Lending $3 Balance Sheet Property $2 Marketplace/P 2 P Consumer Lending $2 Donation CF $1 Reward CF $1 Equity CF $ 0. 87 $ 0. 66 $0 Europe APAC Canada LAC

Overview of China and the Asia Pacific China’s Alternative Finance Volume 2013 -2017 $362 Billion
 Alternative Finance Volume 2013")
Overview of China and the Asia Pacific APAC (excluding China) Alternative Finance Volume 2013 -2017 $362 Billion
![UK Alternative Finance Market Volume, 2011 -17 (in £billions) 7 £[VALUE]b 6 5 £[VALUE]b](http://slidetodoc.com/presentation_image/42ce30bd95b7dfda65e3febb84e83357/image-9.jpg "UK Alternative Finance Market Volume, 2011 -17 (in £billions) 7 £[VALUE]b 6 5 £[VALUE]b")
UK Alternative Finance Market Volume, 2011 -17 (in £billions) 7 £[VALUE]b 6 5 £[VALUE]b 4 £ 0. 31 b 3 2 1 0 2015 2016 2017
![Overview of the UK P 2 P Business Lending £[VALUE]m P 2 P Consumer](http://slidetodoc.com/presentation_image/42ce30bd95b7dfda65e3febb84e83357/image-10.jpg "Overview of the UK P 2 P Business Lending £[VALUE]m P 2 P Consumer")
Overview of the UK P 2 P Business Lending £[VALUE]m P 2 P Consumer Lending 1169 909 P 2 P Property Lending £[VALUE]m £[VALUE]m Invoice Trading £[VALUE]m £[VALUE]m Equity-based Crowdfunding £[VALUE]m Debt-based Securities Real Estate Crowdfunding 71 87 2016 2015 211 44 48 42 Rewards-based Crowdfunding 0 500 1000 1500 2000
 €")
European Online Alternative Finance Market Volumes 2013 -2017 in € (Including the UK) € 12000 m € 10436 m € 10000 m € 7671 m € 8000 m € 5431 m € 6000 m € 4000 m € 2833 m € 2000 m € 1127 m € 0 m 2013 2014 2015 2016 2017

€ 4000 m European Online Alternative Finance Market Volumes 2013 -2017 in € (Excluding the UK) € 3500 m € 3369 m € 3000 m 63% € 2500 m € 2063 m € 2000 m 102% € 1500 m 72% 82% € 1019 m € 1000 m € 594 m € 500 m € 326 m € 0 m 2013 2014 2015 2016 2017

Trends from the Americas • Data collection May 2018 – September 2018 • 20 external outreach partners • 376 Survey Entries from 234 Firms • 25% are Multi-country Firms • 47 additional web scrapped entries • 134% increase in firm coverage

Billions Overview of the Americas – USA, Canada and Latin America $ 50. 00 $ 0. 66 $ 0. 87 $ 45. 00 94% $ 40. 00 $ 30. 00 $ 0. 34 $ 0. 33 209% $ 35. 00 $ 0. 11 $ 0. 21 159% 62% $ 25. 00 $ 42. 81 $ 20. 00 $ 34. 53 $ 15. 00 $ 28. 40 24% 22% $ 10. 00 $ 5. 00 $- 2015 2016 USA Canada Latin America & the Caribbean 2017

Overview of the Americas – USA, Canada and Latin America Total Alternative Finance Volume Marketshare by Key Country 2017 $43. 81 BILLION $867. 6 MILLION [CELLRANGE], [CATEGORY NAME] [CELLRANGE], [CATEGORY N 1%, LAC [CELLRANGE], [CATEGORY N $663. 0 MILLION USA Canada Brazil Mexico Chile Colombia Argentina Peru Rest of Region

Overview of the Americas – USA, Canada and Latin America Total Alternative Finance Volume Marketshare by Key Country 2017 BRAZIL $216 MILLION MEXICO $151 MILLION [CELLRANGE], [CATEGORY NAME] [CELLRANGE], [CATEGORY N CHILE $150 MILLION [CELLRANGE], [CATEGORY NAME] 97%, USA [CELLRANGE], [CATEGORY N COLOMBIA $50 MILLION [CELLRANGE], [CATEGORY N 1%, LAC [CELLRANGE], [CATEGORY N ARGENTINA $29. 9 MILLION PERU $29. 3 MILLION USA Brazil Mexico Chile Colombia RESTCanada OF REGION $57. 8 MILLION Argentina Peru Rest of Region

VOLUME BY MODEL BREAKDOWN - Latin America $ 178. 56 P 2 P Consumer Lending $ 155. 18 Invoice Trading $ 121. 91 Balance Sheet Consumer Lending P 2 P Business Lending $ 71. 06 Balance Sheet Business Lending $ 37. 12 $ 26. 63 Donation-based CF Revenu Sharing/Profit Sharing $ 22. 97 Real Estate CF $ 12. 50 Reward-based CF $ 11. 59 Equity-based CF $ 11. 08 P 2 P Property Lending $ 8. 07 $ 2. 08 Debt-based Securities Community Shares $ 0. 05 Other $ 4. 26 $- $ 20. 00 $ 40. 00 $ 60. 00 $ 80. 00 $ 100. 00 $ 120. 00 $ 140. 00 $ 160. 00 $ 180. 00 Millions
 $ 250. 00")
Millions Top 6 Countries by Market Volume, 2015 -2017 ($ Million) $ 250. 00 $ 216. 36 $ 200. 00 $ 151. 09 $ 150. 70 $ 150. 00 $ 114. 19 $ 97. 76 $ 100. 00 $ 64. 40 $ 50. 63 $ 47. 57 $ 50. 00 $ 29. 88 $ 24. 15 $ 13. 75 $ 11. 20 $ 9. 55 $ 12. 58 $ 0. 33 $- Brazil Mexico Chile 2015 2016 2017 $ 29. 27 $ 9. 85 $ 0. 28 Colombia Argentina Peru

Trend 1 – Alternative finance funds Small and medium firms • • 142% Annual Increase 85% of LAC Market • • • Debt-Models account for $522 m (92%) of SME Volume Equity-Models account for $39. 4 m (7%) Non Investment Models account for $3. 8 m (1%) • Approx. 26, 000 Businesses served in 2017 • Chile largest SME-Focused Market (27% of SME Vol)

Trend 2 – Institutionalization on the Rise • Institutional investors accounted for 51% of overall volume in LAC – or $330. 9 million. • Collaboration is KEY Referral Agreements • 100% Property Lending Platforms • 57% Consumer Lending Platforms • 56% Business Lending Platforms Data Exchange • 28% Business Lending Platforms • 22% Equity Platforms

Trend 3 – Adequate Regulation Drives Volume Perceptions towards Regulation - Loan-based Models 2016 -2017 LAC 2016 19% 2017 6% 12% 38% 0% 10% 20% 45% 0% 7% 30% 40% 17% 27% 50% 60% Perception towards Regulation - Investmentbased Models (2016 - 2017) LAC 2016 29% 70% 80% 9% 2017 90% 100% 0% 90% 22% 0% 11% 20% 30% 0% 17% 40% 33% 50% 60% 70% 17% 80% Adequate & Appropriate Inadequate & Too Relaxed No Specific Regulation & Not needed No Specific Regulation & Needed Excessive & Too Strict 90% 100%

Trend 4 – Most platforms are international but not standardized 100% 9% 90% 80% 5% 11% 0% 18% 0% 5% 8% 9% 17% 11% 4% 2% 2% 33% 9% 17% 44% 45% 11% 70% 37% 60% 50% 86% 55% 33% 50% 87% 91% 61% 40% 73% 30% 23% 67% 33% 44% 18% 27% 10% 0% 21% 0% 26% 14% No International Expansion DBS - Local Website Brand only BS CONSUMER BS BUSINESS P 2 P & BUSINESS Web Localization with Local Brand 33% 0% 14% 11% 9% 9% Global Website and Brand. CF P 2 P CONSUMER P 2 P PROPERTY Global EQUITY Brand W/ INVOICE REAL ESTATE CF Local Websites REWARD CF TRADING Other International Web Presence 4% DONATION CF REVENUE SHARING

Trend 4 – Most platforms are international but not standardized Cross-border Outflows by Proportion of Volume (by Model) 0% 10% 20% 30% 40% 50% 60% Equity-based Crowdfunding 80% 76% Balance Sheet Consumer Lending 54% Marketplace/P 2 P Business Lending 16% Marketplace/P 2 P Consumer Lending 15% 8% Reward-based Crowdfunding Real Estate Crowdfunding 5% Revenue Sharing 3% Donation-based Crowdfunding 3% Balance Sheet Business Lending 70% 2%

Trend 5 – Firms are Investing in R&D Payment processing Customer verification Process Streamlining & automation AI Community Management Social Media & Promotional Tools CRM E-learning Gamification P 2 P Consumer Lending 43% 76% 86% 52% 10% 19% 48% 0% 5% P 2 P Business Lending 59% 64% 86% 55% 9% 18% 50% 9% 14% Balance Sheet Consumer Lending 42% 100% 75% 67% 17% 25% 50% 25% 17% Balance Sheet Business Lending 50% 75% 88% 63% 0% 25% 63% 13% 25% Invoice Trading 44% 61% 100% 22% 11% 6% 28% 0% 6% Equity-based Crowdfunding 56% 78% 44% 56% 78% 11% 22% Real Estate Crowdfunding 71% 57% 86% 57% 0% 43% 57% 14% Reward-based Crowdfunding 57% 48% 52% 39% 43% 74% 17% 43% 4%

Thank you for the attention… Tania Ziegler Centre for Alternative Finance Judge School of Business University of Cambridge, UK E-mail: t. ziegler@jbs. cam. ac. uk
- Slides: 26