Global Shift Chapter 5 Transnational Corporations 8 October

Global Shift: Chapter 5 Transnational Corporations 8 October 2019

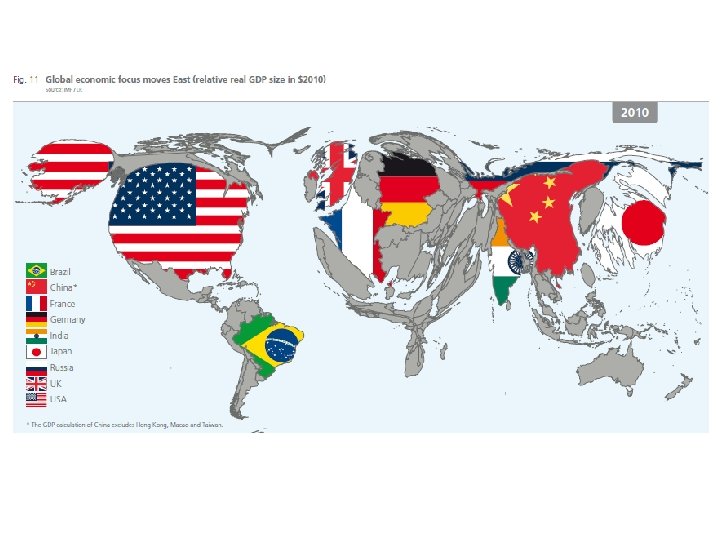
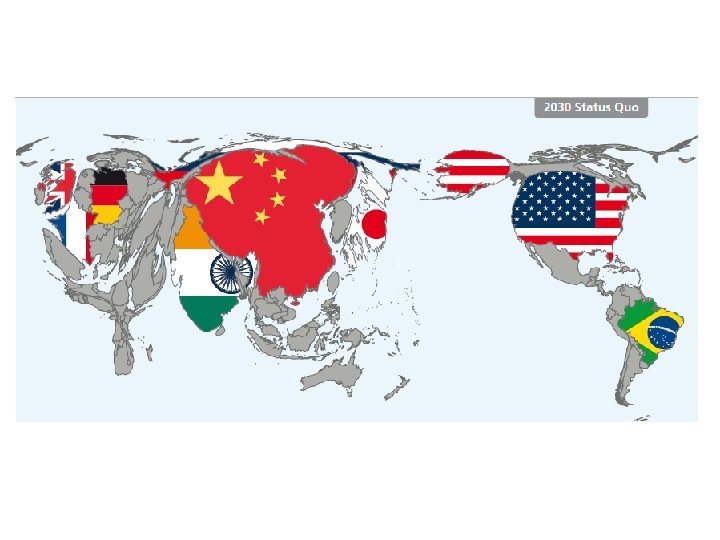
Flawed comparison of size TNCs – countries in 2000 TNC sales vs. GDP => comparing apples and oranges 100 largest economies in the world Þ 51 corporations + 49 countries 50 largest economies in the world Þ 14 corporations + 36 countries GM > Denmark Daimler-Chrysler > Poland Royal Dutch/Shell > Pakistan
 and countries (GDP) in 2000 recalculated Countries")
Comparison of size of TNCs (value added) and countries (GDP) in 2000 recalculated Countries still rule the world! Top 100: 29 TNCs + 71 countries Top 50: 2 TNCs + 48 countries
 of 100 largest TNCs TNI")
The myth of the ”global” corporation: Transnationality Index (TNI) of 100 largest TNCs TNI weighted average of 3 components: Foreign sales/assets/employment over Total sales/assets/employment 1993: 51. 6 2002: 57. 0 2012: 67. 8 High value = important activities abroad Low value = domestically oriented

Figure 5. 1 Transnationality indices by country of origin Source: calculated from UNCTAD, World Investment Report, various issues
")
Why internationalize? Fundamental objective: PROFIT (expansion, market leader, increased market share)
")
Major motives for internationalization Market seeking: • Size of market • Structure (of demand) • Accessibility Asset seeking: • (Natural resources) • Knowledge • Labor

Figure 5. 2 Variations in market size: gross national income per capita Source: World Bank 2012 data. Cartograms produced by Danny Dorling and Benjamin Hennig, School of Geography and the Environment, University of Oxford
 Important attributes of labor • • Knowledge and skills Wage costs Labor")
(Asset seeking) Important attributes of labor • • Knowledge and skills Wage costs Labor productivity Labor ”controllability”

Figure 5. 3 Enrolment in tertiary education Source: based on data in USAID, Global Education Database

Figure 5. 4 Geographical variations in hourly compensation costs in manufacturing Source: based on US Bureau of Labour statistics, 2012
 firm with strong domestic position (home market) followed")
How firms transnationalize Conventional view: (Large) firm with strong domestic position (home market) followed by expansion abroad based on advantage (firm specific asset)

Figure 5. 5 The PLC as an evolutionary sequence of US TNCs’ development Source: based on Wells, 1972: Figure 15

Figure 5. 6 Diverse pathways of TNC evolution

”Born Globals” entrepreneurial ventures starting out as TNCs from the very beginning

Figure 5. 7 Advantages and disadvantages of a globally integrated strategy Source: based on material in Doz, 1986 b

Figure 5. 9 TNCs as networks within networks Source: based, in part, on Forsgren et al. , 2005: Figure 7. 3

Figure 5. 10 Basic elements of the Japanese keiretsu Source: based, in part, on Gerlach, 1992: Figure 1. 1

Figure 5. 11 Types of TNC organizational architecture

Figure 5. 15 ‘Integrated network organization’ model Source: based on Bartlett and Ghoshal, 1998: Figure 5. 1

HQs-subsidiaries relations Reflect varying degrees of control of operations delegated to the subsidiary: 1. Local implementor => limited geographic scope and functions; adapt TNC product for local market 2. Specialized contributor => integrated activities with other subsidiaries; performing specific functions in close cooperation (interdependence) with other subsidiaries (link on a chain) 3. Worldwide responsibility (for particular product)

Geography of TNCs’ internal networks: major business functions 1. Control and coordination 2. Research and development (R&D) 3. Marketing and sales 4. Production
 • Regional headquarters (offices)")
1. Control and coordination • Corporate headquarters (HQs) • Regional headquarters (offices)
 Global: Basic research centers Regional: local product innovation and")
2. Research and development (R&D) Global: Basic research centers Regional: local product innovation and development Local: support laboratory/technical service center

Figure 5. 16 Corporate R&D processes Source: based, in part, on Buckley and Casson, 1976: Figure 2. 7

3. Marketing and sales Proximity - presence in the market

4. Production • Diverse geography with different localization requirements depending on type of production • Different geographical patterns emerged over time

Figure 5. 17 Alternative ways of organizing the geography of transnational production

Figure 5. 18 Solectron’s global network Source: based on Sturgeon, 2002: Table 2
 • Commercial outsourcing • Industrial outsourcing : * Speciality * Cost-saving *")
Outsourcing (subcontracting) • Commercial outsourcing • Industrial outsourcing : * Speciality * Cost-saving * Complementary/intermittent

Figure 5. 19 Outsourcing as a multi-tiered process

Figure 5. 20 Outsourcing relationships
 Þ less dependent on proximity of suppliers")
Stock/inventory of components: Just in Case (JIC) Þ less dependent on proximity of suppliers Just in Time (JIT) => more dependent on proximity of suppliers

Figure 5. 21 ‘Just-in-case’ and ‘just-in-time’ systems of supplier relationships Source: based on material in Sayer, 1986

Figure 5. 22 Some of Foxconn’s global production facilities Source: press and company reports

Subcontractors’ “bridging role” 1. Local integrator: provide access to additional production capacity through relationships with other firms in same area 2. Export base: specialist supplier, adds knowledge to product based on network of local suppliers 3. Import base: specialist supplier providing access to international resources skills 4. International spanner: XM base supplier => connects international buyers and suppliers 5. Global integrator: manage international supply chain including infrastructure for larger variety of manufactures goods

Types of production networks * Captive production networks * Relational production networks * Modular production networks

Figure 5. 24 Organization of the Nike production network Source: based on Donaghu and Barff, 1990: Figure 4; pp. 542– 4.

Figure 5. 25 Nike’s global supplier network Source: based on data in Nike Inc. , 2012, Nike Contract Disclosure List NIKE workers and factories update http: //manufacturingmap. nikeinc. com/

Figure 5. 26 Types of inter-firm collaboration Source: based on Anderson, 1995: Figure 1

Reshaping TNCs internal networks • External conditions • Internal pressures

Figure 5. 27 Reorganization, restructuring and geographical change

TNC reorganization • Redefining core activities • Greater emphasis on service activities (e. g. after-sale, downstream activities) • Redefining role and function of individual units (reconfigurating production networks) • Redefining internalized/externalized activities

Regionalizing transnational production network TNCs tend to organize their production networks regionally (trend from global to regional supply chains) : *achieve economies of scale at the regional level *market proximity: faster delivery, respond to changes in demand, smaller stocks
- Slides: 46