Global Patterns of Species Richness Global Amphibian Diversity

Global Patterns of Species Richness Global Amphibian Diversity

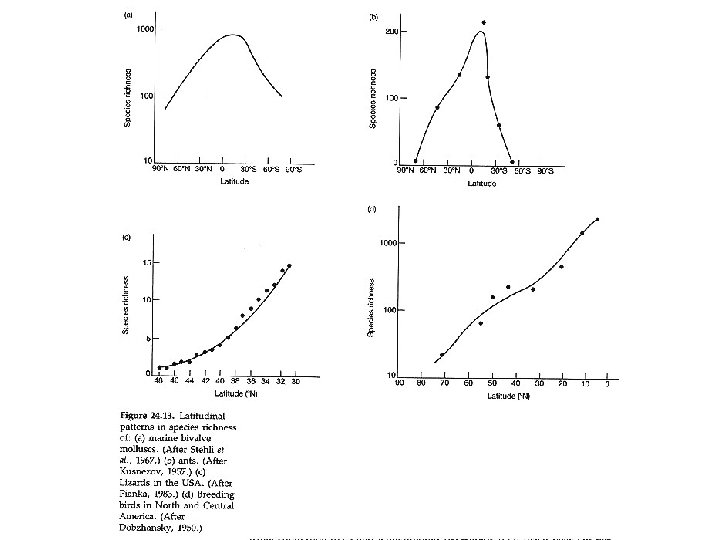
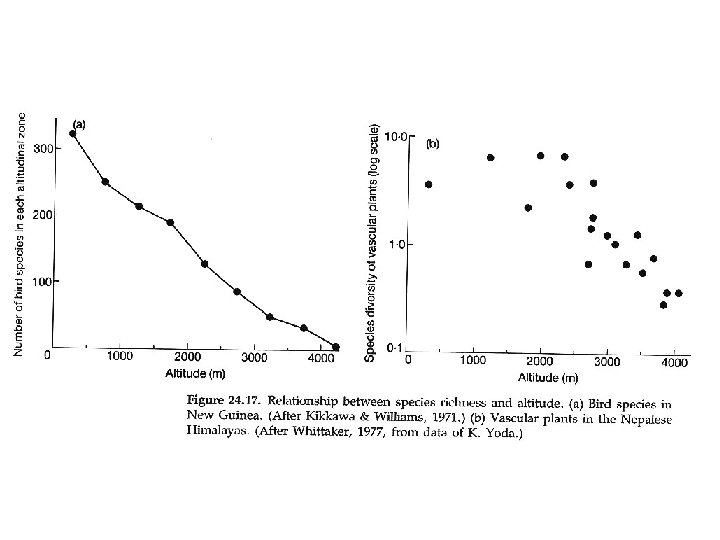
Global Patterns of Species Richness

Measures of Biodiversity • Species richness – the number of species in an area – the simplest measure of biodiversity • Species evenness or equitability – the relative proportion of number of individuals of each species in an area • Often richness and evenness are combined into a Species Diversity Index

A comparison of species diversity in two communities A B C D A: 25% Community 1 B: 25% C: 25% D: 25% A: 80% Community 2 B: 5% C: 5% D: 10%


Animated Life of A. R. Wallace • http: //www. nytimes. com/video/opinion/100 000002534565/the-animated-life-of-a-rwallace. html
 Morphological diversity, spatial heterogeneity 2) High")
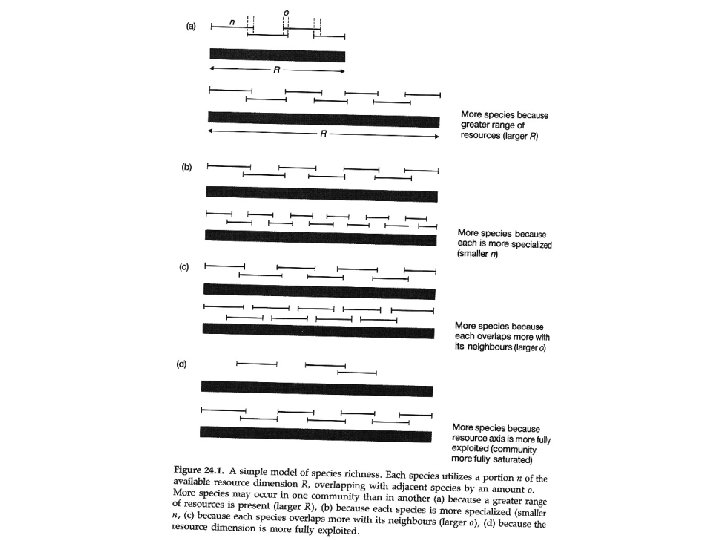
Explanations for Global Patterns of Species Richness 1) Morphological diversity, spatial heterogeneity 2) High average rarity - no monocultures – in tropics 3) Climatic constancy of tropics 4) Geological age 5) Special adaptations in extreme (harsh) environments 6) Competitive "balance" 7) Alternating competitive advantages 8) "All niches filled theory" - saturation of community 9) Productivity from A. R. Wallace - 1878

9. Richness and Productivity

1. Richness and Structural Diversity

5. Environmental harshness

3. Richness and Climatic Variability

4. Richness and Environmental Age Last Glacial Maximum

4. Richness and Environmental Age South American Rain Forest – Today and Past Refuges

2. Richness and High Average Rarity Global Plant Richness Local Centers Of Diversity Quality of Data

2. Richness and High Average Rarity Endemic Plant Species Globally

2. Richness and High Average Rarity Endemic Plant Species Globally

2. Richness and High Average Rarity Endemic Plants in Africa

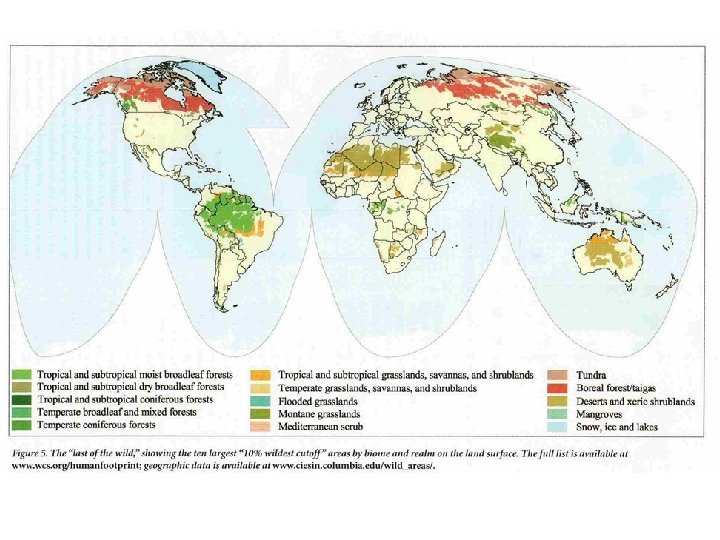
Biomes

Limits to Biome Distribution

Limits to Biome Distribution

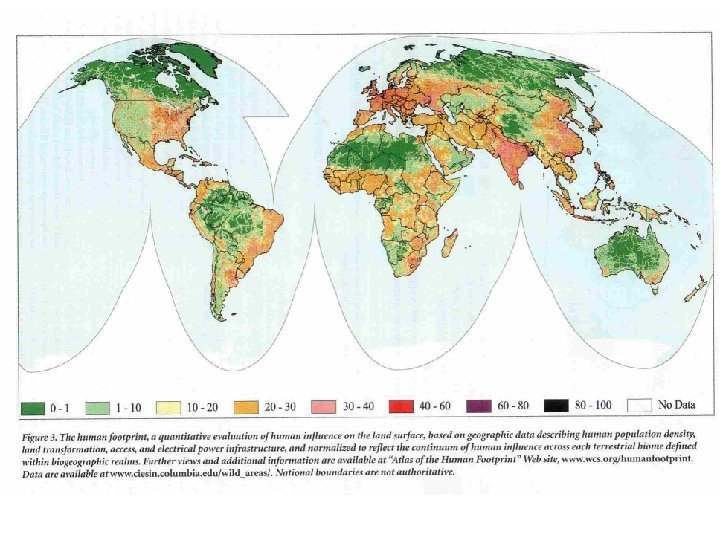
Anthropogenic Biomes – from Ellis and Ramankutty 2008

Early Island Biogeography

Island Habitats in Baltic Sea

Reptile and Amphibian Species Area Curve for Caribbean Islands

Habitat Islands In the Great Basin Top – Birds, Bottom - Mammals

Species Richness related to Island Size and Island Isolation

Species-Area Curves for Islands S = c. Az where: S = number of species A = area of island c = constant for habitat type - forest, desert, grassland z = slope of the curve - predicted to be 0. 263, but actually varies with dispersal ability

An area of island will have fewer species than equal sized area of continent Ant species On New Guinea and Nearby Islands

The slope of the line plotted for species-area curve is larger for species with poor dispersal abilities Oceanic islands birds - New Guinea islands beetles - West Indies land plants - Channel Islands Habitat islands birds - Andes paramo birds - mtns of Great Basin mammals - mtns of Great Basin inverts -caves in West Virginia z=0. 22 z=0. 34 z=0. 37 z=0. 29 z=0. 165 z=0. 326 z=0. 72
- Slides: 34