Global Imbalances and the Bretton Woods II System

Global Imbalances and the Bretton Woods II System

Global Imbalances n n 1. 2. This is a term used to describe the state of the world economy during 2000 to the present. The imbalance is between two different groups of economies: High savers creating surpluses High spenders with a need to borrow.

Global Savings Glut n n n Glut= surplus, oversupply This is a related term which gives the impression that there is excess savings in the world economy which cannot be made use of. The logic of national income accounting tells us that this is not possible.

National Income Identity In an open economy, GDP = C+I+G+EX-IM = Current Account Subtract taxes from both sides GDP-T=C+I+G-T+EX-IM
=EX-IM Private savings S= GDP-T-C (S-I)+(T-G)= EX-IM The two components of the")
Rearrange terms GDP-T-C-I+(T-G)=EX-IM Private savings S= GDP-T-C (S-I)+(T-G)= EX-IM The two components of the current account are n n private sector savings-investment balance public sector balance.

CA deficit or surplus n n If a country runs a current account deficit, the sum (S-I) and (T-G) must be a net deficit If a country runs a current account surplus, the sum (S-I) and (T-G) must be a net surplus

CA deficit or surplus n n If a country runs a current account deficit, it is financed by a decrease in reserves and imports of savings from abroad If a country runs a current account surplus, it is experiencing an increase in reserves and is exporting capital (savings)

Sum of Global CA balances n n n Since transactions recorded in one country’s CA have mirror images in those of other countries, sum of global CA balances = 0. This means then, on a global scale, sum of (S-I)+(T-G)= 0

Global imbalances n n n It is impossible to have a positive or a negative balance on the global sum of CA’s. But, statistical discrepancy makes it possible to have nonzero balances. Likewise, global savings and investment have to be equal, but are not.

World Savings and Investments % of GDP Source: IMF WEO, October 2009 Table A 16

Global Savings Glut What is meant by this term? 1. An increase in world saving rates 2. An increase in funds available for borrowing 3. An increased concentration of savings in certain parts of the global economy Who are the savers? Who are the dissavers?
 2003 2004 2005 2006 2007 2008 S 19. 3 20.")
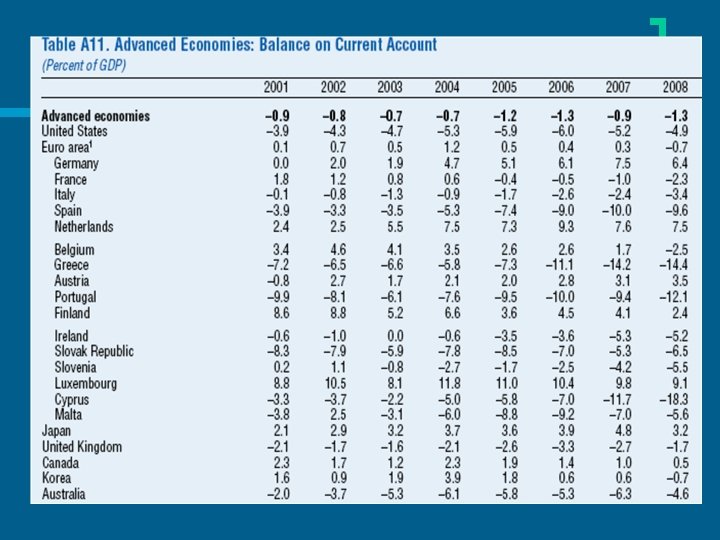
Advanced Nations (% GDP) 2003 2004 2005 2006 2007 2008 S 19. 3 20. 0 20. 2 20. 9 20. 7 19. 5 I 20. 0 20. 6 21. 1 21. 6 21. 5 21. 0 Net -0. 7 Lendin g -0. 6 -0. 9 -1. 5

Advanced economies n n n The aggregation over advanced countries masks differences. US and UK are borrowers. Japan and Germany are savers. US net lending (S-I) increases over time. Negative net lending is CA deficit.
 1986 -1993 1994 -2001 saving 16. 3")
Saving, investment , net lending US, (%GDP) 1986 -1993 1994 -2001 saving 16. 3 17. 0 investment 18. 8 19. 6 Net lending -2. 6
 2002 2003 2004 2005 2006 2007 2008")
Saving, investment , net lending US, (%GDP) 2002 2003 2004 2005 2006 2007 2008 S 14. 2 13. 9 14. 5 15. 1 16. 2 14. 5 12. 6 I 18. 4 18. 7 19. 7 20. 2 20. 3 19. 5 18. 2 NL -4. 2 -4. 8 -5. 2 -5. 1 -5. 2 -5. 0 -5. 6
 2002 2003 2004 2005 2006 2007 S")
Saving, investment , net lending Germany, (%GDP) 2002 2003 2004 2005 2006 2007 S 19. 3 19. 4 21. 8 22. 1 23. 7 25. 9 I 17. 3 17. 4 17. 1 16. 9 17. 6 18. 3 NL 2. 0 4. 7 5. 2 6. 1 7. 6
 2002 2003 2004 2005 2006 2007 S")
Saving, investment , net lending UK, (%GDP) 2002 2003 2004 2005 2006 2007 S 15. 3 15. 1 15. 0 14. 7 14. 2 14. 6 I 17. 1 16. 7 17. 1 17. 3 17. 6 18. 4 NL -1. 7 -1. 6 -2. 1 -2. 6 -3. 4 -3. 8
 2002 2003 2004 2005 2006 2007 S")
Saving, investment , net lending Japan, (%GDP) 2002 2003 2004 2005 2006 2007 S 25. 9 26. 1 26. 8 27. 2 27. 8 28. 6 I 23. 1 22. 8 23. 0 23. 6 24. 0 23. 8 NL 2. 9 3. 2 3. 7 3. 6 3. 9 4. 7

CA Balance as % of global GDP
")
Current Account Balance ($bil)
")
Current Account Balance 2001 -2008 ($bil)
")
CA balance 2001 -2008 (% of GDP)

CA Balance as % of GDP 2001 2002 2003 2004 2005 2006 2007 2008 Chin 1. 3 a 2. 4 2. 8 3. 6 7. 2 9. 4 11. 0 9. 8 Dev 1. 6 Asia 2. 5 2. 8 2. 7 4. 2 6. 1 7. 0 Mid 6. 3 East 4. 4 7. 9 11. 6 19. 3 20. 9 18. 1 18. 3 5. 9

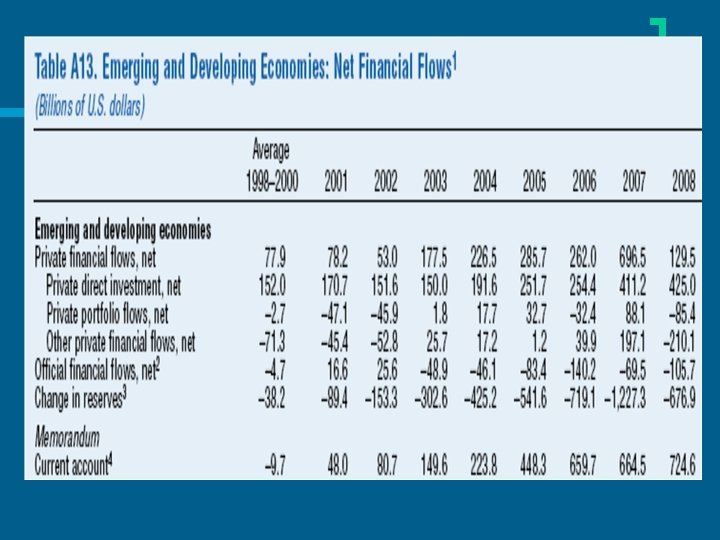
Direction of global capital flows n US is the major borrower in the global economy along with some other developed nations. n The source of savings: 1. China and developing Asia Some developed economies Oil producing economies Capital flows uphill. 2. 3. n

Stages of financial globalization n The first phase of financial globalization took place in the 19 th century Second phase of financial globalization started in the 1980’s and lasted until 1998. (Asia crisis) Third phase of financial globalization took place in the 2000’s.

Second phase of financial globalization n n Emerging markets can benefit from the pool of global savings by removing restrictions on capital account transactions. They did import capital that is needed for development but this movement proved to be volatile and ended in financial crises.

Third phase of financial globalization In order to avoid the painful experience of the Asian and othe emerging market crises, these countries started building up reserves. These countries ran a current account n Deficit equal to 1. 7% of GDP in 19901998 n Surplus equal to 2. 5% of GDP in 19982008 n

Chimerica n n The third stage of financial globalization led to a financial symbiosis between US and China “How China helped create the macroeconomic backdrop for financial crisis” By Moritz Schularick, Financial Times, February 24, 2009

Exchange rate protectionism n n Keep the domestic currency undervalued so that there is increased demand (expenditure switching) for tradable goods and services. So, production of tradable sectors is enhanced.

Intervention in the foreign exchange market S $, RMB/$ Chinese exports intervention Excess S of $ reserve accumulation D $, after intervention Chinese exports

If there is no intervention in the foreign exchange market S $, RMB/$ Exchange rate with intervention Exchange rate without intervention D $, after intervention D $,

Without the intervention n n Domestic currency would be more valuable You do not have reserve accumulation Current account surpluses would have shrunk Governments would have to pursue more expansionary policies

Intervention by emerging market governments will cause n n Current account surpluses Encourage private capital inflows because the exchange rate is predictable Both will lead to reserve accumulation. There will be a pressure on the domestic currency to appreciate.

To sustain this situation n n Fiscal policy must maintain that Y is greater than spending (ie, contractionary) Monetary policy must ‘sterilize’ the buildup of reserves. Reserves are held by the government. Otherwise monetary expansion created by reserves overheats the economy.

Result n n n Although emerging market countries received capital inflows, they accumulated more reserves by not investing as much. The reserves ended up being recycled back to the developed world. Chimerica is the most vivid example of this.

Two sides complement each other n n n The US gives CA balances against the exporting emerging nations The US CA deficit is financed by the capital inflows of exporting nations (vendor financing) The source of capital imports is reserve accumulation and hence savings not utilized at home.
is")
For the holders of reserves n n Investing in US liabilities (dollar denominated assets)is desirable because: The dollar is the most important vehicle currency There are investment opportunities (dynamic economy) and property rights are secure There is no risk of the dollar crashing

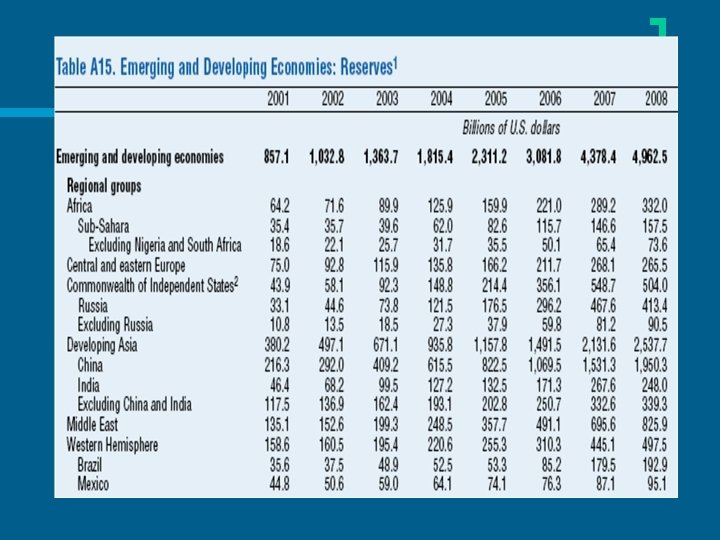
Joint BP of emerging and developing economies in 2006 n n CA Surplus: $660 billion Net FDI inflows: $254 billion ‘Other private capital flows’: close to zero Increase in foreign currency reserves 2001 and 2006: $2. 22 trillion 2001 and 2008: $4. 11 trillion
by IMF 2000 Emerging and developing Africa CIS Developing Asia 2008 801.")
Reserves (Billion $)by IMF 2000 Emerging and developing Africa CIS Developing Asia 2008 801. 1 4962. 5 54. 3 332. 0 33. 2 504. 0 320. 7 2537. 7
 2000 2008 China 320. 7 1950. 3 India 38. 4 248.")
Reserves (Billion $) 2000 2008 China 320. 7 1950. 3 India 38. 4 248. 0 Middle East 146. 1 825. 9 Western hemisphere 155. 7 497. 5
- Slides: 43