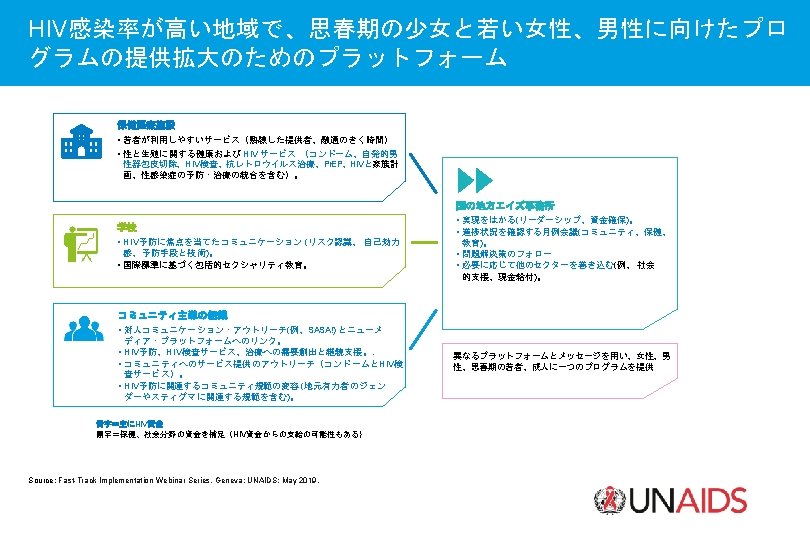
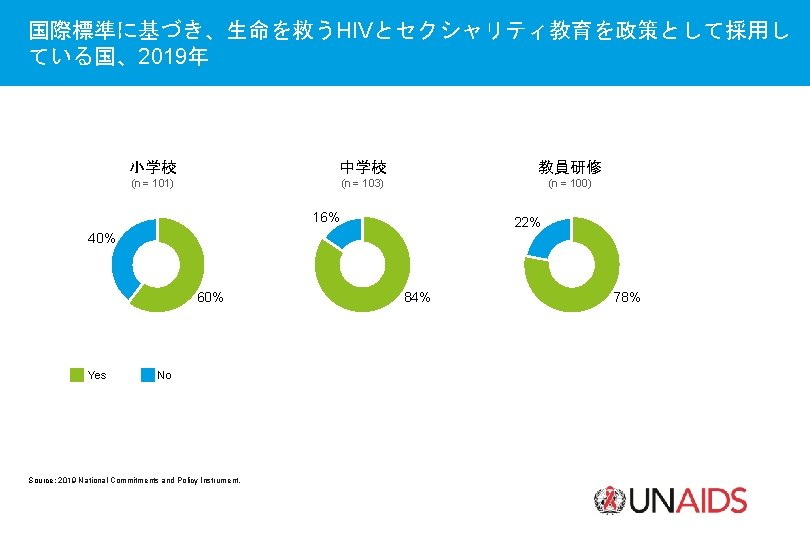
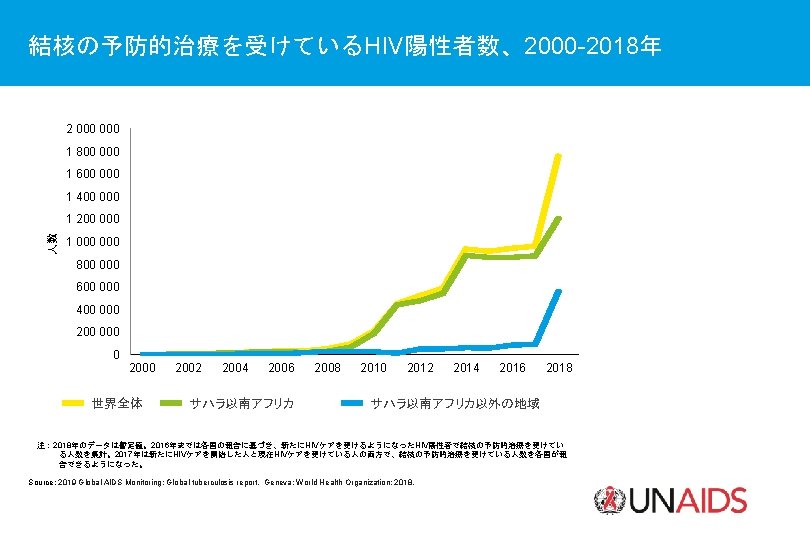
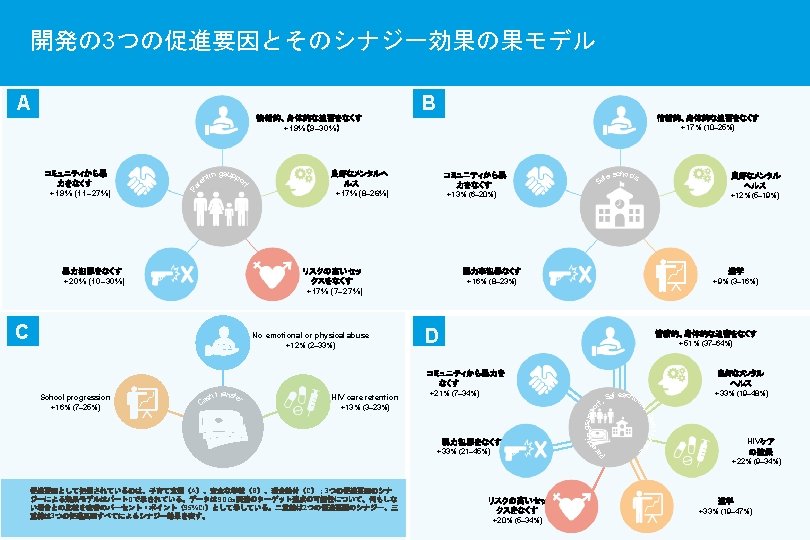
GLOBAL AIDS UPDATE 2019 COMMUNITY ENGAGEMENT GLOBAL AIDS

GLOBAL AIDS UPDATE 2019 COMMUNITY ENGAGEMENT コミュニティの関与

GLOBAL AIDS UPDATE 2019 STATE OF THE EPIDEMIC 流行の現状
、2010– 2018年 120 000 中東・北アフリ カ Source: UNAIDS 2019 estimates. イランとスーダンを除く中 東・北アフリカ 東欧・中央アジア Number")
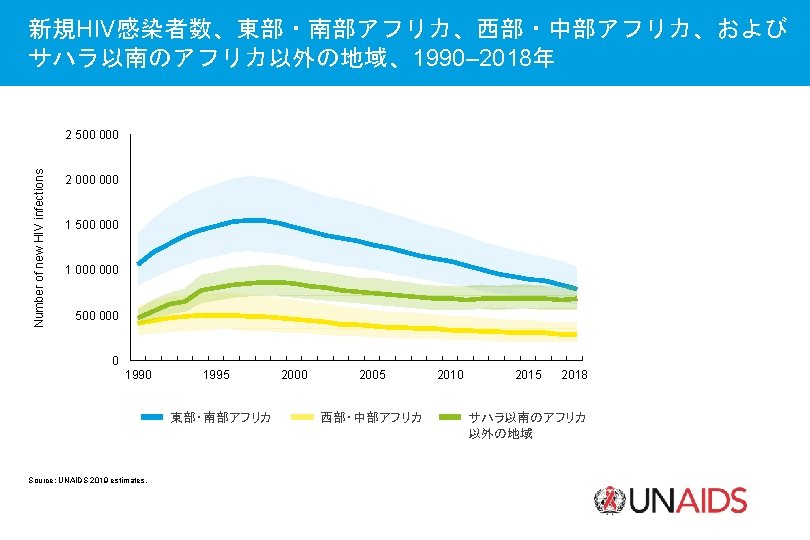
新規HIV感染の傾向(地域別)、2010– 2018年 120 000 中東・北アフリ カ Source: UNAIDS 2019 estimates. イランとスーダンを除く中 東・北アフリカ 東欧・中央アジア Number of new HIV infections 800 000 -28% 600 000 -21% 400 000 2018 2017 2016 2015 2014 2013 2012 2011 0 2010 200 000 2018 2017 2015 2016 南アフリカを除く東部・南 部アフリカ 東部・南部アフ リカ ロシアを除く東欧・中央アジア -13% 250 000 200 000 -23% 150 000 100 000 50 000 西部・中部アフリ カ 2018 2017 2016 2015 2014 2013 2012 0 2011 Number of new HIV infections 300 000 2018 2017 2016 -4% 2015 2018 2017 2016 2015 2014 2013 2012 2011 0 2010 5000 2013 +33 +29% 2012 15 000 1 000 350 000 180 000 160 000 140 000 120 000 100 000 80 000 60 000 40 000 20 000 0 2011 +10 10 000 ブラジルを除くラテンアメリ カ ラテンアメリカ 25 000 20 000 0 2014 2018 2017 2016 2015 2014 中国とインドを除くアジア・ 太平洋 アジア・太平洋 Number of new HIV infections 2013 2012 2011 2010 0 20 000 2014 50 000 -5% 40 000 2013 -18% 100 000 60 000 2010 150 000 80 000 2012 200 000 +7% 100 000 2011 250 000 1 200 000 2010 -9% 300 000 Number of new HIV infections 350 000 Number of new HIV infections 400 000 ナイジェリアを除く西 部・中部アフリカ
 、世界全体およ び地域別、 2000‐ 2018年 感染率‐有病率比 カリブ 25 20 15 10 5 3 2010")
HIV陽性者数に対する新規感染者数の割合(感染率‐有病率比) 、世界全体およ び地域別、 2000‐ 2018年 感染率‐有病率比 カリブ 25 20 15 10 5 3 2010 2015 2018 20 15 10 5 3 2000 25 20 15 10 5 3 2000 2005 2010 2015 2018 15 10 5 3 Source: UNAIDS 2019 estimates. 20 15 10 5 3 2000 20 15 10 5 3 2005 2010 2015 2018 25 20 15 10 5 3 2005 2010 2015 2018 30 25 20 15 10 5 3 2000 2005 2010 西部・中部アフリカ 30 2005 アジア・太平洋 25 2000 Incidence-prevalence ratio 20 2018 25 ラテンアメリカ 25 2005 2015 30 東部・南部アフリカ 30 2000 2010 30 西欧・中欧・北アメリカ 30 Incidence-prevalence ratio 中東・北アフリカ 2005 Incidence-prevalence ratio 2005 25 Incidence-prevalence ratio 2000 東欧・中央アジア 30 Incidence-prevalence ratio 世界全体 目標値 2015 2018 30 25 20 15 10 5 3 2000 2005 2010

国別 感染率‐有病率比、2018年 0– 2. 99 Botswana Burkina Faso Burundi Cambodia Denmark El Salvador Germany Italy Kenya Mauritania Nepal Norway Portugal Rwanda Singapore Spain Thailand Viet Nam Zimbabwe Source: UNAIDS 2019 estimates. 3. 0– 4. 99 Argentina Australia Bahamas Cameroon Cape Verde Central African Republic Colombia Côte d’Ivoire Democratic Republic of the Congo Dominican Republic Eritrea Estonia Eswatini Ethiopia France Gabon Guatemala Guyana Haiti Honduras Israel Japan Lao People’s Democratic Republic Lesotho Liberia Libyan Arab Jamahiriya Luxembourg Malawi Mexico Morocco Myanmar Namibia New Zealand Nicaragua Niger Panama Papua New Guinea Peru Romania Senegal Somalia South Africa Sri Lanka Suriname Togo Uganda United Republic of Tanzania Zambia 5. 0– 9. 99 Algeria Angola Armenia Barbados Belarus Belize Benin Bhutan Bolivia Bosnia and Herzegovina Brazil Chad Chile Congo Costa Rica Croatia Cuba Djibouti Ecuador Equatorial Guinea Finland Gambia Georgia Ghana Guinea-Bissau Hungary Iceland Indonesia Iran (Islamic Republic of) Ireland Jamaica Jordan Kuwait Kyrgyzstan Latvia Lebanon Malaysia Mali Mauritius Mongolia Mozambique Nigeria Oman Paraguay Republic of Moldova Serbia Sierra Leone South Sudan Syrian Arab Republic Tajikistan Tunisia Ukraine Uruguay Yemen 10 and above Afghanistan Bangladesh Egypt Kazakhstan Madagascar Montenegro North Macedonia Pakistan Philippines Uzbekistan

GLOBAL AIDS UPDATE 2019 A COMBINATION APPROACH TO HIV PREVENTION HIV予防の コンビネーションアプローチ

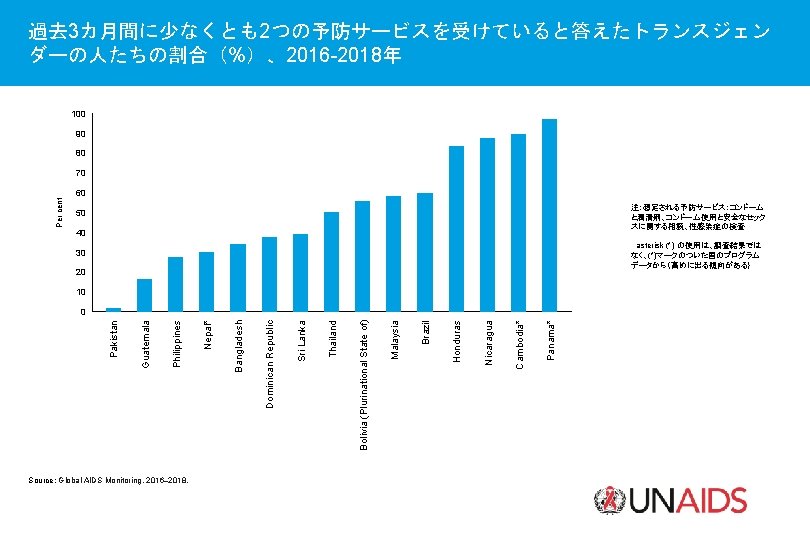
Pakistan Tunisia Algeria Sri Lanka Bangladesh South Sudan Dominican Republic United Republic of Tanzania Brazil Sao Tome and Principe Viet Nam Guatemala Nepal* Philippines Malaysia Dominica* Zimbabwe Burkina Faso Tajikistan Lao People’s Democratic Republic Niger* Republic of Moldova Morocco* Suriname Malawi* Thailand North Macedonia Costa Rica Belarus Kazakhstan* Nicaragua Côte d’Ivoire Armenia Singapore Panama* Cambodia* Per cent 過去 3カ月間に少なくとも2つの予防サービスを受けていると答えたセックスワーカー の割合(%) 、2016 -2018年 100 90 80 70 60 50 40 注:想定される予防サービス:コンドーム と潤滑剤、コンドーム使用と安全なセック スに関する相談、性感染症の検査 30 20 asterisk (*) の使用は、調査結果では なく、(*)マークのついた国のプログラム データから(高めに出る傾向がある) 10 0 Source: Global AIDS Monitoring, 2016– 2018.

Pakistan Bangladesh Senegal Lao People’s Democratic Republic Dominica Algeria Guinea Cambodia* Viet Nam Singapore* Guatemala Ireland Sri Lanka Saint Vincent and the Grenadines* Philippines Brazil Dominican Republic Bolivia (Plurinational State of) Malaysia Kyrgyzstan Colombia Côte d’Ivoire Niger* Morocco North Macedonia Thailand Republic of Moldova Malawi Belarus Honduras Nicaragua Zimbabwe* Burkina Faso Nepal* Sao Tome and Principe Panama* Per cent 過去 3カ月間に少なくとも2つの予防サービスを受けていると答えたゲイ男性など男性と セックスをする男性の割合(%)、2016 -2018年 100 90 80 70 60 50 40 注:想定される予防サービス:コンドーム と潤滑剤、コンドーム使用と安全なセック スに関する相談、性感染症の検査 30 20 asterisk (*) の使用は、調査結果では なく、(*)マークのついた国のプログラム データから(高めに出る傾向がある) 10 0 Source: Global AIDS Monitoring, 2016– 2018.
、2016 -2018年 100 90 80 Per cent 70 60 注:想定される予防サービス:コンドーム と潤滑剤、コンドーム使用と安全なセック スに関する相談、性感染症の検査、注")
過去 3カ月間に少なくとも2つの予防サービスを受けていると答えた注射薬物使用者の 割合(%)、2016 -2018年 100 90 80 Per cent 70 60 注:想定される予防サービス:コンドーム と潤滑剤、コンドーム使用と安全なセック スに関する相談、性感染症の検査、注 射器・注射針の滅菌 50 40 30 asterisk (*) の使用は、調査結果では なく、(*)マークのついた国のプログラム データから(高めに出る傾向がある) 20 10 Source: Global AIDS Monitoring, 2016– 2018. Cambodia* Seychelles Nepal* Tajikistan Belarus North Macedonia Philippines Morocco Kyrgyzstan* Republic of Moldova Armenia Myanmar Iran (Islamic Republic of) Viet Nam* Bangladesh Uganda Sri Lanka Pakistan Malaysia 0
、 2017年 1月– 2019年 3月 800 652 700 600 新規HIV感 染診断件 数 568 561")
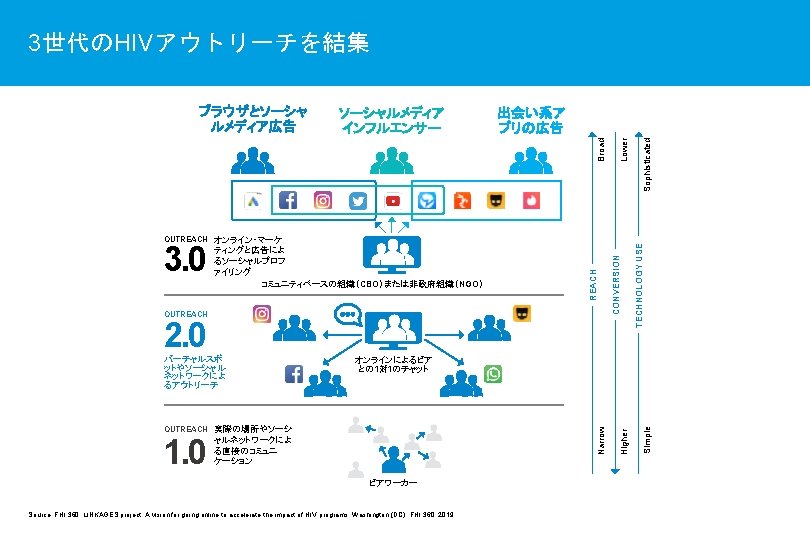
四半期ごとのHIV感染診断件数、ジャカルタ(インドネシア)、 2017年 1月– 2019年 3月 800 652 700 600 新規HIV感 染診断件 数 568 561 575 525 454 500 632 504 495 400 オンラインによる4つの アウトリーチストリーム を活用し、8つの症例探 索方式を採用 300 200 100 0 Jan–Mar 2017 Apr–Jun 2017 Jul–Sep 2017 Oct–Dec 2017 Jan–Mar 2018 Apr–Jun 2018 Source: Data from USAID/LINKAGES and the Jakarta Provincial Health Office (provided by FHI 360). Jul–Sep 2018 Oct–Dec 2018 Jan–Mar 2019

100 注射針・注 射器プログ ラムおよび オピオイド 代替薬治療 の普及率、 2014– 2018 年 90 Norway 80 France Malaysia Seychelles 70 Malta 60 Cyprus オピオイド代替 薬治療を受けて いる注射薬物使 用者の割合(%) 50 Portugal Greece Spain Mauritius Ireland Luxembourg Austria Georgia Morocco 40 Czechia Australia 30 20 10 Source: Global AIDS Monitoring, 2014– 2018. 0 Serbia Italy Belgium Viet Nam Kenya Bulgaria North Macedonia Senegal Lithuania United Republic of Tanzania Hungary Poland Slovenia Romania Iran (Islamic Republic of) Estonia Finland Cambodia India Myanmar Albania Latvia Bosnia and Herzegovina Indonesia Mexico Armenia Thailand Bangladesh Kyrgyzstan Belarus Ukraine Tajikistan Afghanistan. Nepal Azerbaijan Republic of Moldova Kazakhstan 0 100 200 300 400 500 注射薬物使用者1人あたりの注射器・注射針年間配布数 600 700

オピオイド依存でメサドン治療を受けている人の数、および注射薬物使用者の 新規HIV感染診断件数、アイルランド、2007– 2017年 新規HIV感染診 断件数 メサドン治療を受けて いる人数 12 000 80 70 10 000 60 8000 50 6000 40 30 4000 20 2000 10 0 0 2007 2008 2009 2010 2011 メサドン治療を受けているオピオイド依存の 人の数 2012 2013 2014 2015 2016 2017 注射薬物使用者の新規HIV感染診断者 数 注:ダブリンでは 2015年にホームレスの合成カチノン系化合物使用者のHIVアウトブレークがあり、新規HIV感染診断数が増加した。欧州薬物・薬物依存監視センター( EMCDDA)アイルランド国別薬物報告参照。[Internet]. Lisbon: EMCDDA; [date unknown]( http: //www. emcdda. europa. eu/countries/drug-reports/2019/ireland/drugrelated-infectious-diseases_en , accessed 16 June 2019). Source: Delargy I, Crowley D, Van Hout MC. Twenty years of the methadone treatment protocol in Ireland: reflections on the role of general practice. Harm Reduct J. 2019; 16: 5.
が直近のリスクの 高いセックスでコンドームを使用した割合、国・地方別、2012– 2018年 Global target (90%) 国別 最も低い地方 最も高い地方 Zimbabwe Namibia Malawi Lesotho")
結婚または一緒に暮らしているパートナーのいない男性(15– 49歳)が直近のリスクの 高いセックスでコンドームを使用した割合、国・地方別、2012– 2018年 Global target (90%) 国別 最も低い地方 最も高い地方 Zimbabwe Namibia Malawi Lesotho Kenya Gabon South Africa Senegal Harare Chitungwiza Oshana Zomba City Maseru Nyanza Haut-Ogooué North-West Dakar Gambia Rwanda Uganda Togo Comoros Nigeria Zambia Ethiopia Angola Burundi Guinea Brikama Kigali Acholi Lomé Ngazidja Kogi Lusaka Harari Zaire Bujumbura Mairie Conakry Mozambique Liberia Chad Mali Ghana Benin Democratic Republic of the Congo Sierra Leone Maputo City Monrovia N'Djaména Bamako Upper West Littoral (Cotonou) Kinshasa Western Urban 0 10 20 30 40 50 60 70 80 90 100 Per cent Source: Population-based surveys, 2012– 2018. High Medium Low

セックスワーカーのコンドーム使用率、2014– 2018年 直近の報告時にコンドームを常時使用と回答 直近のセックスでコンドームを使用 100 90 80 パーセント 70 60 50 40 30 20 10 Eritrea Jamaica Peru Lao People’s Democratic Republic Source: Literature review by UNAIDS and the Key Populations Program of the Center for Public Health and Human Rights, Johns Hopkins University. See references at the end of the chapter for details. Sri Lanka India Zimbabwe Guyana Uganda Kenya Myanmar Botswana Benin Viet Nam Eswatini Bangladesh Montenegro Mongolia Nigeria Malawi Burkina Faso China Pakistan Ukraine Rwanda Zambia Iran (Islamic Republic of) Cambodia Mexico 0

産婦人科診療所の配置と州別の成人HIV陽性率、ジンバブエ、2017年 Chirundu Kariba Magunje Gokwe Victoria Falls Karoi Bindura Juru Marondera Hwange Rusape Chivhu Lupane HIV 陽性率 10. 5– 12. 0% 12. 1– 14. 5% 14. 6– 18. 0% Redcliff Mwuma Gweru Bulawayo Plumtree Zvishavane Gwanda Mutare Murambinda Gutu Masvingo Birchenough Bridge Chipinge Ngundu West Nicholson Nyamapanda Murehwa Chinhoyi Harare Kadoma Mutoko Checheche Chiredzi 18. 1– 21. 5% 産婦人科診療所 Beitbridge Source: Cowan FM, Chabata ST, Musemburi S, Fearon E, Davey C, Ndori-Mharadze T et al. Strengthening the scale up and uptake of effective interventions for sex workers for population impact in Zimbabwe. J Int AIDS Soc. [In press].
法を 女性人口比で調整 60 81% 78% 67% 64%")
ジンバブエにおける女性セックスワーカーのHIVケアカスケード達成率、 2011、2013、2016/2017/2018年 100 90% 80 Respondent-driven sampling (RDS)法を 女性人口比で調整 60 81% 78% 67% 64% 58% 59% 54% 52% 48% 42% 40 29% 32% 20 0 HIV陽性 率 2011: 3 sites (n = 836) 73% 自らの感染を 知っている HIV 陽性者 2013: 14 sites (n = 2722) 抗レトロウイ ルス治療を受 けているHIV 陽性者 体内のウイ ルス量が抑 制されている HIV陽性者 2016/2017/2018: 19 sites (n = 5390) Source: Cowan FM, Chabata ST, Musemburi S, Fearon E, Davey C, Ndori-Mharadze T et al. Strengthening the scale up and uptake of effective interventions for sex workers for population impact in Zimbabwe. J Int AIDS Soc. [In press].
Pr. EP勧告に対する各国の採用およびガイドライ ン策定状況、2018年 勧告を採用、ガイドラインを実施 勧告を採用、ガイドラインは未決定 勧告を採用、ガイドラインを策定 勧告の採用は未決定 勧告を採用せず データなし Source: 2019 National Commitments and")
世界保健機関(WHO)Pr. EP勧告に対する各国の採用およびガイドライ ン策定状況、2018年 勧告を採用、ガイドラインを実施 勧告を採用、ガイドラインは未決定 勧告を採用、ガイドラインを策定 勧告の採用は未決定 勧告を採用せず データなし Source: 2019 National Commitments and Policy Instrument; Hodges-Mameletzis I, Dalal S, Msimanga-Radebe B, Rodolph M, Baggaley R. Going global: the adoption of the World Health Organization’s enabling recommendation on oral pre-exposure prophylaxis for HIV. Sex Health. 2018; 15(6): 489 -500.

ゲイ男性など男性とセックスをする男性の出生地別新規HIV感染診断件数、オーストラ リア・ニューサウスウェールズ州、2014年 1月~ 2019年 3月 300 250 件数 200 150 100 50 0 2014 2015 オーストラリア 2016 アジア 2017 2018 Jan–Mar 2019 その他 北米、英国、アイルランド、ニュージーランド Source: New South Wales HIV strategy 2016– 2020 data report: Quarter 1, 2019. Sydney: New South Wales Ministry of Health; 2019.

優先15カ国における自発的男性器包皮切除の年間実施件数、2008 -2018年 4 500 000 4 000 3 500 000 3 000 自発的男性器 包皮切除の実 施件数 2 500 000 2 000 1 500 000 1 000 500 0 2008 Botswana South Africa 2009 Eswatini South Sudan* 2010 Ethiopia Uganda 2011 Kenya 2012 Lesotho 2013 2014 Malawi United Republic of Tanzania 2015 Mozambique Zambia *South Sudan has only recently initiated a pilot voluntary medical male circumcision programme, and data were reported for the first time in 2018. This is the reason for low numbers. Source: 2019 Global AIDS Monitoring. 2016 2017 Namibia Zimbabwe 2018 Rwanda

優先12カ国における自発的男性器包皮切除件数の年齢別割合、2018年 Botswana Eswatini Ethiopia Kenya Lesotho Mozambique Namibia Rwanda South Sudan United Republic of Tanzania Zambia Zimbabwe 0 10 20 30 40 50 60 70 80 90 Per cent 10歳未満 Source: 2019 Global AIDS Monitoring. 10– 14歳 15– 19 歳 20– 24歳 25– 49歳 50歳 以上 100
の実施の有無によるHIV感染 率の減少モデル、ケニア西部シアヤ郡、 1985– 2040年 2. 0 1. 8 1. 6 1. 4 100人年あた りの成人HIV")
抗レトロウイルス治療および男性器包皮切除(VMMC)の実施の有無によるHIV感染 率の減少モデル、ケニア西部シアヤ郡、 1985– 2040年 2. 0 1. 8 1. 6 1. 4 100人年あた りの成人HIV 感染率モデル 1. 2 1. 0 0. 8 0. 6 0. 4 0. 2 0 1985 1990 1995 2000 2005 抗レトロウイルス治療とVMMCをともに実施(シアヤの対策) VMMCのみ(抗レトロウイルス治療受けず) 2010 2015 2020 2025 2030 2035 2040 抗レトロウイルス治療のみ(VMMC実施せず) 介入なし(抗レトロウイルス治療もVMMCも実施しない場合のモデル) Source: Bershteyn A, Akullian AN, Klein DJ, Jewell BL, Mutai KK, Mwalili SM. Scale-up of ART and VMMC explains a two-fold decline in HIV incidence in western Kenya. Conference on Retrovirology and Opportunistic Infections (CROI), Seattle, 4– 7 February 2019. Abstract 1087.
 対象 65 054 62")
AIDSFree Mozambique Projectによる自発的男性器包皮切除の実施件数と年齢層別実績、 モザンビークのマニカ州およびテテ州、2015– 2017会計年度 2015 2016 2017 (fiscal year) 対象 65 054 62 166 95 296 包皮切除実施件数 21 824 35 389 100 636 実施率 34% 57% 105% 15– 29歳の男性の割合 48% 50% 58% 48% 54% 60% 15歳以上の男性の割合 Source: USAID, PEPFAR. Systematically coordinating VMMC supply and demand: a success story. Washington (DC): USAID; October 2018.

自発的男性器包皮切除の実施件数および 15– 29歳の占める割合、マラウィのチ クワワ県、チョロ県、ゾンバ県、 2017– 2018年 10 000 76% 67% 70 69% 8000 64% 7000 54% 6000 60 50 47% 51% 42% 5000 41% 40 32% 4000 30 3000 20 2000 10 1000 0 0 Oct 2017 Nov 2017 Dec 2017 Jan 2018 Feb 2018 自発的男性器包皮切除の実施件数 Mar 2018 Apr 2018 May 2018 Jun 2018 15– 29歳の割合(%) Source: Musiige A, Kawale J, Twahirwa W, Chilembo A, Sakanda S, Mwandi Z et al. Increasing uptake of VMMC: lessons from AIDSFree Malawi. Arlington (VA): Strengthening High Impact Interventions for an AIDS-free Generation (AIDSFree) Project; 2019. Jul 2018 Aug 2018 Sep 2018 Per cent 9000 80

GLOBAL AIDS UPDATE 2019 THE CASCADE FROM HIV TESTING TO VIRAL SUPPRESSION HIV検査から治療開始を経て ウイルス量抑制に至る カスケード
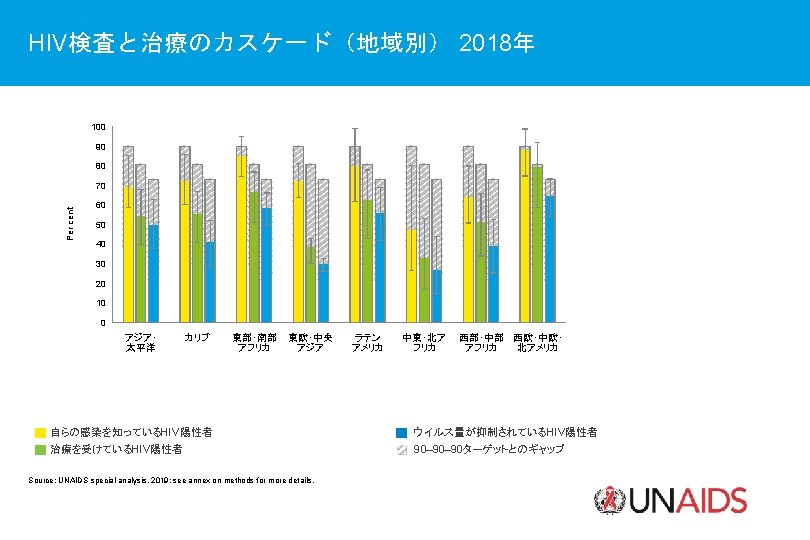
![HIV検査と治療カスケード、世界の状況、 2015– 2018年 79% 73% 76% [67– 92%] 70% [62– 86%] [65– 89%] [59–](http://slidetodoc.com/presentation_image_h2/b4fcc953457fc6d01192223c9309313e/image-39.jpg "HIV検査と治療カスケード、世界の状況、 2015– 2018年 79% 73% 76% [67– 92%] 70% [62– 86%] [65– 89%] [59–")
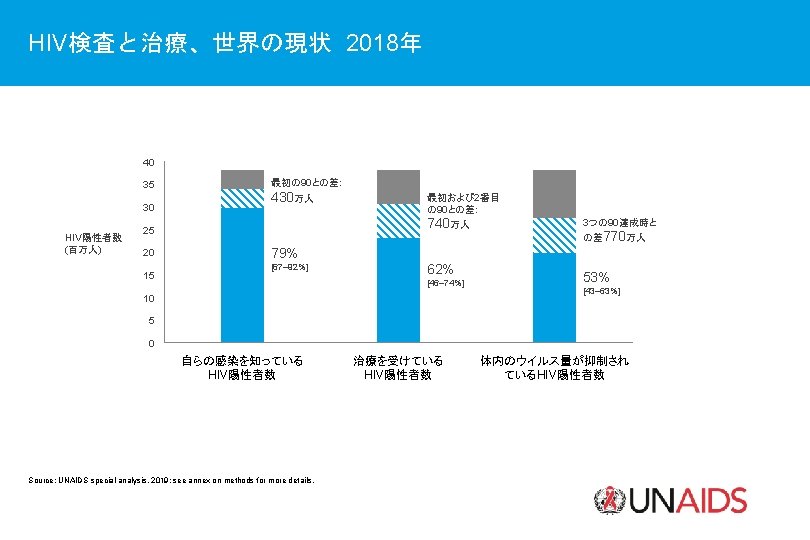
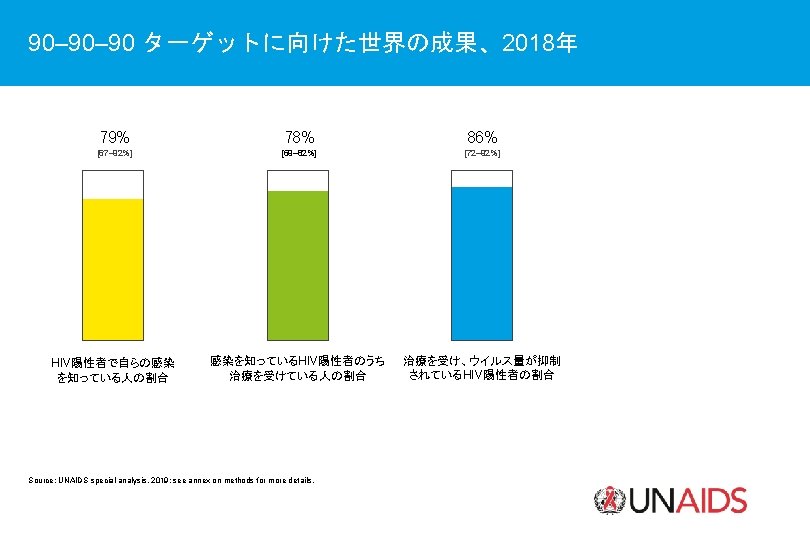
HIV検査と治療カスケード、世界の状況、 2015– 2018年 79% 73% 76% [67– 92%] 70% [62– 86%] [65– 89%] [59– 82%] 62% 57% [46– 74%] 53% 48% [39– 63%] [43– 69%] [35– 57%] 53% 49% [43– 63%] 44% [40– 58%] 39% [36– 52%] [32– 47%] 自らの感染を知っている HIV陽性者数 2015 治療を受けているHIV 陽性者数 2016 Source: UNAIDS special analysis, 2019; see annex on methods for more details. 2017 体内のウイルス量が抑制され ている HIV陽性者数 2018
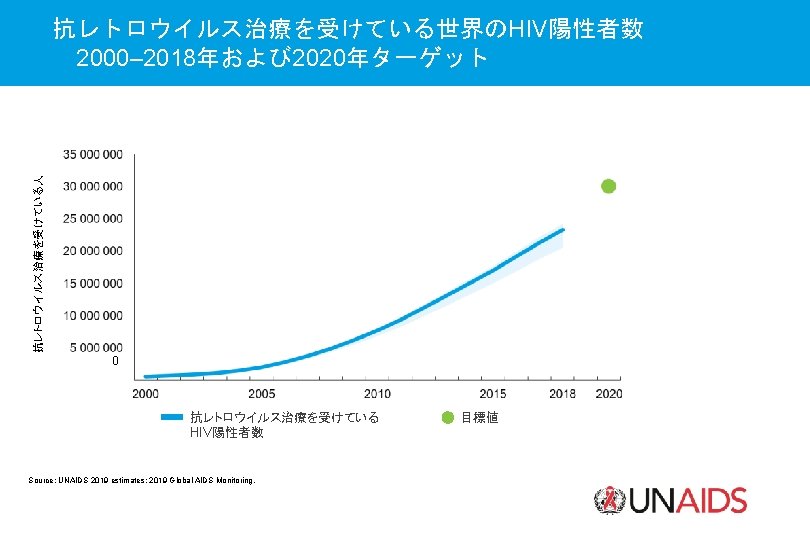

Number of children on antiretroviral therapy 抗レトロウイルス治療を受けている世界のHIV陽性の子供の数 2000– 2018年および 2020年ターゲット 0 抗レトロウイルス治療を受けているHIV 陽性の子供の数 Source: UNAIDS 2019 estimates; 2019 Global AIDS Monitoring. 目標値
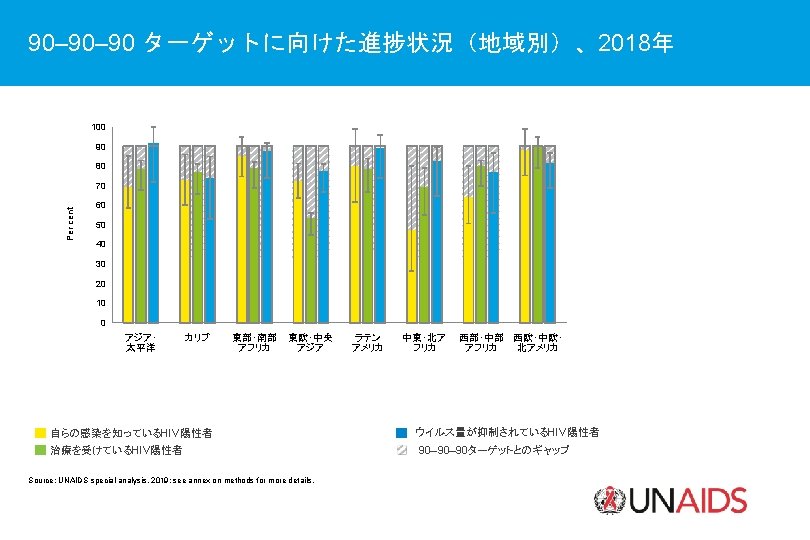
、2018年 90 -90 -90ターゲットを達成した国もしくは達成に近づいている国、直近のデータから(a, b, c) 90% 以上を 達成 ほぼ達成 (85– 89%) 最初の")
90– 90ターゲットに向けた進捗状況(国別)、2018年 90 -90 -90ターゲットを達成した国もしくは達成に近づいている国、直近のデータから(a, b, c) 90% 以上を 達成 ほぼ達成 (85– 89%) 最初の 90 2番目の 90 Botswana Cabo Verde Denmark Eswatini Finland Guyana Hungary Ireland Lebanon Malawi Namibia Netherlands Norway Algeria Austria Botswana Brunei Darussalam Cabo Verde Cambodia Comoros Czechia Democratic Republic of the Congo Denmark Eswatini France Germany Iceland Rwanda Kiribati South Africa Thailand United Kingdom Zimbabwe Algeria Brazil Comoros Kuwait Mali Mauritius Mexico Burkina Faso Congo Côte d'Ivoire France Germany Israel Kazakhstan Kenya Lao People's Democratic Republic Lesotho Luxembourg Malaysia Papua New Guinea Portugal Romania Serbia Spain Zambia Cuba Haiti Honduras Ireland Italy Luxembourg Malawi Mauritania Mongolia Morocco Suriname Uganda Zambia Source: UNAIDS 2019 estimates; 2018 Global AIDS Monitoring. HIV陽性者全体 のうちのウイル ス抑制 3つの 90すべて を達成 3番目の 90 Monaco Namibia Netherlands North Macedonia Portugal Qatar Rwanda Samoa Australia Botswana Brazil Bulgaria Cambodia China Croatia Denmark Morocco Myanmar Namibia Netherlands Saudi Arabia Seychelles Spain Sweden Saudi Arabia Estonia Switzerland Senegal Solomon Islands Spain Switzerland United Kingdom United Republic of Tanzania Zimbabwe Eswatini France Germany Iceland Ireland Thailand Ukraine United Kingdom Botswana Denmark Eswatini Namibia Netherlands United Kingdom Austral Botswana Cambodia Denmark Eswatini France Germany Iceland 達成 (73% 以上) Kuwait Lebanon Lesotho Monaco Montenegro Austria Barbados Comoros Ecuador El Salvador Finland Georgia Italy Lao People's Democratic Republic Luxembourg Malawi Malta Mexico North Macedonia Oman Rwanda Slovakia South Africa Ireland Namibia Netherlands Rwanda Spain Thailand United Kingdom Suriname Uganda United Republic of Tanzania Uruguay Comoros Croatia Finland Italy Luxembourg Malawi Myanmar ほぼ達成 (65– 72%) Notes: ª Selected data for western and central Europe provided by the European Centres for Disease Control and Prevention Dublin Declaration reporting. All estimates are for 2018 except as follows: for 2016: Austria, Denmark, France, Italy and Spain; for 2017: Germany, Israel, Luxembourg, Malta, Netherlands, Portugal, Sweden and the United Kingdom. b Estimates are for citizens only for Kuwait and Oman. c Published estimates of 90– 90 and viral load suppression among people living with HIV are available at AIDSinfo. org for years prior to 2018 for Bosnia and Herzegovina, Canada, India, Japan, Singapore, and the United States of America. Estimates of people living with HIV or 90– 90 and viral load suppression coverage were not available at the time of publication for Andorra, Argentina, Bahamas, Bahrain, Belgium, Burundi, Chad, Colombia, Costa Rica, Cyprus, Democratic People’s Republic of Korea, Djibouti, Egypt, Fiji, Gabon, Greece, Guinea-Bissau, Iraq, Jordan, Latvia, Libya, Liechtenstein, Lithuania, Maldives, the Marshall Islands, Micronesia (Federated States of), Nauru, New Zealand, Niue, Palau, Peru, Poland, the Republic of Korea, the Russian Federation, San Marino, Slovenia, Somalia, the Syrian Arab Republic, Timor-Leste, Tonga, Trinidad and Tobago, Turkey, Turkmenistan, Tuvalu, the United Arab Emirates, Uzbekistan, Vanuatu, Venezuela (Bolivarian Republic of), Viet Nam and Yemen.
がついている国は、調査ではなくプログラムからのデータを使用(数値が高めになる傾向がある) Cambodia* Cameroon Czechia* Panama*")
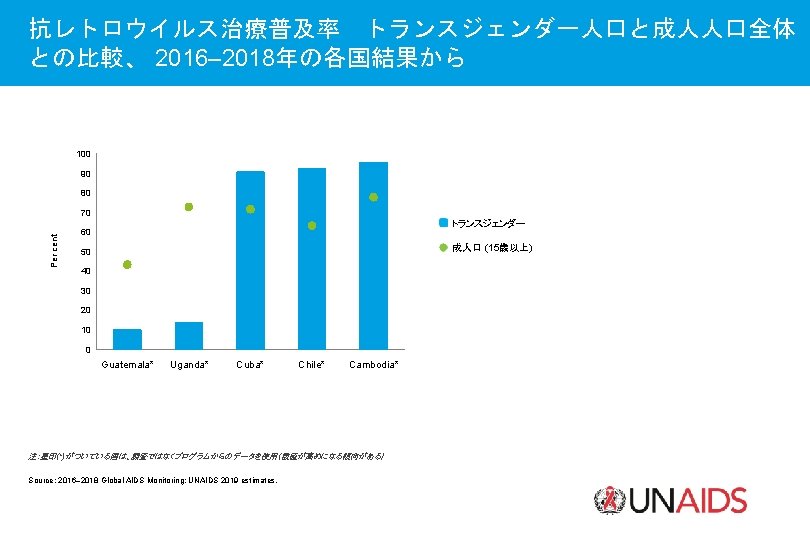
Source: 2016– 2018 Global AIDS Monitoring; UNAIDS 2019 estimates. 注:星印(*)がついている国は、調査ではなくプログラムからのデータを使用(数値が高めになる傾向がある) Cambodia* Cameroon Czechia* Panama* Mongolia* Chile* United Kingdom Cuba* Netherlands Germany Ireland Luxembourg France Australia Zimbabwe* Spain Botswana Finland ゲイ男性など男性とセックスをする男性 Uganda* Kenya Malaysia* Bosnia and Herzegovina* Ukraine Barbados* Guatemala* South Africa Paraguay Central African Republic 100 Viet Nam Togo* Ghana Per cent 抗レトロウイルス治療普及率 ゲイ男性など男性とセックスをする男性 と成人男性人口全体との比較、 2016– 2018年の各国結果から 成人男性 (15歳以上) 90 80 70 60 50 40 30 20 10 0
がついている国は、調査ではなくプログラムからのデータを使用(数値が高めになる傾向がある) Spain France Estonia Uganda*")
Source: 2016– 2018 Global AIDS Monitoring; UNAIDS 2019 estimates 注:星印(*)がついている国は、調査ではなくプログラムからのデータを使用(数値が高めになる傾向がある) Spain France Estonia Uganda* Luxembourg United Kingdom Kenya Tajikistan* Finland Viet Nam 注射薬物使用者 Mauritius Belarus Ukraine Malaysia Romania Bangladesh* Cambodia* Iran (Islamic Republic of) 100 Myanmar Bosnia and Herzegovina Togo* Per cent 抗レトロウイルス治療普及率 注射薬物使用者と成人人口全体との比較、 2016– 2018年の各国結果から 成人(15歳以上) 90 80 70 60 50 40 30 20 10 0
 セックスワーカー 90 80 Per cent 70 60")
抗レトロウイルス治療普及率 セックスワーカーと成人人口全体との比 較、 2016– 2018年の各国結果から 100 成人(15歳以上) セックスワーカー 90 80 Per cent 70 60 50 40 30 20 10 注:星印(*)がついている国は、調査ではなくプログラムからのデー タを使用(数値が高めになる傾向がある) Source: 2016– 2018 Global AIDS Monitoring; UNAIDS 2019 estimates. Cameroon Malawi* Botswana Cuba* Cambodia* Chile* South Sudan* Tajikistan* Kenya Zimbabwe Angola Rwanda Bolivia (Plurinational State of)* Ukraine Togo* South Africa Viet Nam Senegal Guatemala Sao Tome and Principe 0
 の戸別訪問 介入の概念図 CHi. PS:コミュニティ のHIVケア提供者 戸別訪問による介入 HIV陽性者への 訪問を継続 HIV検査、再検査を含む クリニック")
Pop. ART研究におけるコミュニティHIVケア提供者 (CHi. Ps) の戸別訪問 介入の概念図 CHi. PS:コミュニティ のHIVケア提供者 戸別訪問による介入 HIV陽性者への 訪問を継続 HIV検査、再検査を含む クリニック との連携 Source: Hayes RJ, Donnell DJ, Floyd S, Mandla N, Bwalya, J, Shanaube K et al. Impact of universal testing and treatment in Zambia and South Africa: HPTN 071(Pop. ART). Conference on Retroviruses and Opportunistic Infections (CROI), Seattle, 4– 7 March 2019. Abstract 92.
研究における介入対象コミュニティ(arms AとBを結合)と対照 群(arms C)の年齢別、性別抗レトロウイルス治療普及率 南アフリカおよびザンビア、 2017年 100 90 80 Per cent")
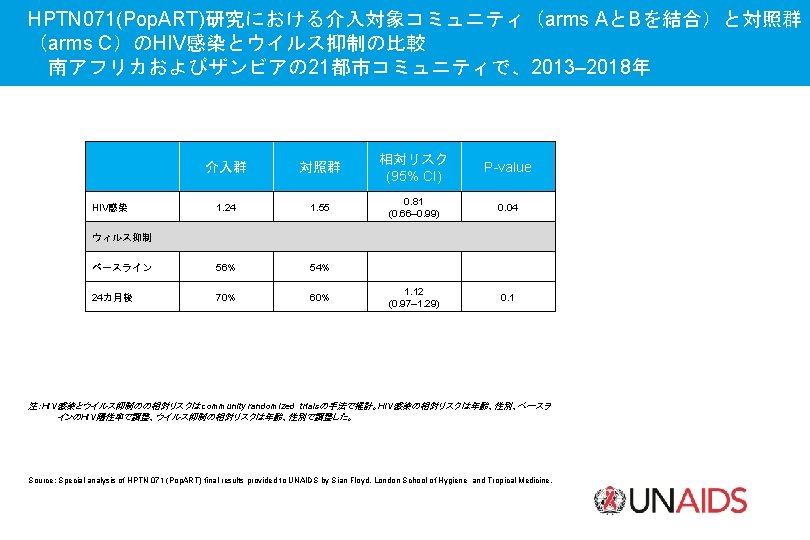
HPTN 071 (Pop. ART)研究における介入対象コミュニティ(arms AとBを結合)と対照 群(arms C)の年齢別、性別抗レトロウイルス治療普及率 南アフリカおよびザンビア、 2017年 100 90 80 Per cent 70 90– 90 target = 81% 60 50 40 30 20 10 0 15– 17 18– 19 20– 24 25– 29 30– 34 35– 39 40– 44 45– 49 50– 54 55– 59 60– 64 65+ 年齢 男性 女性 Source: Special analysis of HPTN 071 (Pop. ART) final results provided to UNAIDS by Sian Floyd, London School of Hygiene and Tropical Medicine.

GLOBAL AIDS UPDATE 2019 ELIMINATING MOTHER-TO-CHILD TRANSMISSION OF HIV母子感染をなくす
の新規HIV感染数、世界全体、2000– 2018年および 2020 年ターゲット Number of new HIV child infections 800 000 700")
子供(0 -14歳)の新規HIV感染数、世界全体、2000– 2018年および 2020 年ターゲット Number of new HIV child infections 800 000 700 000 600 000 500 000 400 000 300 000 200 000 100 0 2000 2005 新規HIV感染 Source: UNAIDS 2019 estimates. 2010 2015 ターゲット 2018 2020
 子供の新規HIV感染 40 000 100 90 35 000 80 30 000")
子供の新規HIV感染数と母子感染予防普及率、ウガンダ、1990 -2018年 垂直感染予防のために抗レトロウイルス薬 を受けているHIV陽性の妊婦(%) 子供の新規HIV感染 40 000 100 90 35 000 80 30 000 70 25 000 60 20 000 50 40 15 000 30 10 000 20 5000 10 0 0 1992 1994 1996 1998 2000 2002 抗レトロウイルス薬を受けている妊婦 Source: UNAIDS 2019 estimates. 2004 2006 2008 2010 2012 2014 子供の新規HIV感染 2016 2018

GLOBAL AIDS UPDATE 2019 CONFRONTING STIGMA AND DISCRIMINATION スティグマと差別に立ち向かう

Source: Population-based surveys, 2000– 2018. Cameroon Congo Nigeria Côte d’Ivoire Senegal Guinea-Bissau Ghana Eswatini Rwanda Kenya Lesotho Malawi Zimbabwe Mozambique Uganda Ethiopia Mauritania Armenia Kazakhstan Belize Guyana Haiti Cambodia Nepal Viet Nam Mongolia Per cent 店主がHIV陽性の店では野菜を買わないと答えた人(15 -49歳)の割合(%)、 2000– 2018年 100 90 80 70 60 50 40 30 20 10 0
の割合(%)、 2014– 2018年 100 90 80 Per cent 70 60 50 40 30")
HIV陽性者に対し差別的な態度があると答えた人(15– 49歳)の割合(%)、 2014– 2018年 100 90 80 Per cent 70 60 50 40 30 20 10 アジア・太平洋 カリブ 東部・南部アフリカ 東欧・中央アジア Burundi Congo Nigeria Côte d’Ivoire Mali Senegal Sierra Leone Mauritania Guinea Armenia Albania Tajikistan South Africa Malawi Zimbabwe Uganda Angola Ethiopia Belize Haiti Thailand India Nepal Lao People’s Democratic Republic Timor-Leste Philippines 0 西部・中部アフリカ 注:差別的な態度は以下の 2つの質問に対する「No」の回答から判断:(1)店主がHIV陽性であることをあなたが知っている店で野菜を買いますか;(2)HIV陽性の子供はHIV陰性の子供が いる学校に通えるようにすべきだと思いますか。 Source: Population-based surveys, 2014– 2018, countries with available data.
の割合( %)、2013– 2018年 0– 24% 注: 25– 49% 50– 74% 75– 100% No")
店主がHIV陽性の店では野菜を買わないと答えた人(15 -49歳)の割合( %)、2013– 2018年 0– 24% 注: 25– 49% 50– 74% 75– 100% No data Algeria, Bangladesh, Egypt, El Salvador, Guinea, Kazakhstan, Kyrgyzstan, Panama, Paraguay, the Philippines, the Sudan, Tajikistan, Turkmenistan, Uruguay, Yemen and Viet Namのデータは女性の回答のみ Source: Population-based surveys, 2013– 2018.

身体的暴力委 性的暴力 Source: Literature review by UNAIDS and the Key Populations Program of the Center for Public Health and Human Rights, Johns Hopkins University. See references at the end of the chapter for details. Zimbabwe Dominican Republic Cameroon Burundi Dakha (Bangladesh) Armenia Uganda Mexico Metro Manila (Philippines) Croatia Zambia Abidjan (Côte d’Ivoire) Burkina Faso Iran (Islamic Republic of) Eswatini China Mombasa (Kenya) Gambia Phnom Penh (Cambodia) Mongolia Guyana Ethiopia Guinea Jamaica United States of America Nepal Vancouver (Canada) Papua New Guinea Tete (Mozambique) Benin Andhra Pradesh (India) Cape Town (South Africa) Pakistan Russian Federation Fiji Sri Lanka Per cent 身体的、性的暴力を経験したことがあると答えているセックスワーカー の割合(%)、2014– 2018年 100 90 80 70 60 50 40 30 20 10 0
、2014– 2018年 100 90 80 Per cent 70 60 50 40 30 20")
身体的、性的暴力を経験したことがあると答えているゲイ男性など男性 とセックスをする男性の割合(%)、2014– 2018年 100 90 80 Per cent 70 60 50 40 30 20 10 身体的暴力 性的暴力 Source: Literature review by UNAIDS and the Key Populations Program of the Center for Public Health and Human Rights, Johns Hopkins University. See references at the end of the chapter for details. Tajikistan Mongolia India United States of America Tijuana (Mexico) Jamaica United Republic of Tanzania Abidjan (Côte d’Ivoire) Thailand San Salvador (El Salvador) Brazil Burkina Faso Israel Nairobi (Kenya) Eswatini Kampala (Uganda) China 0
、2014– 2018年 100 90 80 Per cent 70 60 50 40 30 20")
身体的、性的暴力を経験したことがあると答えているトランスジェン ダーの人たちの割合(%)、2014– 2018年 100 90 80 Per cent 70 60 50 40 30 20 10 0 United States of America Portugal 身体的暴力 Ho Chi Minh (Viet Nam) Brazil Jamaica Beirut (Lebanon) Argentina Cambodia Canada 性的暴力 Source: Literature review by UNAIDS and the Key Populations Program of the Center for Public Health and Human Rights, Johns Hopkins University. See references at the end of the chapter for details. Italy

同性間の合意に基づく性関係を犯罪としている国の数、世界全体、1969 – 2018年 160 140 120 100 Number of UN Member States 80 60 40 20 0 1969 アフリカ アジア 1975 1980 ヨーロッ パ 1985 1990 ラテンアメリカ・カリブ 1995 2000 2005 北アメリカ 2010 2015 2018 オセアニア Source: Yang D. Global trends on the decriminalisation of consensual same-sex sexual acts (1969– 2019). In: Mendos LR. State-sponsored homophobia 2019. Geneva: ILGA; March 2019.
、1969– 2018年 80 70 60 Per cent 50 40 30 20 10 0")
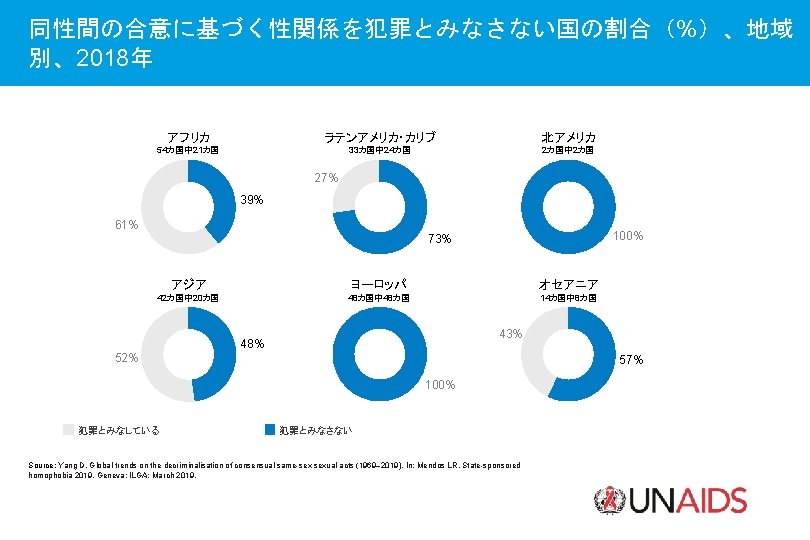
同性間の合意に基づく性関係を犯罪としている国の世界全体に占める人 口割合(%)、1969– 2018年 80 70 60 Per cent 50 40 30 20 10 0 1969 アフリカ アジア 1975 1980 ヨーロッ パ 1985 1990 ラテンアメリカ・カリブ 1995 2000 2005 北アメリカ 2010 2015 2018 オセアニア Source: Yang D. Global trends on the decriminalisation of consensual same-sex sexual acts (1969– 2019). In: Mendos LR. State-sponsored homophobia 2019. Geneva: ILGA; March 2019.
 Lack of information")
不当な扱いに対する患者の苦情、モザンビークの 52保健医療施設、2013 年 3月-2019年 5月 Disrespectful treatment Staff absenteeism/tardiness Other (infrastructure) Lack of information regarding patient's health (eg. , diagnosis, treatment, test results) Clinical negligence Lack of medical/surgical supplies Lack of medicines Other (provider behaviour) Violation of privacy Other (equipment and medical supplies) Lack of sufficient beds/mattresses Lack of information regarding health services Lack of machines/machines broken Lack of hygiene in the health facility Insufficient dispensing of medicines lllicit charge/bribery Failure to fast-track specific populations (elderly, disabled, those living with HIV) Lack of rapid response to urgent case Facility does not have electricity Lack of mosquito nets Facility does not have bathrooms Facility does not have water Violation of confidentiality Discrimination Lack of ambulance/fuel Distance between community and health services Lack of porches, shade, benches Lack of access for physically disabled Other (medicine) Precarious buildings Lack of informed consent Expired medicines Refusal of care (outside catchment) Theft or sale of public goods Ambulance used for unrelated activities 解決事例 対応中の事例 0 200 400 Source: Programme data from the Moçambique Right to Health Program, March 2013–May 2019, provided to UNAIDS on 11 June 2019. 600 800 1000 1200

人口全体と障害者人口のHIV陽性率比較、西部・中部アフリカの国から、 2016– 2018年 10 9 8 Per cent 7 6 5 4 3 2 1 0 Burkina Faso 人口全体 Cabo Verde 障害者人口 Guinea-Bissau Niger 障害者女性 Senegal 障害者男性 Source: Global Fund to Fight AIDS, Tuberculosis and Malaria, Humanity & Inclusion, West Africa Federation of Persons with Disabilities. Une population oubliée: résultats des études bio-comportementales [A forgotten population: results from the biobehavioural studies]. Power Point presentation. 2019.

HIV予防と保健医療サービスへのアクセス、暴力被害率、西部・中部ア フリカの 5カ国から、2016– 2018年 60 50 Per cent 40 30 20 10 0 Burkina Faso 保健医療サービスへのアクセス Cabo Verde Guinea-Bissau HIV予防への参加 Niger Senegal 暴力を受けた経験 Source: Global Fund to Fight AIDS, Tuberculosis and Malaria, Humanity & Inclusion, West Africa Federation of Persons with Disabilities. Une population oubliée: résultats des études bio-comportementales [A forgotten population: results from the biobehavioural studies]. Power Point presentation. 2019.

GLOBAL AIDS UPDATE 2019 MEETING THE NEEDS OF WOMEN AND YOUNG PEOPLE 女性および若い人たちのニーズに応える
で、過去 12か月以内に親密なパート ナーから身体的、性的暴力を受けた人の割合(%)、以前の調査(2004– 2012年)と 最近の調査(2011– 2018年)の比較 60 59. 3 50 44. 3 42.")
既婚およびパートナーがいる女性(15– 49歳)で、過去 12か月以内に親密なパート ナーから身体的、性的暴力を受けた人の割合(%)、以前の調査(2004– 2012年)と 最近の調査(2011– 2018年)の比較 60 59. 3 50 44. 3 42. 8 42. 0 40 35. 3 34. 6 30 28. 6 27. 7 25. 5 28. 8 20 23. 0 19. 2 16. 0 18. 0 14. 3 15. 4 10. 9 10 9. 0 14. 5 17. 0 14. 9 13. 9 29. 9 26. 7 26. 2 36. 8 33. 3 27. 4 31. 4 30. 3 27. 2 20. 7 26. 9 26. 1 21. 5 19. 9 19. 0 15. 5 13. 7 13. 9 15. 2 11. 7 10. 0 11. 2 29. 6 24. 3 22. 1 19. 5 22. 0 22. 4 33. 3 31. 7 30. 4 39. 7 37. 4 14. 6 14. 1 14. 7 13. 8 10. 8 11. 0 8. 1 7. 1 5. 5 6. 5 5. 1 Source: Population-based surveys, 2004– 2018. Nigeria Democratic Republic of the Congo Mali Cameroon Jordan Mexico Peru Colombia Tajikistan South Africa Zimbabwe Zambia Uganda United Republic of Tanzania Rwanda Mozambique Malawi Kenya Haiti Dominican Republic Timor-Leste Philippines Pakistan Nepal India Cambodia Bangladesh 0
の男女別新規HIV感染数、世界全体、1990– 2018年 1 000 Number of new HIV infections 900 000 800 000")
若年層(15– 24歳)の男女別新規HIV感染数、世界全体、1990– 2018年 1 000 Number of new HIV infections 900 000 800 000 700 000 600 000 500 000 400 000 300 000 200 000 100 0 1990 1995 男性 Source: UNAIDS 2019 estimates. 2000 女性 2005 2010 2015 2018
の男女別新規HIV感染数、東部・南部アフリカ、 1990– 2018年 Number of new HIV infections 600 000 500 000 400")
若年層(15– 24歳)の男女別新規HIV感染数、東部・南部アフリカ、 1990– 2018年 Number of new HIV infections 600 000 500 000 400 000 300 000 200 000 100 0 1990 1995 男性 Source: UNAIDS 2019 estimates. 2000 女性 2005 2010 2015 2018
の男女別新規HIV感染数、西部・中部アフリカ、 1990– 2018年 200 000 Number of new HIV infections 180 000 160")
若年層(15– 24歳)の男女別新規HIV感染数、西部・中部アフリカ、 1990– 2018年 200 000 Number of new HIV infections 180 000 160 000 140 000 120 000 100 000 80 000 60 000 40 000 20 000 0 1995 男性 Source: UNAIDS 2019 estimates. 2000 女性 2005 2010 2015 2018
の割合、2011– 2015年 100 90 80 Per cent 70 60 50 40 30")
教育を通じ、少なくとも一度はコンドームに関する情報を得ている若い女性( 15– 24歳)の割合、2011– 2015年 100 90 80 Per cent 70 60 50 40 30 20 10 0 Chad Congo Democratic Côte Republic d’Ivoire of the Congo 教育なし Source: Population-based surveys, 2011– 2015. Gabon 小学校 Ghana Guinea Kenya 中学校 Lesotho Liberia Mozambique Namibia Nigeria Rwanda 高校以上 Sierra United Togo Leone Republic of Tanzania Zambia
、ケ ニア、南アフリカ、ザンビアにおけるECHO研究の参加者、2015– 2018年 Cumulative probability of HIV acquistion 1. 0 10 DMPA-IM 0. 8")
3つの避妊法におけるHIV感染の確率、エスワティニ(旧スワジランド)、ケ ニア、南アフリカ、ザンビアにおけるECHO研究の参加者、2015– 2018年 Cumulative probability of HIV acquistion 1. 0 10 DMPA-IM 0. 8 DMPA-IM: ドロキシプロゲステロン酢酸筋注デポ剤 Copper IUD:銅付加子宮内避妊器具 LNG implant:レボノルゲストレル・インプラント 8 Copper IUD 6 LNG implantt 4 0. 6 2 0 0. 4 0 3 6 9 12 15 18 0. 2 0 0 3 6 9 12 15 18 Months since enrolment Number at risk DMPA-IM 2556 2555 2478 2412 2341 2077 1595 Copper IUD 2571 2539 2492 2440 2158 1656 LNG implant 2588 2587 2534 2484 2442 2166 1670 Source: Evidence for Contraceptive Options and HIV Outcomes (ECHO) Trial Consortium. HIV incidence among women using intramuscular depot medroxyprogesterone acetate, a copper intrauterine device, or a levonorgestrel implant for contraception: a randomised, multicentre, open-label trial. The Lancet. 13 June 2019.

GLOBAL AIDS UPDATE 2019 INTEGRATED, PEOPLE-CENTRED SERVICES 人を中心にした統合型サービス

HIV陽性者の結核関連死亡件数、世界全体、2000 -2017年 800 000 結核関連死亡件数 700 000 600 000 500 000 400 000 300 000 200 000 100 0 2000 2002 2004 2006 結核関連死亡件数 Source: Global tuberculosis report. Geneva: World Health Organization; 2018. 2008 2010 2012 2014 2016 2018 2020年ターゲット 2020

注射薬物使用者の肝炎対策に関する各国の状況、2019年 国の肝炎対策で注射薬物使用者には言及せず 肝炎対策へのアクセスなし 肝炎対策で注射薬物使用者に言及 Source: Access to hepatitis C testing and treatment for people who inject drugs and people in prisons—a global perspective. Geneva: World Health Organization; 2019 (https: //www. who. int/hepatitis/publications/idu-prison-access-hepatitis-c/en/).

受刑者の肝炎対策に関する各国の状況、2019年 国の肝炎対策で受刑者には言及せず H肝炎対策へのアクセスなし 国の肝炎対策で受刑者に言及 Source: Access to hepatitis C testing and treatment for people who inject drugs and people in prisons—a global perspective. Geneva: World Health Organization; 2019 (https: //www. who. int/hepatitis/publications/idu-prison-access-hepatitis-c/en/).
の割合、高速対応 35カ国 エイズ戦略計画の中でHIV陽性 女性のための子宮頸がんのスク リーニング検査と治療を推奨し ている国(2019) 国のHIV治療ガイドラインの中 でHIV陽性女性のための子宮頸 がんのスクリーニング検査と治 療を推奨している国(2019) HIVサービスと統合した形で保 健医療施設が子宮頸がんスク")
子宮頸がんスクリーニング政策とスクリーニングを受けたHIV陽性女性( 30− 49歳)の割合、高速対応 35カ国 エイズ戦略計画の中でHIV陽性 女性のための子宮頸がんのスク リーニング検査と治療を推奨し ている国(2019) 国のHIV治療ガイドラインの中 でHIV陽性女性のための子宮頸 がんのスクリーニング検査と治 療を推奨している国(2019) HIVサービスと統合した形で保 健医療施設が子宮頸がんスク リーニングを実施(2019) Angola Botswana Brazil Cameroon Chad China Côte d'Ivoire Democratic Republic of the Congo Eswatini Ethiopia Ghana Haiti India Indonesia Iran (Islamic Republic of) Jamaica Kenya Lesotho Malawi Mali Mozambique Myanmar Namibia Nigeria Pakistan Russian Federation South Africa South Sudan Uganda Ukraine United Republic of Tanzania United States of America Viet Nam Zambia Zimbabwe Source: 2019 National Commitments and Policy Instrument; population-based surveys, 2014– 2017; 2019 Global AIDS Monitoring. 子宮頸がんのスクリーニングを 受けているHIV陽性の女性(3049歳)の割合(年) 30% (2018) 35% (2016) 29% (2014) 19% (2016) 18% (2017) 27% (2016) 26% (2015) Yes すべての保健医療施設で実施 No No いくつかの保健医療施設で実施 No data 切り離して実施 データなし 最近のデータなし

モルドバのバルティにおける照会モデルから結核-HIVサービスへの移行 家庭医 エイズセ ンター 結核セン ター NGOの HIVプロ グラム NGOの 結核プ ログラ ム ソーシャル サービス エイズ セン ター 結核セン ター NGOの HIVプロ グラム NGOの 結核プ ログラ ム ソーシャ ルサービ ス Source: Access to HIV and TB prevention, treatment and care: perspective of a civil society organization and patients. Alla Yatsko, Youth Association for the Right to Live. Slide presentation, 15 May 2019.

モルドバのバルティにおける結核件数、治療成功数、死亡件数 94% 140 100 124 72% Number of people 100 90 76% 80 70 89 80 60 73 50 60 40 30 40 19 20 20 16 11 0 10 0 2016 治療症例を含む新規結核件数 2017 2018 結核関連死者数 結核治療成功率(再治療例も含む) Source: Access to HIV and TB prevention, treatment and care: perspective of a civil society organization and patients. Alla Yatsko, Youth Association for the Right to Live. Slide presentation, 15 May 2019. Per cent 120

GLOBAL AIDS UPDATE 2019 INVESTING TO END AN EPIDEMIC 流行終結に向けた投資

東部・南部アフリカにおけるHIV対策資金のドナー依存度、南アフリカ を含む場合と含まない場合、2010– 2018年 100 90 81 80 75 Per cent 70 60 59 80 77 75 58 61 61 58 54 55 80 76 73 72 58 59 50 40 30 20 10 0 2011 2012 東部・南部アフリカ 南アフリカを東部・南部アフリカ Source: UNAIDS 2019 resource availability and needs estimates. 2013 2014 2015 2016 2017 2018
 Donor 2010– 2018 Per cent change 2017– 2018")
主要援助国におけるHIV関連二国間援助支出額の増減とその増減率、米ドル換 算による2010年と 2018年、および 2017年と 2018年の比較、 HIV分野の二国間開発援助額(単位100万) Donor 2010– 2018 Per cent change 2017– 2018 Per cent change Australia -US$ 63. 4 -79% US$ 2. 8 20% Canada -US$ 44. 1 -78% US$ 4. 5 56% Denmark -US$ 89. 3 -58% -US$ 25. 8 -29% France -US$ 51. 3 -78% US$ 0. 6 5% -US$ 134. 5 -86% -US$ 0. 6 -3% Ireland -US$ 56. 2 -74% -US$ 4. 0 -17% Italy -US$ 10. 0 -88% -US$ 4. 5 -76% Japan -US$ 12. 3 -65% -US$ 0. 3 -4% -US$ 105. 0 -34% US$ 29. 5 17% Norway -US$ 49. 0 -68% US$ 0. 6 3% Sweden -US$ 49. 1 -49% US$ 9. 1 22% United Kingdom -US$ 230. 7 -39% -US$ 157. 7 -30% United States US$ 2052. 1 63% -US$ 12. 4 0% US$ 1157. 2 23% -US$ 158. 0 -3% Germany Netherlands Total Source: UNAIDS estimates, based on Kaiser Family Fund–UNAIDS collaboration on donor disbursements for HIV, 2006– 2019.

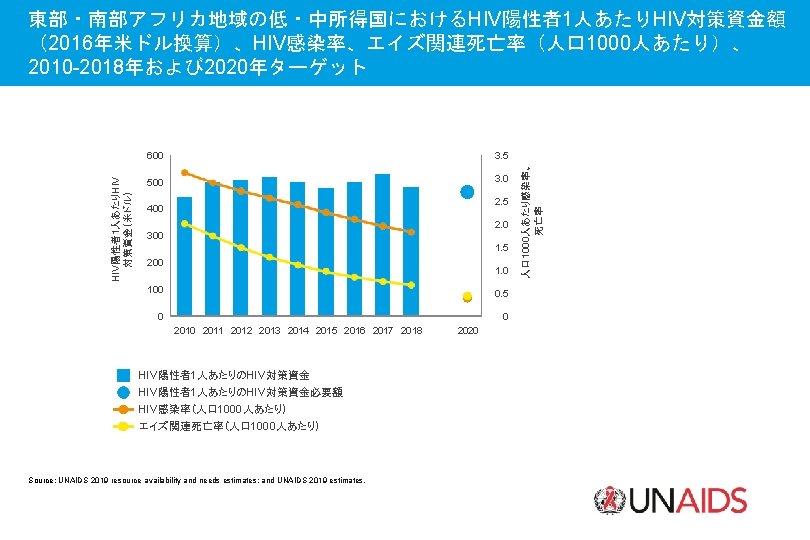
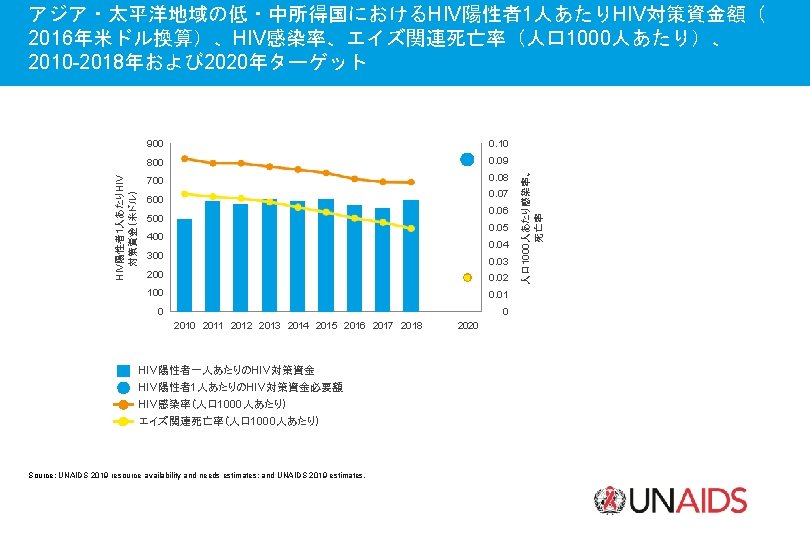
800 0. 45 700 0. 40 600 0. 35 0. 30 500 0. 25 400 0. 20 300 0. 15 200 0. 10 100 0. 05 0 0 2011 2012 2013 2014 2015 2016 2017 2018 HIV陽性者1人あたりのHIV対策資金必要額 HIV感染率(人口 1000人あたり) エイズ関連死亡率(人口 1000人あたり) Source: UNAIDS 2019 resource availability and needs estimates; and UNAIDS 2019 estimates. 2020 人口 1000人あたり感染率、 死亡率 HIV陽性者1人あたりHIV対 策資金(米ドル) 低・中所得国におけるHIV陽性者1人あたりのHIV対策資金額(2016年米ドル換算)、 HIV感染率、エイズ関連死亡率(人口 1000人あたり)、2010 -2018年および 2020年 ターゲット
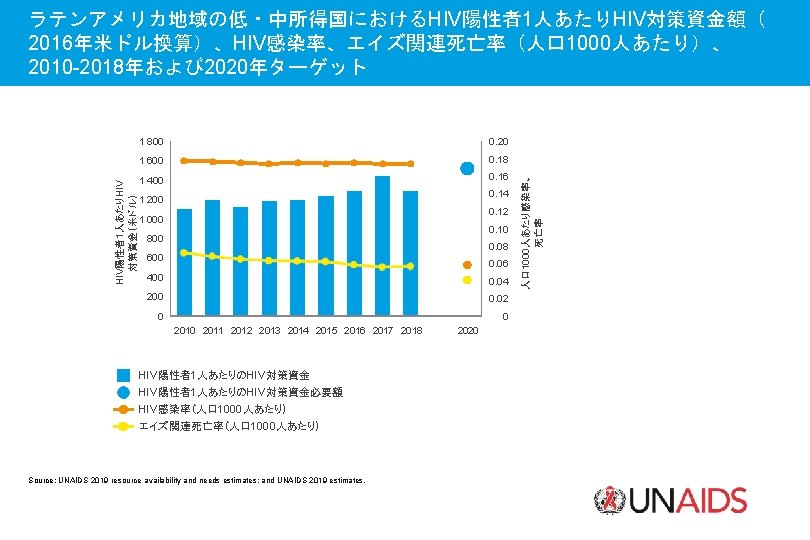
、HIV感染率、エイズ関連死亡率(人口 1000人あたり)、 2010 -2018年および 2020年ターゲット 2 000 0. 60 0. 50 1 600")
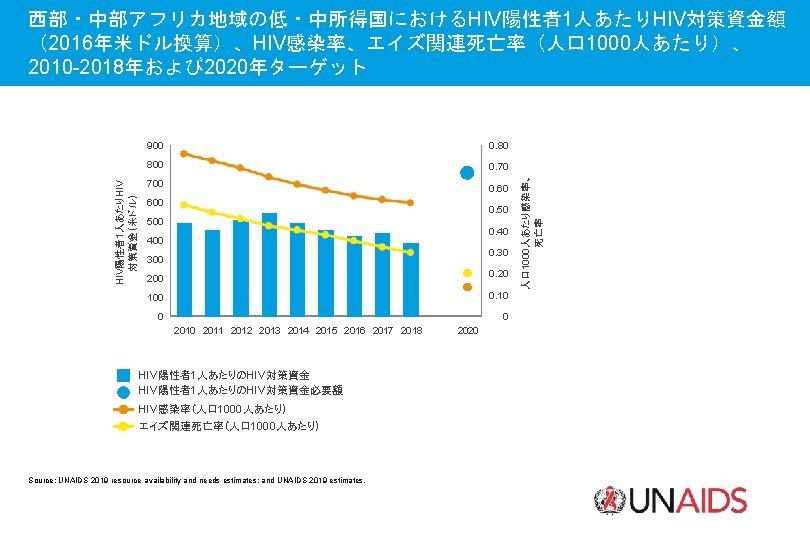
カリブ地域の低・中所得国におけるHIV陽性者1人あたりHIV対策資金額(2016年米ド ル換算)、HIV感染率、エイズ関連死亡率(人口 1000人あたり)、 2010 -2018年および 2020年ターゲット 2 000 0. 60 0. 50 1 600 1 400 0. 40 1 200 1 000 0. 30 800 0. 20 600 400 0. 10 200 0 0 2011 2012 2013 2014 2015 2016 2017 2018 HIV陽性者1人あたりのHIV対策資金必要額 HIV感染率(人口 1000人あたり) エイズ関連死亡率(人口 1000人あたり) Source: UNAIDS 2019 resource availability and needs estimates; and UNAIDS 2019 estimates. 2020 人口 1000人あたり感染率、 死亡率 HIV陽性者1人あたりHIV 対策資金(米ドル) 1 800
- Slides: 102