GLENWOOD COMMUNITY SCHOOL DISTRICT UNDERSTANDING THE CERTIFIED BUDGET

GLENWOOD COMMUNITY SCHOOL DISTRICT UNDERSTANDING THE CERTIFIED BUDGET……… By Shirley Lundgren Devin Embray

WHAT IS THE CERTIFED BUDGET? Certified Budget Includes: n All District Funds n Projected Revenues n Projected Expenditures n Certifying the Budget with Auditor n Legal Process to Allow the District to Levy Taxes

BUDGETING PROCESS Ø Ø Ø Certified Budget in April Operating Budget in Summer CERTIFIED BUDGET OPERATING BUDGET Legal Process and Spending Plan Publish proposed budget, hold hearing, adopt & certify budget All District funds Three years reported Minimal Detail Ø Ø Ø Line Item Budget is a Management Tool Related to, but not the same as the District’s Certified Budget Fund Specific – Focus on General Fund Balanced Budget Proposal Greater Detail Departmentalized


WHAT MAKES UP THE BUDGET Unspent Balance Miscellaneous Income Additional Tax Levy - Assessed To Reach Controlled Budget Level State Foundation Aid - 87. 5 % State Cost Per Pupil Uniform Tax Levy - 5. 40 * (AV/1000)

UNIFORM LEVY n UNIFORM LEVY – A uniform levy of $5. 40 per $1000 assessed valuation required of all districts. Uniform Levy - 5. 40 * (AV/1000)

FOUNDATION AID n STATE AID OR FOUNDATION BASE – The difference between the revenue raised by the foundation property tax and the state level of support or state foundation base. The state foundation base was established in 1971 at 70% of the state cost per pupil for the 1972 -73 school year. The finance law currently has the state foundation level of 87 1/2% of the regular education cost per pupil. Foundation 87. 5 % State cost per pupil

ADDITIONAL LEVY n Amount assessed through property tax to reach controlled budget level for the district. Additional Levy – assessed to reach controlled budget level

COMBINED DISTRICT COST n District cost per pupil times the weighted enrollment (includes AEA/special education/shared pupils): includes all revenues except miscellaneous income. = + + Combined District Cost Uniform Levy State foundation Aid Additional Levy

MISCELLANEOUS INCOME Miscellaneous income n All income other than revenues from the uniform property tax, state aid under the foundation plan, and the additional property tax generated through the foundation formula.

UNSPENT BALANCE Unspent Balance n A term that refers to the difference between the maximum amount a district can legally spend (authorized budget) in the previous year and the amount the district does spend. The unspent balance at the end of the fiscal year is carried forward and added to the resources for the next budget year.

AUTHORIZED BUDGET n MAXIMUM BUDGET -- Is the state foundation formula which calculates spending authority and how the spending authority is funded. The calculations are: n Total Spending Authority equals Controlled Budget plus Miscellaneous Income plus Unspent Balance. + + = Combined District Cost Misc. Income Unspent Balance Maximum Spending Authority

MAJOR FUNDS • General Fund • Management fund • PPEL • Nutrition • Activity • Debt Service • SAVE Fund • Kids Place

GENERAL FUND n This is the fund most commonly referred to when examining a district’s budget. n It pays for all costs related to instruction, which includes salaries, benefits, utilities, purchased services, textbooks, supplies, instructional materials, capital outlay, etc.

MANAGEMENT FUND n This fund pays for all insurance premiums covering our buildings, vehicles, personal liability and workers compensation. n Early retirement incentives and unemployment compensation are paid from this fund. n An additional tax levy amount is generated to pay management fund expenses.
 n n Regular PPEL $. 33 Voted PPEL -")
PHYSICAL PLANT EQUIPMENT LEVY (PPEL) n n Regular PPEL $. 33 Voted PPEL - $. 00 – We do not have. The purpose of this fund is to pay for equipment purchases over $500 and all building maintenance and repairs.

NUTRITION FUND n This fund is used to account for all of the transactions of the nutrition program. n Revenue comes from lunch and breakfast sales, ala-carte sales, catering and Federal and State funding.

ACTIVITY FUND n Fund is used to account for money received from student related co-curricular or extracurricular activities. n Money is generated through admissions, activity tickets, student fees and donations.

DEBT SERVICE FUND n This fund is used for the payment of principal and interest on general obligation bonds and any other long-term debt. n Money is generated through a tax levy.

SAVE FUND n The revenue for this fund comes from the state and is generated from state sales tax. To spend this revenue the district must have a voted Revenue Purpose Statement. n SAVE funds can be used for anything the PPEL funds can be used for which include equipment purchases over $500 and all building maintenance and repairs.

KIDS PLACE FUND n This fund is used to account for all transactions of the day care program. n Revenue comes from student daycare fees and state and federal funding.
 2.")
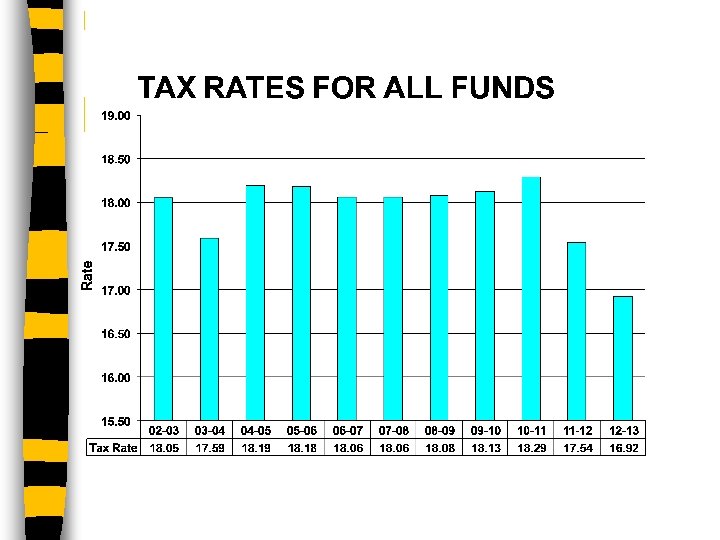
FACTORS AFFECTING 2012 -13 TAX RATE 1. Taxable Valuation (rollbacks, TIF, etc. ) 2. Enrollment (Prior Year Certified Count) 3. Allowable Growth Rate set by State 4. Special Education Deficit 5. Cash Reserve Levy 6. Debt Service Levy 7. Management Levy 8. State Wide Property Tax Relief 9. Use of SAVE Funds to reduce Debt Service Levy

TAXABLE VALUATIONS

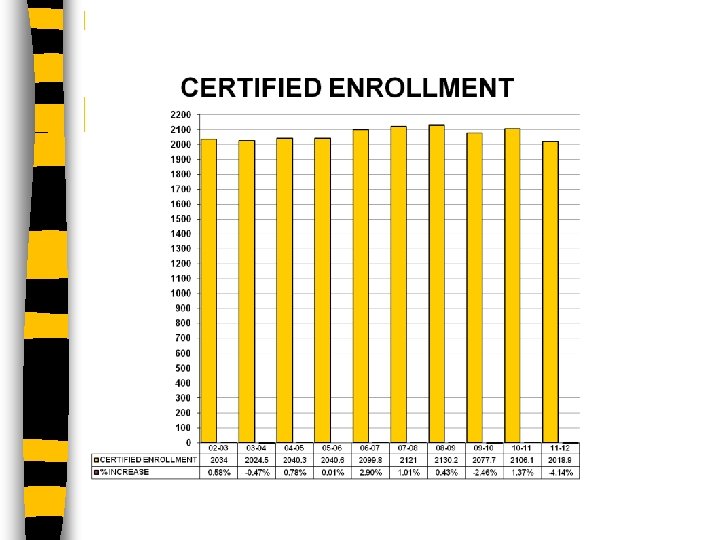
ENROLLMENTS n n n Certified Enrollment - Students are counted on October 1 st of each school year. The count includes all resident students attending our school or schools in another district or another state for whom the district pays tuition. Budget Enrollment - Certified count or enrollment of the school year preceding the budget year. Ex: 10/01/2011 = FY 13 budget year

ALLOWABLE GROWTH Year FY 13 FY 12 FY 11 FY 10 FY 09 FY 08 FY 07 FY 06 FY 05 FY 04 FY 03 FY 02 FY 01 FY 00 FY 99 Per Pupil Cost $6, 001 $5, 883 $5, 768 $5, 546 $5, 333 $5, 128 $4, 931 $4, 741 $4, 648 $4, 557 $4, 512 $4, 338 $4, 171 $4, 013 Allowable Growth 2% 0% 2% 4% 4% 4% 2% 2% 1% 4% 4% 4% 3%

SPECIAL EDUCATION DEFICIT 2011 -2012 $155, 718 2010 -2011 $300, 000 2009 -2010 $265, 586 2008 -2009 $416, 587 2007 -2008 $185, 653 2006 -2007 $181, 147 2005 -2006 $201, 774

CASH RESERVE LEVY 2012 -2013 $314, 718 2011 -2012 $582, 663 2010 -2011 $800, 000 2009 -2010 $525, 615 2008 -2009 $690, 000 2007 -2008 $459, 166 2006 -2007 $450, 000 2005 -2006 $385, 000 2004 -2005 $400, 000

DEBT SERVICE & MANAGEMENT LEVY Year FY 13 FY 12 FY 11 FY 10 FY 09 FY 08 FY 07 FY 06 FY 05 FY 04 FY 03 Management Fund $1. 50 $1. 48 $1. 17 $1. 00 $0. 29 $0. 97 $1. 14 $0. 78 $0. 79 $0. 70 $0. 71 Debt Service Fund $2. 81 $2. 98 $3. 62 $3. 83 $3. 86 $2. 48 $2. 38 $1. 91 $1. 95 $1. 86 $1. 94

PROPERTY TAX RELIEF FROM STATEWIDE PENNY - Property Tax Relief is additional state foundation aid that lowers the general fund property tax levies in districts with the highest additional property tax levy rate (lowest taxable valuation per pupil). About__districts are expected to receive the adjusted additional property tax levy aid in FY 2013.

BUDGET INDICATORS Used to Determine General Fund Strength A. Undesignated/Unreserved Fund Balance B. Solvency Ratio C. Unspent Balance D. Tax Levy History E. Revenues F. Expenditures

UNDESIGNATED/UNRESERVED FUND BALANCE, SOLVENCY RATIO & UNSPENT BALANCE Year 2010 -11 2009 -10 2008 -09 2007 -08 2006 -07 2005 -06 2004 -05 2003 -04 Unreserved Balance $ 4, 049, 504 $ 3, 204, 353 $ 3, 880, 931 $ 2, 919, 817 $ 2, 793, 347 $ 3, 196, 538 $ 2, 902, 189 $ 2, 626, 569 Solvency Ratio 17. 52% 16. 00% 16. 10% 11. 82% 12. 39% 14. 96% 10. 24% 13. 52% Unspent Balance $ 4, 232, 548 $ 3, 131, 238 $ 1, 672, 207 $ 486, 783 $ 803, 127 $ 1, 552, 184 $ 1, 675, 147 $ 1, 747, 841

UNRESERVED FUND BALANCE – Portion of the fund balance which remaining after deducting the accumulated expenditures and outstanding encumbrances.

SOLVENCY RATIO – Is a percentage figure that measures you financial health. It is calculated by dividing your undesignated fund balance by your revenues.

UNSPENT BUDGET BALANCE - The unspent balance is the difference between the district’s maximum authorized spending authority and its actual expenditures for a year in the General Fund.

REVENUE & EXPENDITURE HISTORY YEAR REVENUES EXPENDITURES 2010 -11 19, 525, 335 18, 680, 184 2009 -10 18, 350, 211 19, 026, 789 2008 -09 18, 993, 802 18, 032, 687 2007 -08 17, 839, 619 17, 713, 150 2006 -07 16, 375, 096 16, 778, 286 2005 -06 15, 932, 317 15, 826, 163 2004 -05 14, 999, 129 14, 987, 136 2003 -04 14, 638, 624 14, 224, 473 2002 -03 14, 566, 811 14, 107, 177 2001 -02 13, 852, 111 14, 060, 128 2000 -01 13, 434, 044 13, 415, 865

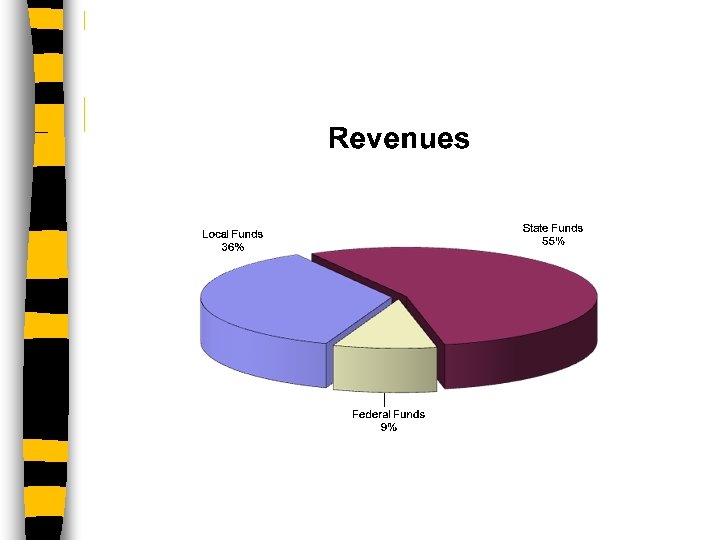
REVENUES n n n n Property Taxes State Aid Open Enrollment & Tuition In Federal Funds State Funds Rent Income Interest

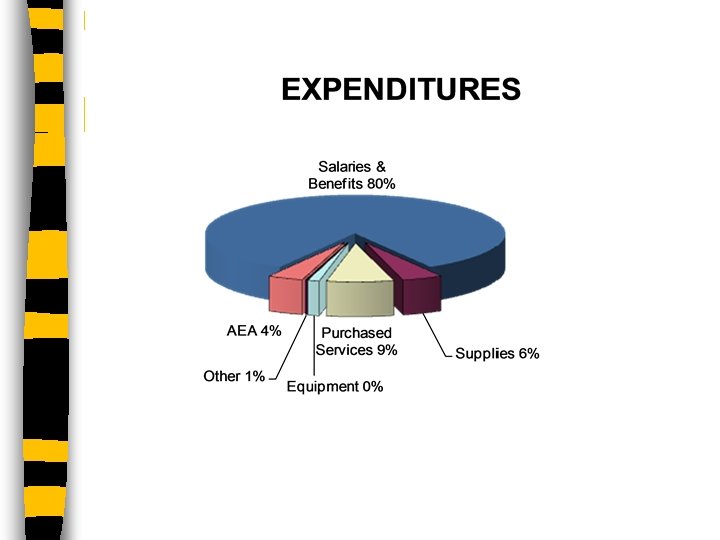
EXPENDITURES n n n n Salaries and Benefits Purchased Services Open Enrollment & Tuition Out Supplies Utilities Equipment AEA Flowthrough

QUESTIONS? ? ? PUBLICATION OF INFORMATION Opinion Tribune
- Slides: 42