Giving a good talk Darrin L Rubino Hanover

Giving a good talk Darrin L. Rubino Hanover College, Biology Department Hanover, IN 47243

Experimental Evaluation of Woody Debris Decay Dynamics in Central Appalachian Forests
 woody")
Composition and Ecology of macrofungal and myxomycete communities on oak (Quercus spp. ) woody debris in a mixed-oak forest Darrin L. Rubino 1 and Brian C. Mc. Carthy 2 1 Dept. of Biology, Hanover College, Hanover IN 2 Dept. Env. and Plant Biology, Ohio University, Athens, OH
 – Stratified Random Sample – Slope aspect")
Methods • 50 Plots (500 m 2) – Stratified Random Sample – Slope aspect – Slope position • • • CWD, trees, saplings Dominant tree – age, height Canopy cover Slope aspect Percent slope Landform Index (LI)

• Categorize plots using “slope positions” • Gradient from plot center to topographic horizon • 8 measurements Landform Index (Mc. Nab 1993)

Woody Debris • Fallen limbs and boles 10 cm diameter • Serves numerous ecological roles – Nutrient cycling – Habitat
 25 •")
Results • Species per log 30 8. 2 ± 0. 7 (SE) 25 • Spearman Rank Correlation rs = 0. 717 P < 0. 0001 • Species/m 2 0. 4 – 9. 3 sp/m 2 2. 4 ± 0. 3 (SE) sp/m 2 Number of Species 2 – 26 sp/log 20 15 10 5 0 0 5 10 15 20 Surface Area (m 2) 25 30

Mass Loss df SS MS F P Power Species 9 88. 292 9. 810 298. 48 <0. 001 >0. 999 Direction 1 0. 559 16. 99 <0. 001 0. 985 Sp Dir 9 0. 841 0. 093 2. 84 0. 003 0. 965 Position 1 0. 564 17. 17 <0. 001 0. 985 Sp Pos 9 0. 762 0. 085 2. 58 0. 006 0. 945 Dir Pos 1 0. 366 11. 14 <0. 001 0. 916 Sp Dir Pos 9 1. 260 0. 140 4. 26 <0. 001 0. 998 Time 2 249. 495 124. 747 3795. 53 <0. 001 >0. 999 Sp Time 18 16. 301 0. 906 27. 55 <0. 001 >0. 999 Dir Time 2 0. 102 0. 051 1. 55 0. 212 0. 331 18 0. 995 0. 055 1. 68 0. 036 0. 953 2 0. 669 0. 334 10. 17 <0. 001 0. 986 Sp Pos Time 18 1. 834 0. 102 3. 10 <0. 001 >0. 999 Dir Pos Time 2 0. 026 0. 0113 0. 40 0. 673 0. 114 18 1. 683 0. 094 2. 84 <0. 001 >0. 999 2 0. 300 0. 150 4. 57 0. 011 S 1664 54. 691 0. 033 Total (Adjusted) 1785 419. 162 Sp Dir Time Pos Time Sp Dir Pos Time Site

Decadal Radial Growth Rates

Wet Drought Climatic Anomalies

* P < 0. 05 ** P < 0. 01 *** P < 0. 001 Nitrogen *** *** ** ** White Red Soft ** Hard Position ** Dir Pos * Time *** *** Dir Time *** Pos Time Dir Pos Tim Cherry ** Hickory Elm Tulip Beech Bass Direction
 Mass Loss 6 mo 12 mo 18 mo")
Mean Percent Mass Loss (+ SE) Mass Loss 6 mo 12 mo 18 mo 40 30 20 10 0 Bass Beech Tulip Elm Hick Cherry Hard Soft Maple Species Red White Oak
 0. 6 Xeric Intermediate Mesic 0. 4")
Palmer Drought Severity Index Correlation Coefficient (r) 0. 6 Xeric Intermediate Mesic 0. 4 0. 2 0. 0 -0. 2 -0. 4 GS PGS Yeart Jul Jun May Apr Mar Feb Jan Dec Nov Oct Sep Aug Jul Jun May Apr Yeart -1

Landform Index F = 19. 49 P < 0. 001 Power > 0. 999 Landform Index Score 30 25 20 15 10 5 Low Mid Slope Position Upper

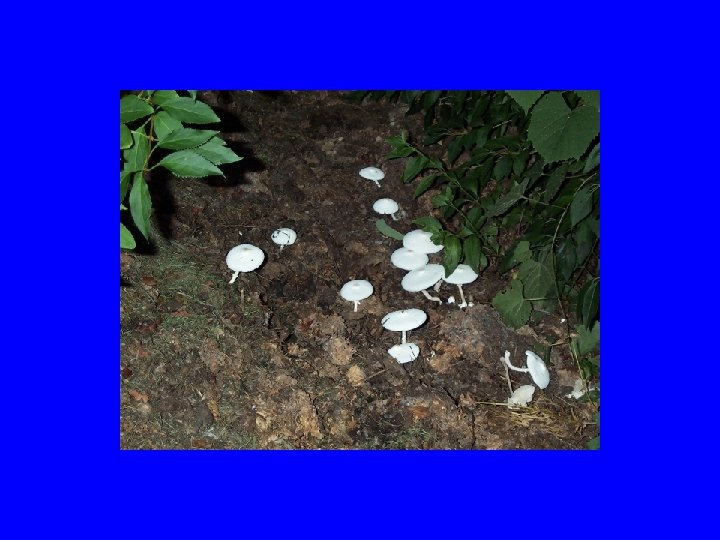
Myxomycetes 1 mm Chocolate tube slime Stemonitis splendens Yellow-fuzz cone slime Hemitrichia clavata 1 mm

Hanover Loom Chat’s Loom

Stuff Just Won’t line up! 12 b Mean ± SE 10 b 8 b b b 6 a 4 2 0 Control Drip RE One No Vinca Pass. RE Treatment

Make some Perfect Shapes – SHIFT!

Make us pretty and orderly

LINE UP JERKS!

GET BEHIND ME SATAN!
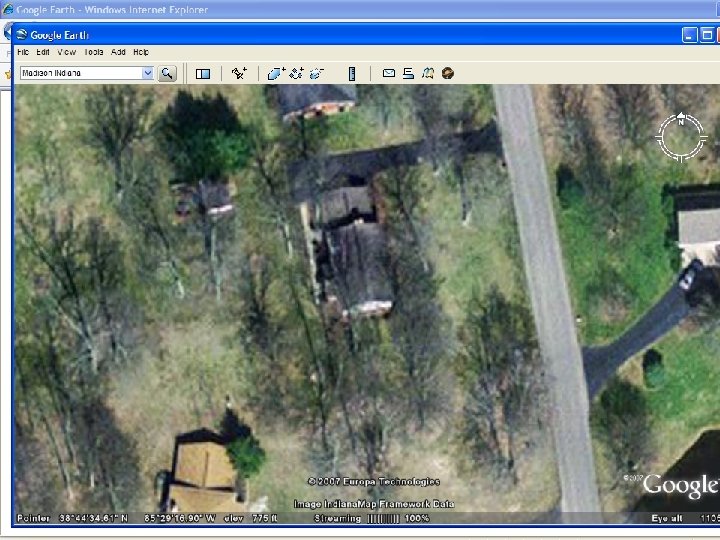

Dealing with Poorly Scanned Images: Sometimes it’s not your fault

Dealing with Poorly Scanned Images: Sometimes it’s not your fault
- Slides: 25