
Giuseppe Remuzzi REIN and REIN2 May 2 2008



- Slides: 67
Giuseppe Remuzzi REIN and REIN-2 May 2, 2008 1
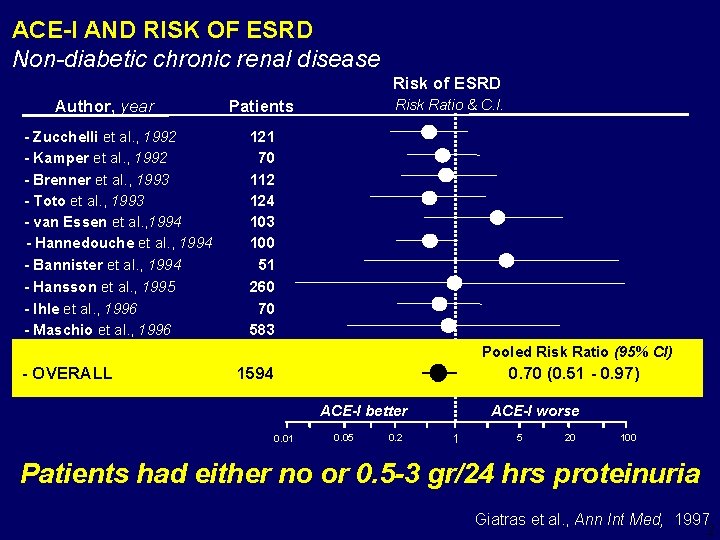
ACE-I AND RISK OF ESRD Non-diabetic chronic renal disease Risk of ESRD Author, year - Zucchelli et al. , 1992 - Kamper et al. , 1992 - Brenner et al. , 1993 - Toto et al. , 1993 - van Essen et al. , 1994 - Hannedouche et al. , 1994 - Bannister et al. , 1994 - Hansson et al. , 1995 - Ihle et al. , 1996 - Maschio et al. , 1996 Patients Risk Ratio & C. I. 121 70 112 124 103 100 51 260 70 583 Pooled Risk Ratio (95% CI) - OVERALL 1594 0. 70 (0. 51 - 0. 97) ACE-I better 0. 01 0. 05 0. 2 ACE-I worse 1 5 20 100 Patients had either no or 0. 5 -3 gr/24 hrs proteinuria Giatras et al. , Ann Int Med, 1997 2
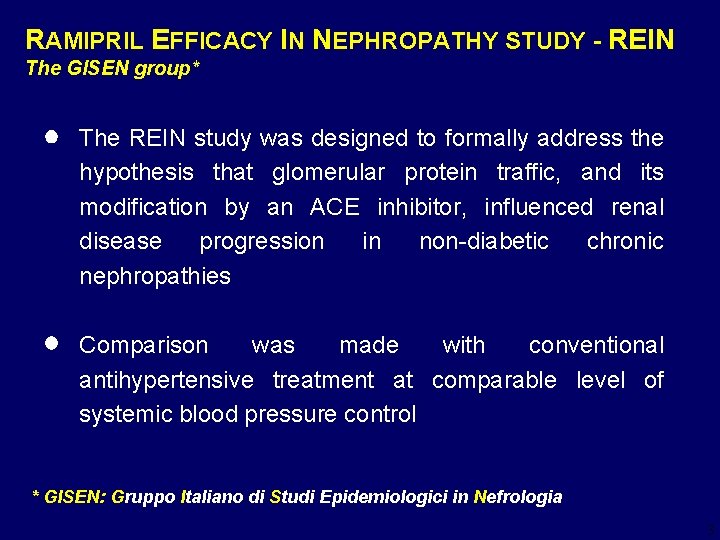
RAMIPRIL EFFICACY IN NEPHROPATHY STUDY - REIN The GISEN group* The REIN study was designed to formally address the hypothesis that glomerular protein traffic, and its modification by an ACE inhibitor, influenced renal disease progression in non-diabetic chronic nephropathies Comparison was made with conventional antihypertensive treatment at comparable level of systemic blood pressure control * GISEN: Gruppo Italiano di Studi Epidemiologici in Nefrologia 3
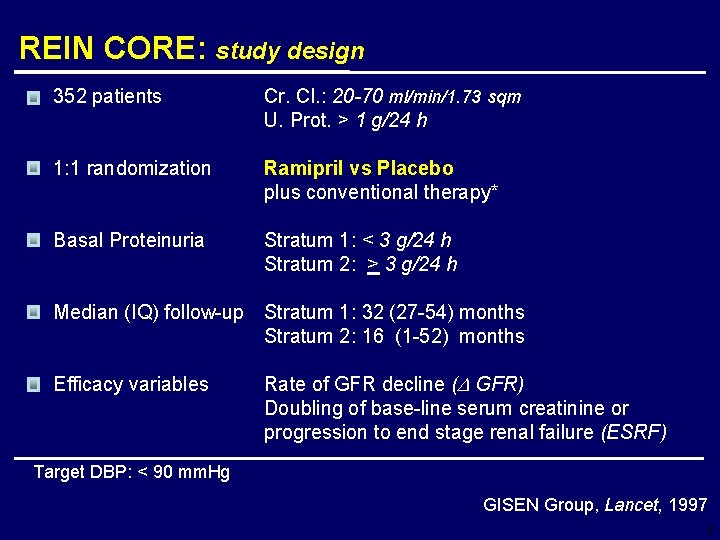
REIN CORE: study design 352 patients Cr. Cl. : 20 -70 ml/min/1. 73 sqm U. Prot. > 1 g/24 h 1: 1 randomization Ramipril vs Placebo plus conventional therapy* Basal Proteinuria Stratum 1: < 3 g/24 h Stratum 2: > 3 g/24 h Median (IQ) follow-up Stratum 1: 32 (27 -54) months Stratum 2: 16 (1 -52) months Efficacy variables Rate of GFR decline (D GFR) Doubling of base-line serum creatinine or progression to end stage renal failure (ESRF) Target DBP: < 90 mm. Hg GISEN Group, Lancet, 1997 4
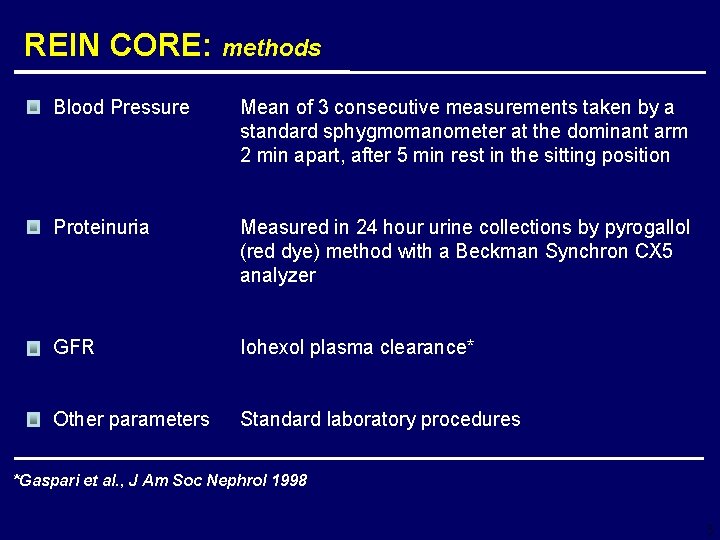
REIN CORE: methods Blood Pressure Mean of 3 consecutive measurements taken by a standard sphygmomanometer at the dominant arm 2 min apart, after 5 min rest in the sitting position Proteinuria Measured in 24 hour urine collections by pyrogallol (red dye) method with a Beckman Synchron CX 5 analyzer GFR Iohexol plasma clearance* Other parameters Standard laboratory procedures *Gaspari et al. , J Am Soc Nephrol 1998 5
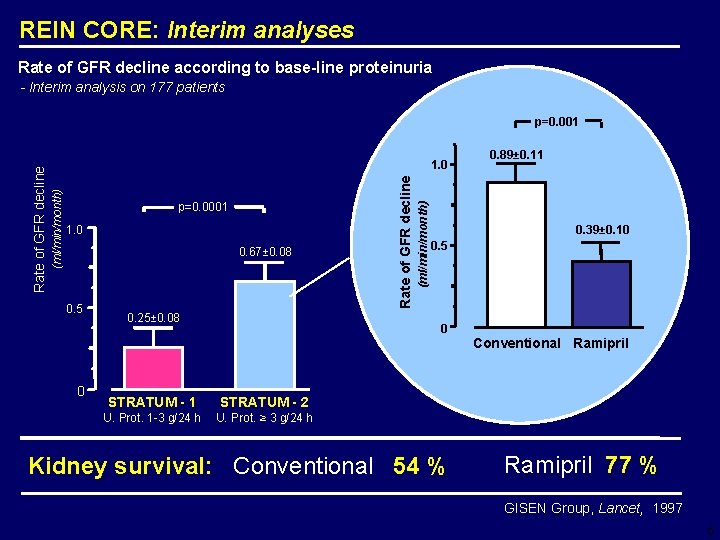
REIN CORE: Interim analyses Rate of GFR decline according to base-line proteinuria - Interim analysis on 177 patients 1. 0 0. 67± 0. 08 0. 5 0. 25± 0. 08 (ml/min/month) p=0. 0001 Rate of GFR decline 1. 0 (ml/min/month) Rate of GFR decline p=0. 001 0. 89± 0. 11 0. 39± 0. 10 0. 5 0 Conventional Ramipril 0 STRATUM - 1 STRATUM - 2 U. Prot. 1 -3 g/24 h U. Prot. ≥ 3 g/24 h Kidney survival: Conventional 54 % Ramipril 77 % GISEN Group, Lancet, 1997 6
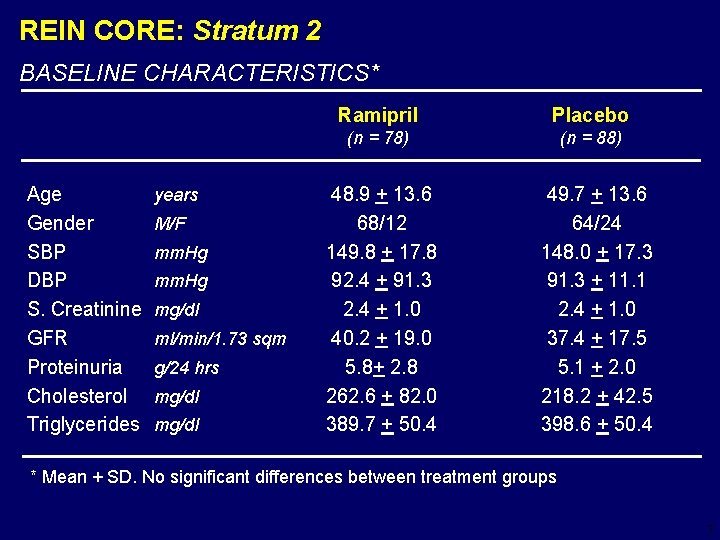
REIN CORE: Stratum 2 BASELINE CHARACTERISTICS* Age Gender SBP DBP S. Creatinine GFR Proteinuria Cholesterol Triglycerides years M/F mm. Hg mg/dl ml/min/1. 73 sqm g/24 hrs mg/dl Ramipril Placebo (n = 78) (n = 88) 48. 9 + 13. 6 68/12 149. 8 + 17. 8 92. 4 + 91. 3 2. 4 + 1. 0 40. 2 + 19. 0 5. 8+ 2. 8 262. 6 + 82. 0 389. 7 + 50. 4 49. 7 + 13. 6 64/24 148. 0 + 17. 3 91. 3 + 11. 1 2. 4 + 1. 0 37. 4 + 17. 5 5. 1 + 2. 0 218. 2 + 42. 5 398. 6 + 50. 4 * Mean + SD. No significant differences between treatment groups 7
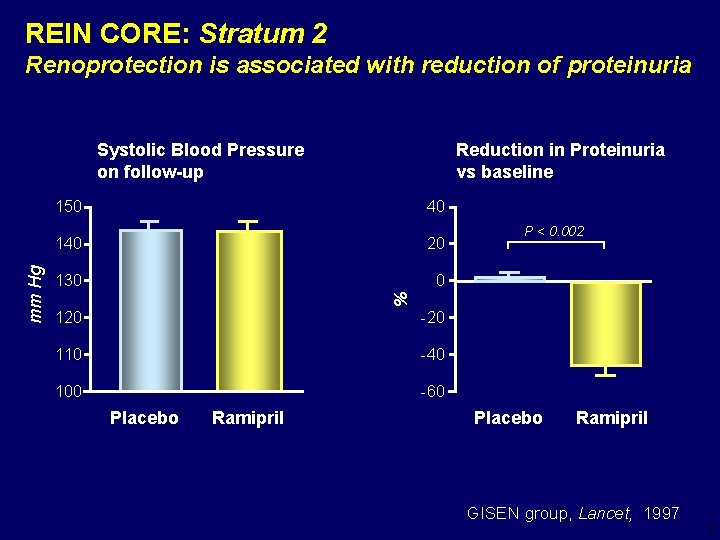
REIN CORE: Stratum 2 Renoprotection is associated with reduction of proteinuria Reduction in Proteinuria vs baseline 150 40 140 20 130 0 P < 0. 002 % mm Hg Systolic Blood Pressure on follow-up 120 -20 110 -40 100 -60 Placebo Ramipril GISEN group, Lancet, 1997 8
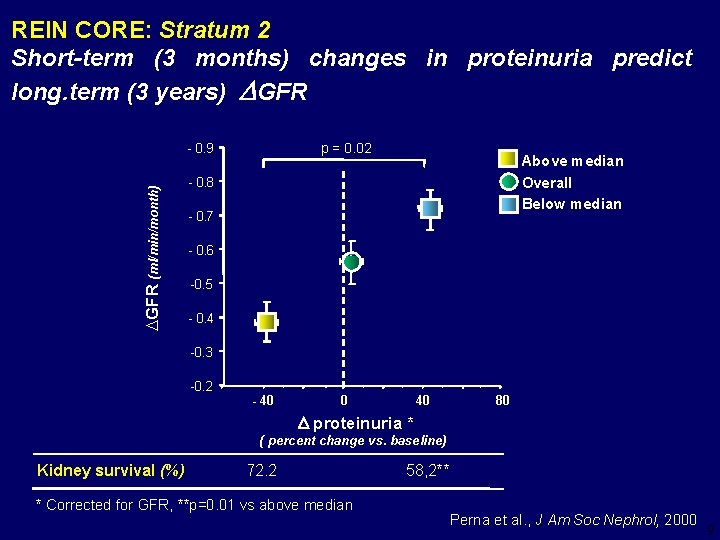
REIN CORE: Stratum 2 Short-term (3 months) changes in proteinuria predict long. term (3 years) GFR p = 0. 02 DGFR (ml/min/month) - 0. 9 Above median Overall Below median - 0. 8 - 0. 7 - 0. 6 -0. 5 - 0. 4 -0. 3 -0. 2 - 40 0 40 80 proteinuria * ( percent change vs. baseline) Kidney survival (%) 72. 2 * Corrected for GFR, **p=0. 01 vs above median 58, 2** Perna et al. , J Am Soc Nephrol, 2000 9
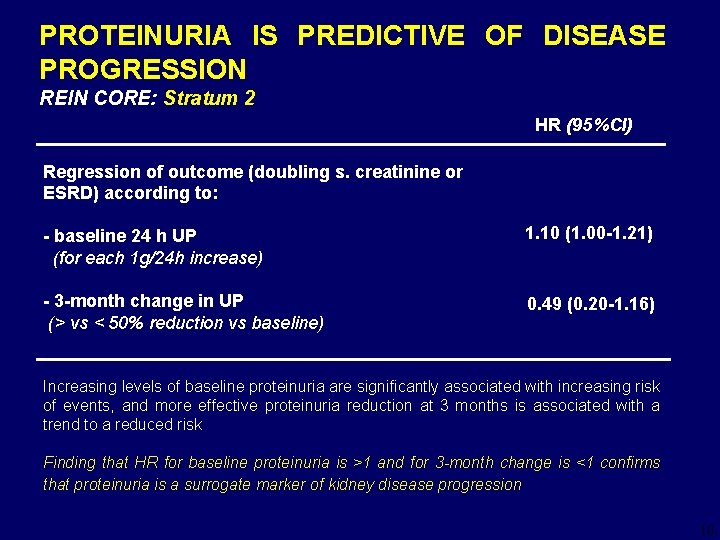
PROTEINURIA IS PREDICTIVE OF DISEASE PROGRESSION REIN CORE: Stratum 2 HR (95%CI) Regression of outcome (doubling s. creatinine or ESRD) according to: - baseline 24 h UP (for each 1 g/24 h increase) 1. 10 (1. 00 -1. 21) - 3 -month change in UP (> vs < 50% reduction vs baseline) 0. 49 (0. 20 -1. 16) Increasing levels of baseline proteinuria are significantly associated with increasing risk of events, and more effective proteinuria reduction at 3 months is associated with a trend to a reduced risk Finding that HR for baseline proteinuria is >1 and for 3 -month change is <1 confirms that proteinuria is a surrogate marker of kidney disease progression 10
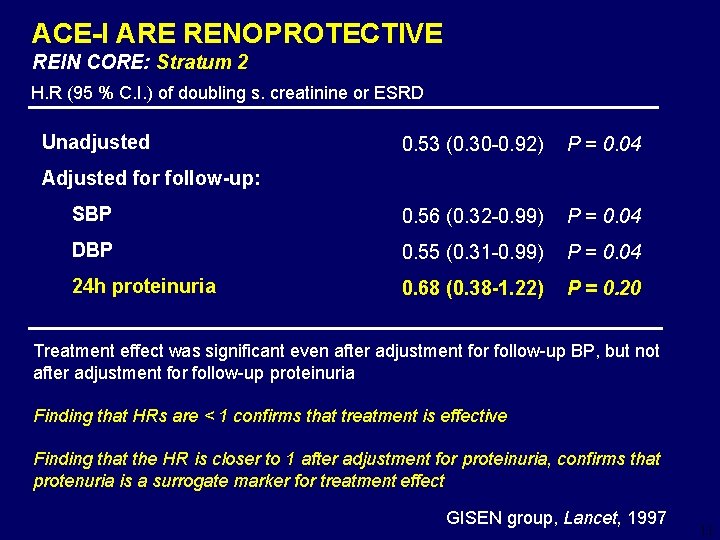
ACE-I ARE RENOPROTECTIVE REIN CORE: Stratum 2 H. R (95 % C. I. ) of doubling s. creatinine or ESRD Unadjusted 0. 53 (0. 30 -0. 92) P = 0. 04 SBP 0. 56 (0. 32 -0. 99) P = 0. 04 DBP 0. 55 (0. 31 -0. 99) P = 0. 04 24 h proteinuria 0. 68 (0. 38 -1. 22) P = 0. 20 Adjusted for follow-up: Treatment effect was significant even after adjustment for follow-up BP, but not after adjustment for follow-up proteinuria Finding that HRs are < 1 confirms that treatment is effective Finding that the HR is closer to 1 after adjustment for proteinuria, confirms that protenuria is a surrogate marker for treatment effect GISEN group, Lancet, 1997 11
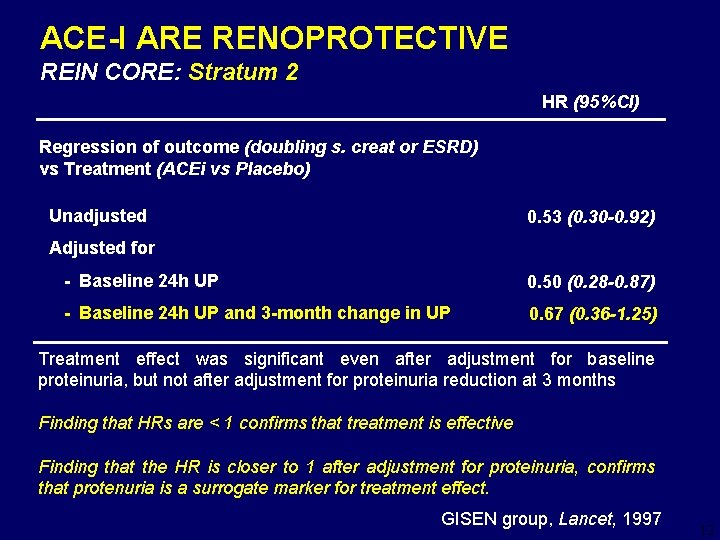
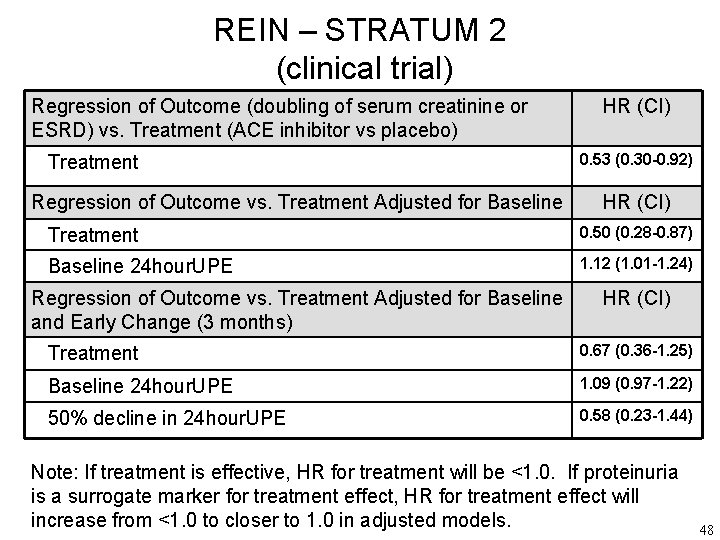
ACE-I ARE RENOPROTECTIVE REIN CORE: Stratum 2 HR (95%CI) Regression of outcome (doubling s. creat or ESRD) vs Treatment (ACEi vs Placebo) Unadjusted 0. 53 (0. 30 -0. 92) Adjusted for - Baseline 24 h UP 0. 50 (0. 28 -0. 87) - Baseline 24 h UP and 3 -month change in UP 0. 67 (0. 36 -1. 25) Treatment effect was significant even after adjustment for baseline proteinuria, but not after adjustment for proteinuria reduction at 3 months Finding that HRs are < 1 confirms that treatment is effective Finding that the HR is closer to 1 after adjustment for proteinuria, confirms that protenuria is a surrogate marker for treatment effect. GISEN group, Lancet, 1997 12
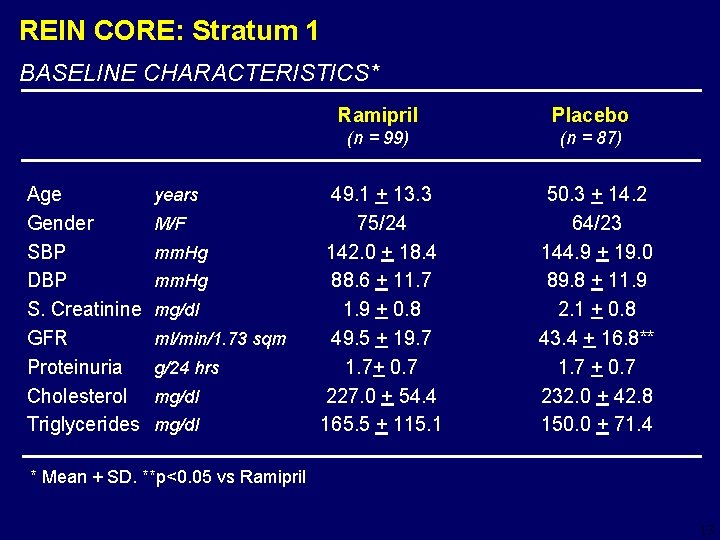
REIN CORE: Stratum 1 BASELINE CHARACTERISTICS* Age Gender SBP DBP S. Creatinine GFR Proteinuria Cholesterol Triglycerides years M/F mm. Hg mg/dl ml/min/1. 73 sqm g/24 hrs mg/dl Ramipril Placebo (n = 99) (n = 87) 49. 1 + 13. 3 75/24 142. 0 + 18. 4 88. 6 + 11. 7 1. 9 + 0. 8 49. 5 + 19. 7 1. 7+ 0. 7 227. 0 + 54. 4 165. 5 + 115. 1 50. 3 + 14. 2 64/23 144. 9 + 19. 0 89. 8 + 11. 9 2. 1 + 0. 8 43. 4 + 16. 8** 1. 7 + 0. 7 232. 0 + 42. 8 150. 0 + 71. 4 * Mean + SD. **p<0. 05 vs Ramipril 13
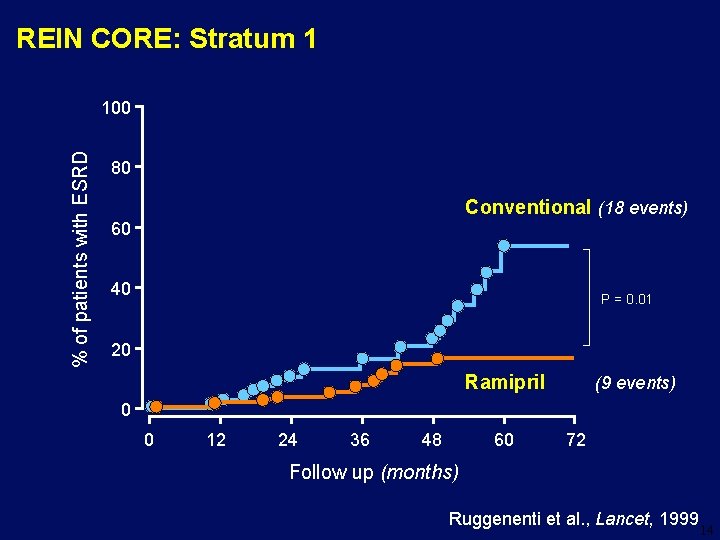
REIN CORE: Stratum 1 % of patients with ESRD 100 80 Conventional (18 events) 60 40 P = 0. 01 20 Ramipril (9 events) 0 0 12 24 36 48 60 72 Follow up (months) Ruggenenti et al. , Lancet, 1999 14
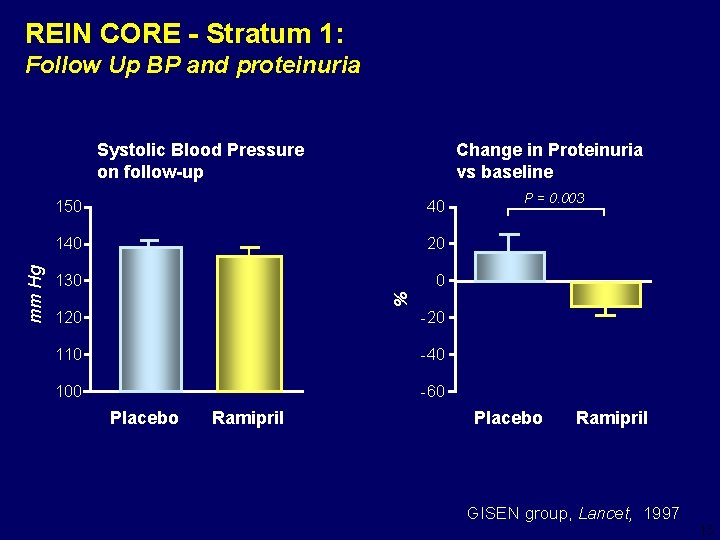
REIN CORE - Stratum 1: Follow Up BP and proteinuria Change in Proteinuria vs baseline 150 40 140 20 130 0 P = 0. 003 % mm Hg Systolic Blood Pressure on follow-up 120 -20 110 -40 100 -60 Placebo Ramipril GISEN group, Lancet, 1997 15
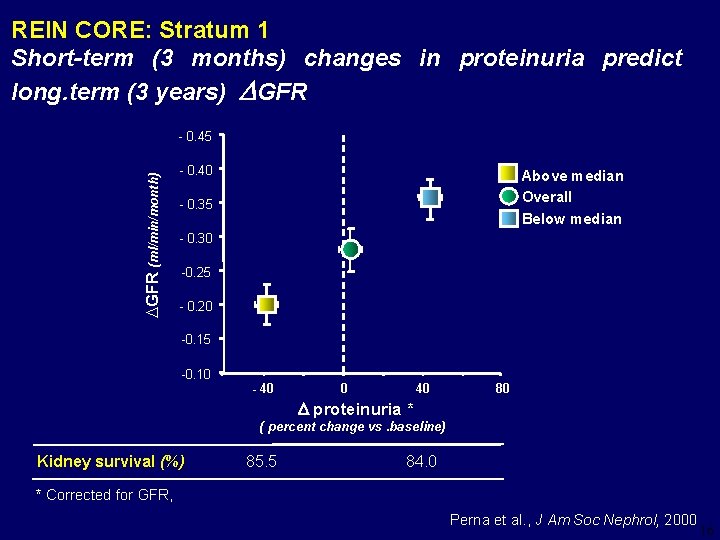
REIN CORE: Stratum 1 Short-term (3 months) changes in proteinuria predict long. term (3 years) GFR DGFR (ml/min/month) - 0. 45 - 0. 40 Above median Overall Below median - 0. 35 - 0. 30 -0. 25 - 0. 20 -0. 15 -0. 10 - 40 0 40 80 proteinuria * ( percent change vs. baseline) Kidney survival (%) 85. 5 84. 0 * Corrected for GFR, Perna et al. , J Am Soc Nephrol, 2000 16
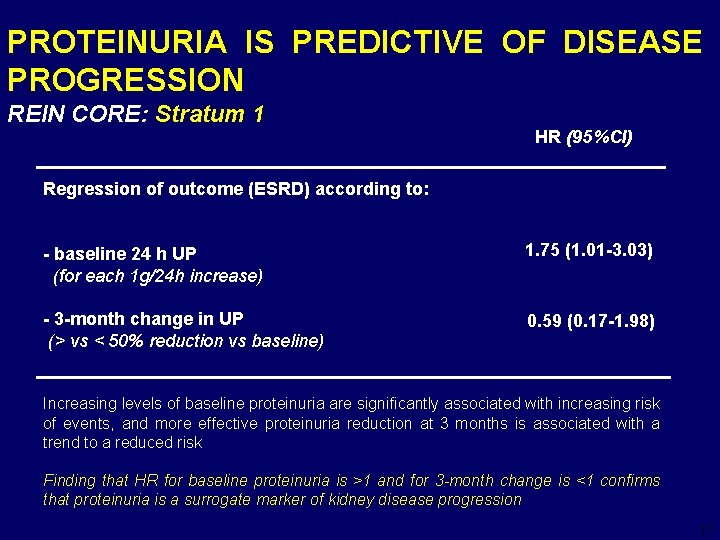
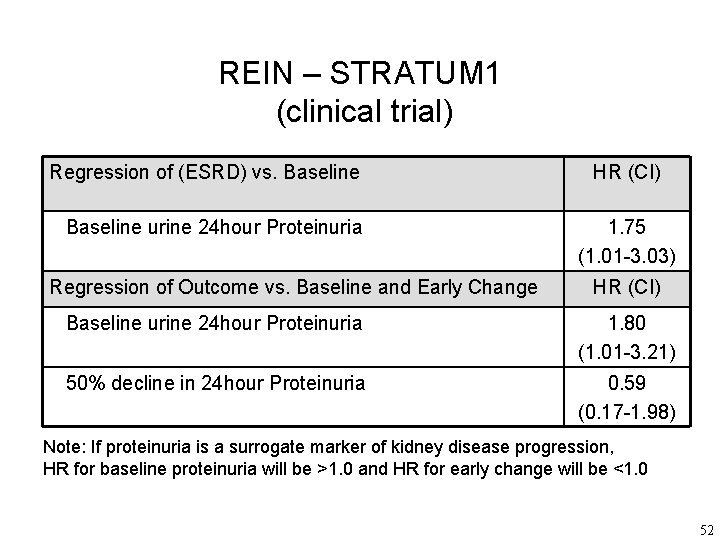
PROTEINURIA IS PREDICTIVE OF DISEASE PROGRESSION REIN CORE: Stratum 1 HR (95%CI) Regression of outcome (ESRD) according to: - baseline 24 h UP (for each 1 g/24 h increase) 1. 75 (1. 01 -3. 03) - 3 -month change in UP (> vs < 50% reduction vs baseline) 0. 59 (0. 17 -1. 98) Increasing levels of baseline proteinuria are significantly associated with increasing risk of events, and more effective proteinuria reduction at 3 months is associated with a trend to a reduced risk Finding that HR for baseline proteinuria is >1 and for 3 -month change is <1 confirms that proteinuria is a surrogate marker of kidney disease progression 17
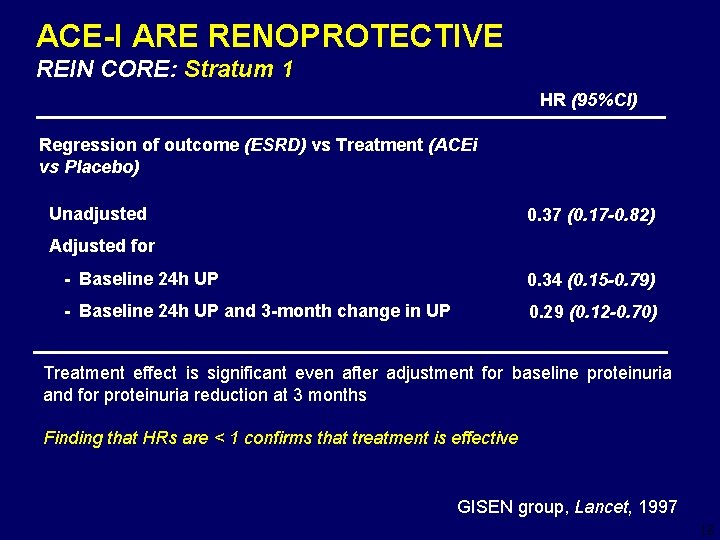
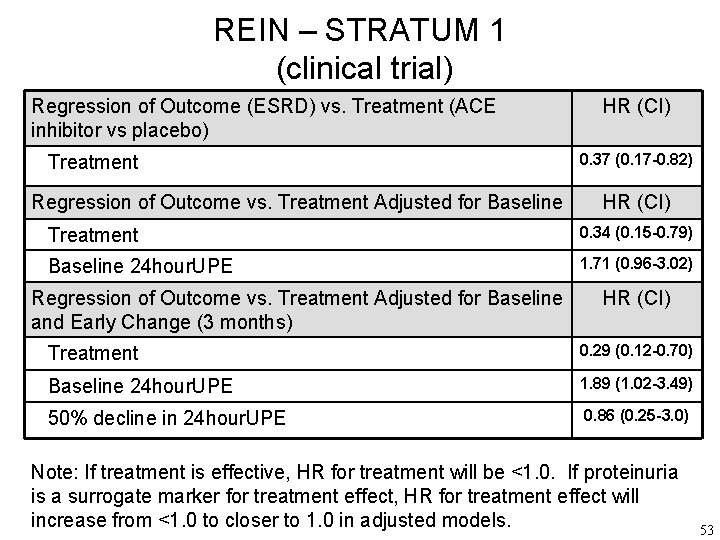
ACE-I ARE RENOPROTECTIVE REIN CORE: Stratum 1 HR (95%CI) Regression of outcome (ESRD) vs Treatment (ACEi vs Placebo) Unadjusted 0. 37 (0. 17 -0. 82) Adjusted for - Baseline 24 h UP 0. 34 (0. 15 -0. 79) - Baseline 24 h UP and 3 -month change in UP 0. 29 (0. 12 -0. 70) Treatment effect is significant even after adjustment for baseline proteinuria and for proteinuria reduction at 3 months Finding that HRs are < 1 confirms that treatment is effective GISEN group, Lancet, 1997 18
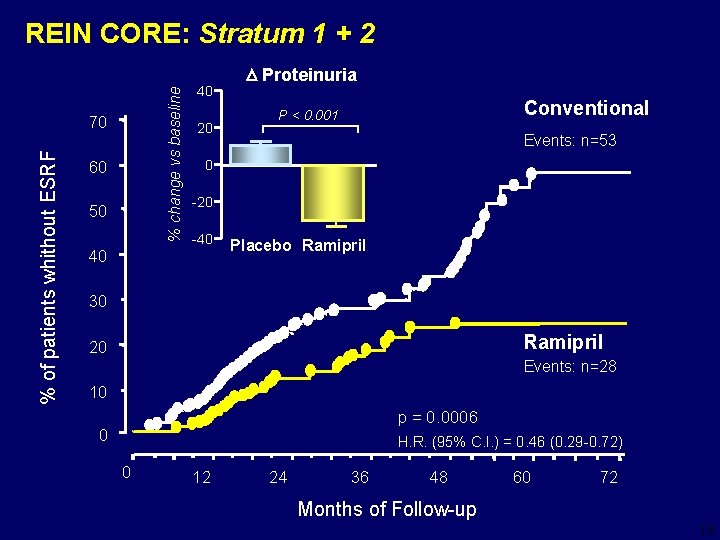
% change vs baseline REIN CORE: Stratum 1 + 2 % of patients whithout ESRF 70 60 50 40 40 20 Proteinuria Conventional P < 0. 001 Events: n=53 0 -20 -40 Placebo Ramipril 30 Ramipril 20 Events: n=28 10 p = 0. 0006 0 H. R. (95% C. I. ) = 0. 46 (0. 29 -0. 72) 0 12 24 36 48 60 72 Months of Follow-up 19
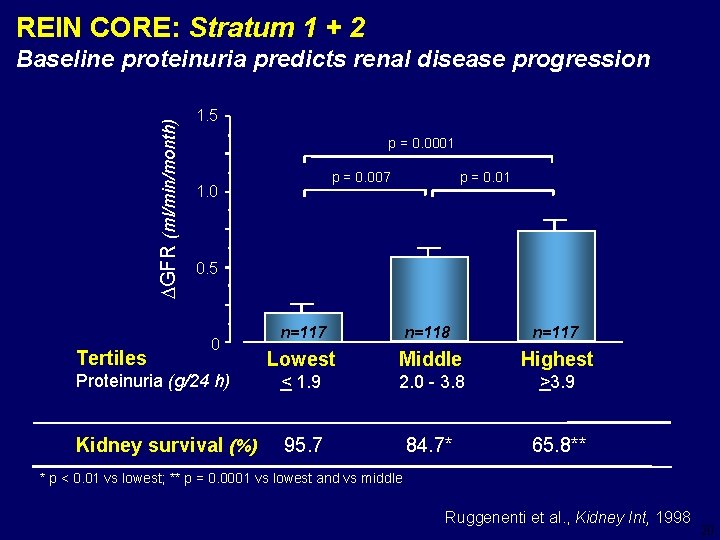
REIN CORE: Stratum 1 + 2 DGFR (ml/min/month) Baseline proteinuria predicts renal disease progression 1. 5 p = 0. 0001 p = 0. 007 1. 0 p = 0. 01 0. 5 n=117 n=118 n=117 Lowest Middle Highest Proteinuria (g/24 h) < 1. 9 2. 0 - 3. 8 >3. 9 Kidney survival (%) 95. 7 84. 7* 65. 8** Tertiles 0 * p < 0. 01 vs lowest; ** p = 0. 0001 vs lowest and vs middle Ruggenenti et al. , Kidney Int, 1998 20
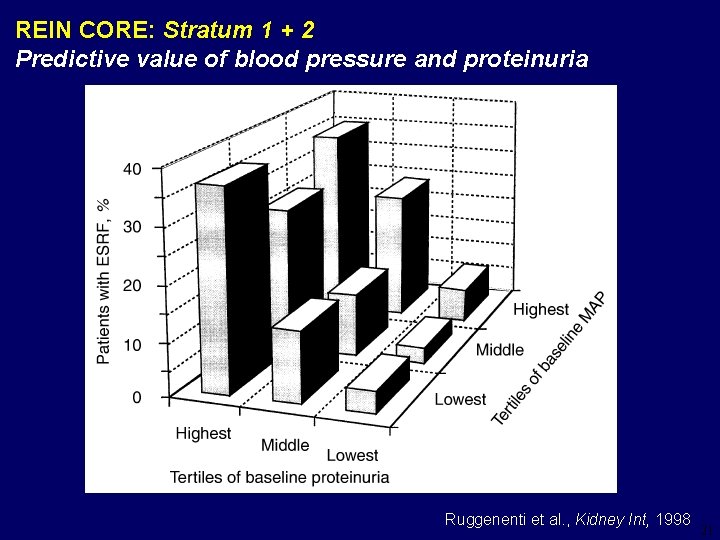
REIN CORE: Stratum 1 + 2 Predictive value of blood pressure and proteinuria Ruggenenti et al. , Kidney Int, 1998 21
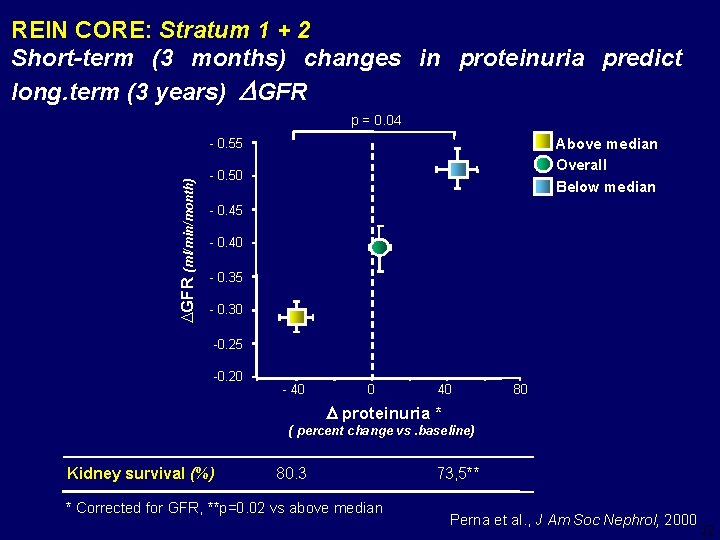
REIN CORE: Stratum 1 + 2 Short-term (3 months) changes in proteinuria predict long. term (3 years) GFR p = 0. 04 Above median Overall Below median DGFR (ml/min/month) - 0. 55 - 0. 50 - 0. 45 - 0. 40 - 0. 35 - 0. 30 -0. 25 -0. 20 - 40 0 40 80 proteinuria * ( percent change vs. baseline) Kidney survival (%) 80. 3 * Corrected for GFR, **p=0. 02 vs above median 73, 5** Perna et al. , J Am Soc Nephrol, 2000 22
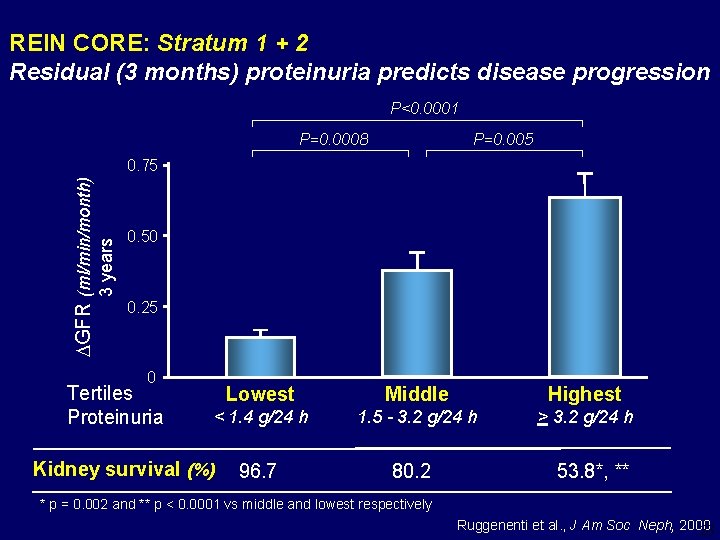
REIN CORE: Stratum 1 + 2 Residual (3 months) proteinuria predicts disease progression P<0. 0001 P=0. 0008 P=0. 005 3 years DGFR (ml/min/month) 0. 75 0. 50 0. 25 0 Tertiles Proteinuria Lowest Middle Highest < 1. 4 g/24 h 1. 5 - 3. 2 g/24 h > 3. 2 g/24 h Kidney survival (%) 96. 7 80. 2 53. 8*, ** * p = 0. 002 and ** p < 0. 0001 vs middle and lowest respectively Ruggenenti et al. , J Am Soc Neph, 2000 23
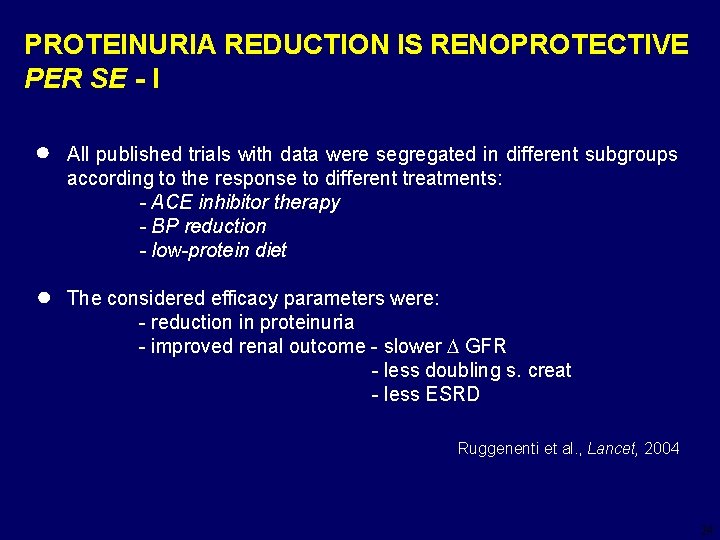
PROTEINURIA REDUCTION IS RENOPROTECTIVE PER SE - I All published trials with data were segregated in different subgroups according to the response to different treatments: - ACE inhibitor therapy - BP reduction - low-protein diet The considered efficacy parameters were: - reduction in proteinuria - improved renal outcome - slower D GFR - less doubling s. creat - less ESRD Ruggenenti et al. , Lancet, 2004 24
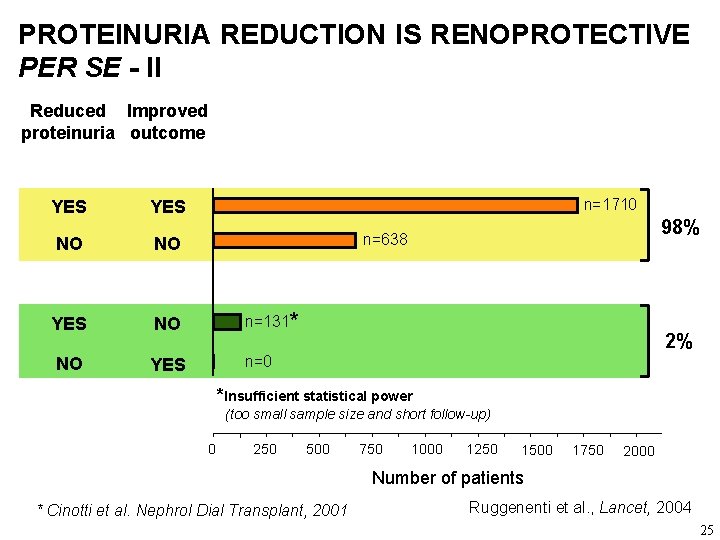
PROTEINURIA REDUCTION IS RENOPROTECTIVE PER SE - II Reduced Improved proteinuria outcome YES n=1710 YES 98% n=638 NO NO YES NO n=131* NO YES n=0 2% *Insufficient statistical power (too small sample size and short follow-up) 0 250 500 750 1000 1250 1500 1750 2000 Number of patients * Cinotti et al. Nephrol Dial Transplant, 2001 Ruggenenti et al. , Lancet, 2004 25
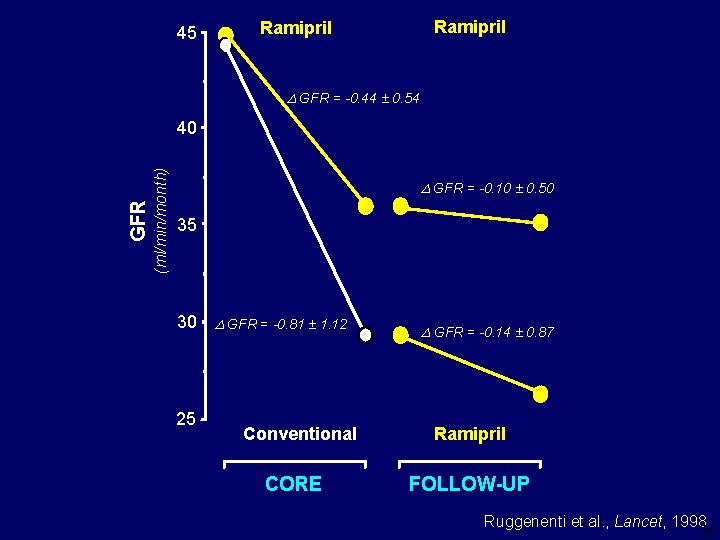
45 Ramipril D GFR = -0. 44 ± 0. 54 (ml/min/month) GFR 40 D GFR = -0. 10 ± 0. 50 35 30 25 D GFR = -0. 81 ± 1. 12 Conventional CORE D GFR = -0. 14 ± 0. 87 Ramipril FOLLOW-UP Ruggenenti et al. , Lancet, 199826
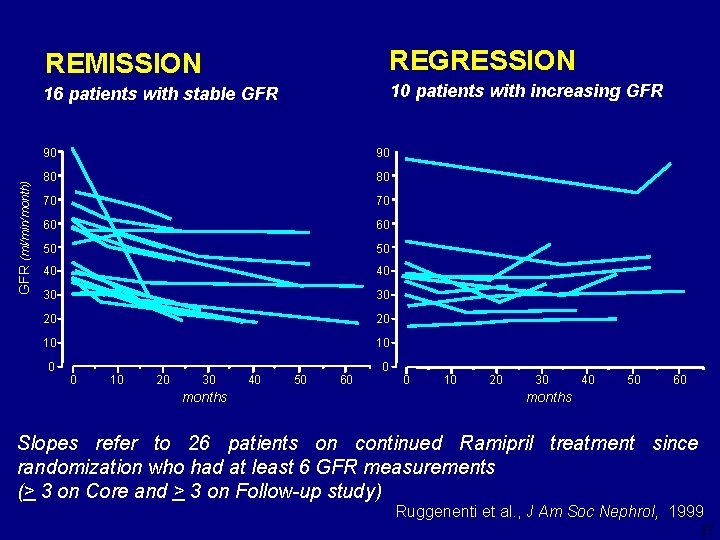
GFR (ml/min/month) REMISSION REGRESSION 16 patients with stable GFR 10 patients with increasing GFR 90 90 80 80 70 70 60 60 50 50 40 40 30 30 20 20 10 10 20 30 months 40 50 60 0 10 20 30 40 50 60 months Slopes refer to 26 patients on continued Ramipril treatment since randomization who had at least 6 GFR measurements (> 3 on Core and > 3 on Follow-up study) Ruggenenti et al. , J Am Soc Nephrol, 1999 27
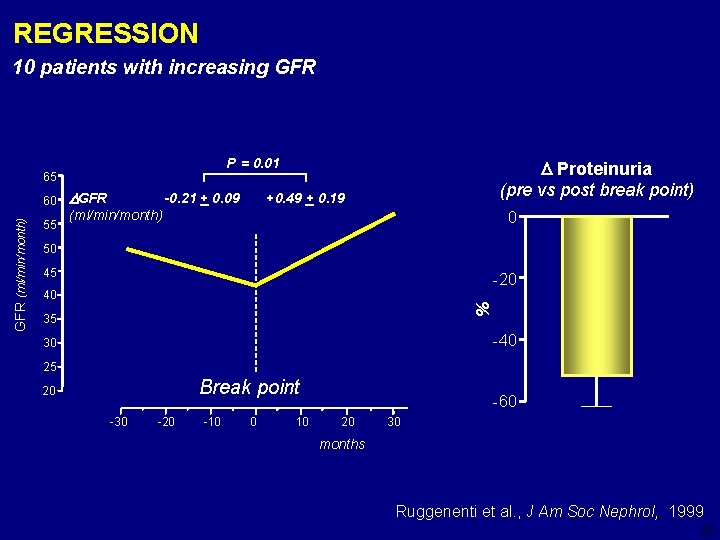
REGRESSION 10 patients with increasing GFR P = 0. 01 65 55 GFR -0. 21 + 0. 09 +0. 49 + 0. 19 (ml/min/month) 0 50 45 -20 40 % GFR (ml/min/month) 60 Proteinuria (pre vs post break point) 35 -40 30 25 Break point 20 -30 -20 -10 0 10 -60 20 30 months Ruggenenti et al. , J Am Soc Nephrol, 1999 28
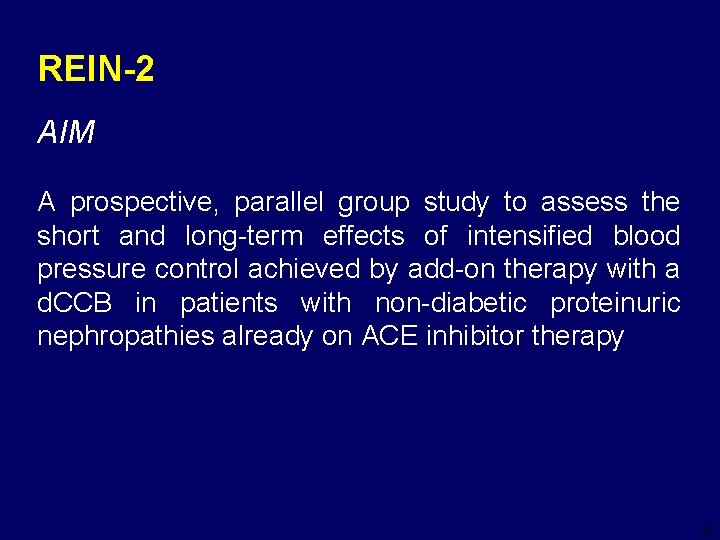
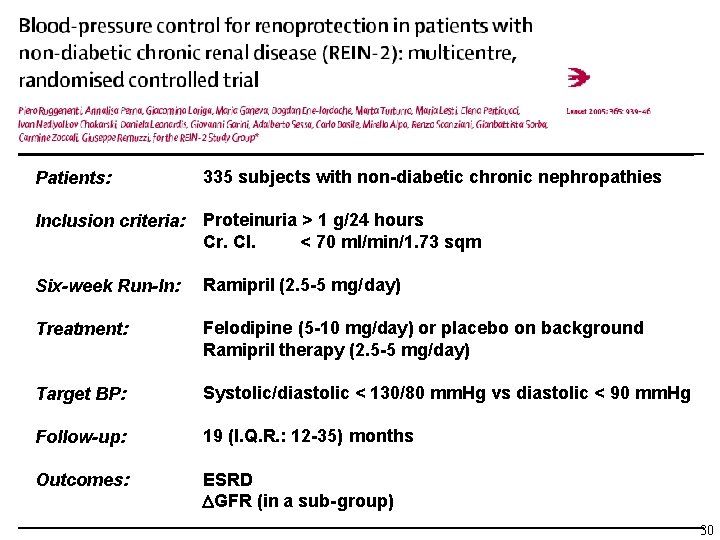
REIN-2 AIM A prospective, parallel group study to assess the short and long-term effects of intensified blood pressure control achieved by add-on therapy with a d. CCB in patients with non-diabetic proteinuric nephropathies already on ACE inhibitor therapy 29
Patients: 335 subjects with non-diabetic chronic nephropathies Inclusion criteria: Proteinuria > 1 g/24 hours Cr. Cl. < 70 ml/min/1. 73 sqm Six-week Run-In: Ramipril (2. 5 -5 mg/day) Treatment: Felodipine (5 -10 mg/day) or placebo on background Ramipril therapy (2. 5 -5 mg/day) Target BP: Systolic/diastolic < 130/80 mm. Hg vs diastolic < 90 mm. Hg Follow-up: 19 (I. Q. R. : 12 -35) months Outcomes: ESRD GFR (in a sub-group) 30
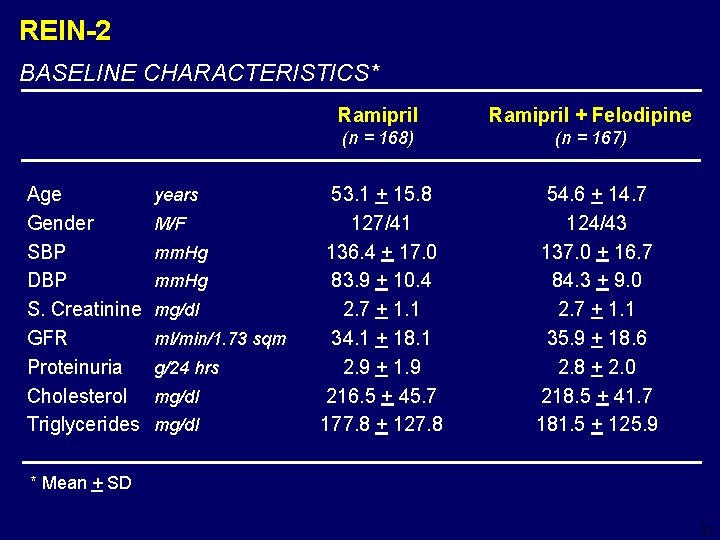
REIN-2 BASELINE CHARACTERISTICS* Age Gender SBP DBP S. Creatinine GFR Proteinuria Cholesterol Triglycerides years M/F mm. Hg mg/dl ml/min/1. 73 sqm g/24 hrs mg/dl Ramipril + Felodipine (n = 168) (n = 167) 53. 1 + 15. 8 127/41 136. 4 + 17. 0 83. 9 + 10. 4 2. 7 + 1. 1 34. 1 + 18. 1 2. 9 + 1. 9 216. 5 + 45. 7 177. 8 + 127. 8 54. 6 + 14. 7 124/43 137. 0 + 16. 7 84. 3 + 9. 0 2. 7 + 1. 1 35. 9 + 18. 6 2. 8 + 2. 0 218. 5 + 41. 7 181. 5 + 125. 9 * Mean + SD 31
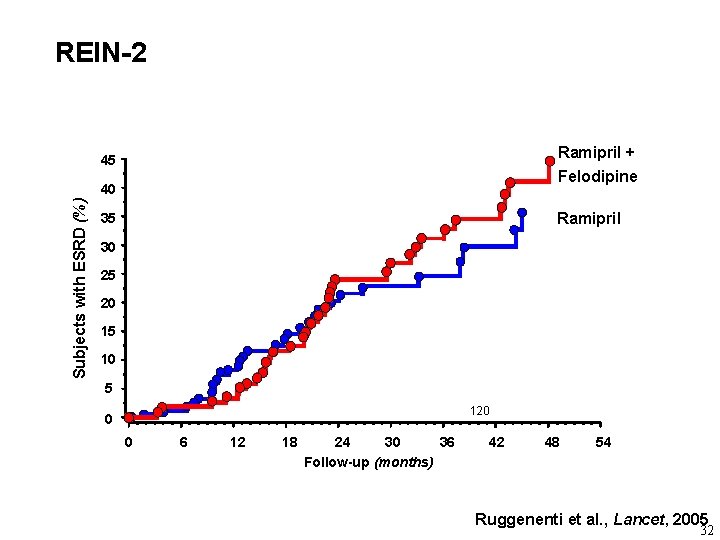
REIN-2 Ramipril + Felodipine 45 Subjects with ESRD (%) 40 Ramipril 35 30 25 20 15 10 5 120 0 0 6 12 18 24 30 36 Follow-up (months) 42 48 54 Ruggenenti et al. , Lancet, 2005 32
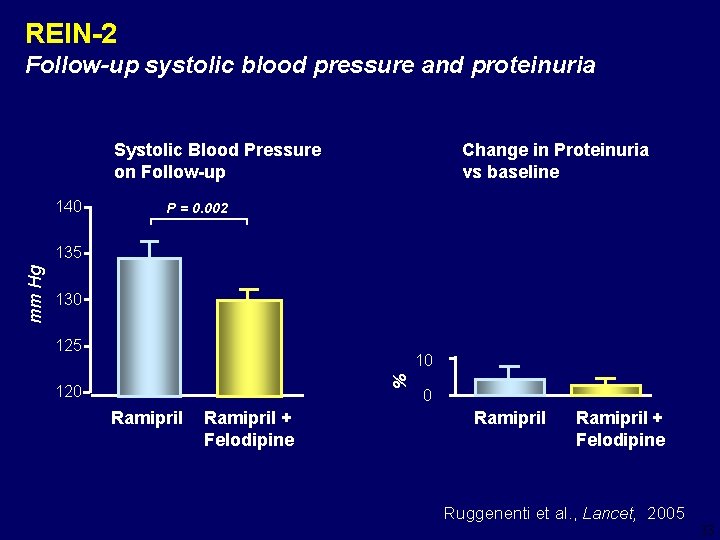
REIN-2 Follow-up systolic blood pressure and proteinuria Systolic Blood Pressure on Follow-up 140 Change in Proteinuria vs baseline P = 0. 002 130 125 10 % mm Hg 135 120 Ramipril + Felodipine Ruggenenti et al. , Lancet, 2005 33
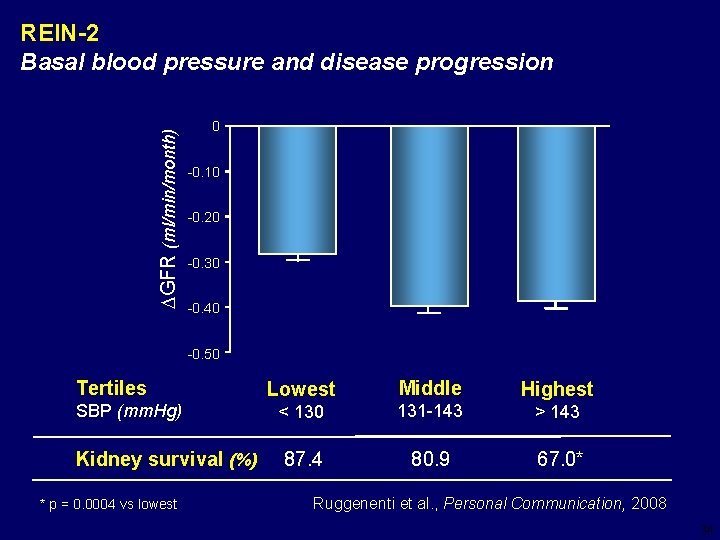
DGFR (ml/min/month) REIN-2 Basal blood pressure and disease progression 0 -0. 10 -0. 20 -0. 30 -0. 40 -0. 50 Tertiles SBP (mm. Hg) Kidney survival (%) * p = 0. 0004 vs lowest Lowest Middle Highest < 130 131 -143 > 143 87. 4 80. 9 67. 0* Ruggenenti et al. , Personal Communication, 2008 34
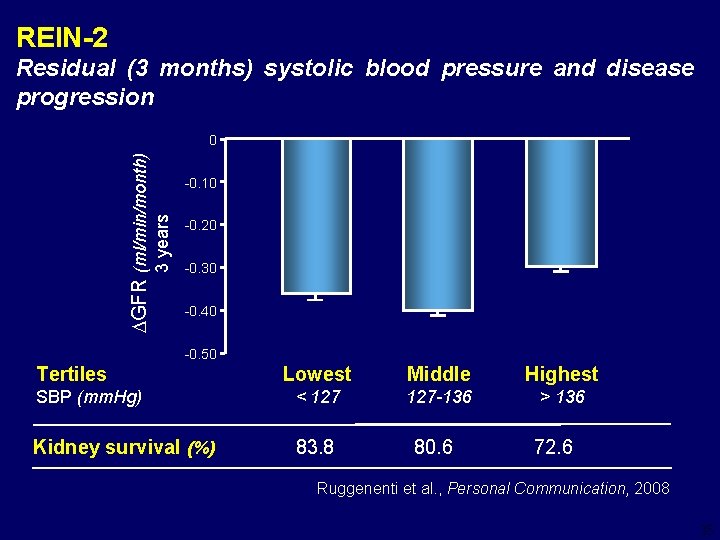
REIN-2 Residual (3 months) systolic blood pressure and disease progression -0. 10 3 years DGFR (ml/min/month) 0 -0. 20 -0. 30 -0. 40 -0. 50 Tertiles Lowest Middle Highest SBP (mm. Hg) < 127 -136 > 136 Kidney survival (%) 83. 8 80. 6 72. 6 Ruggenenti et al. , Personal Communication, 2008 35
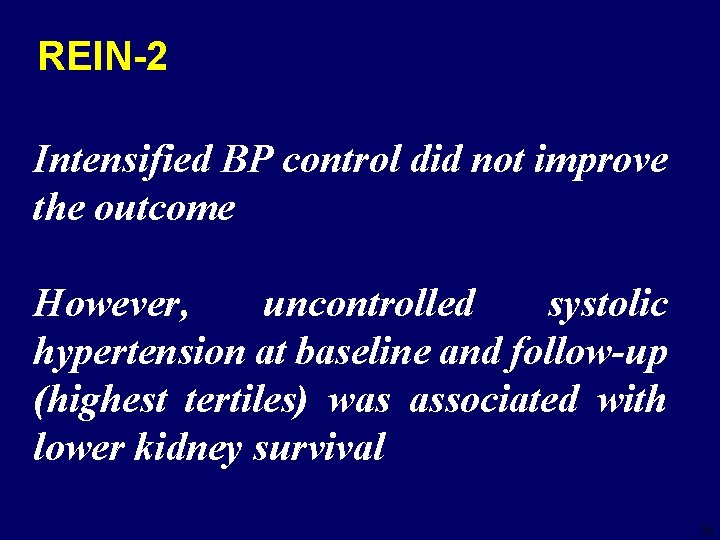
REIN-2 Intensified BP control did not improve the outcome However, uncontrolled systolic hypertension at baseline and follow-up (highest tertiles) was associated with lower kidney survival 36
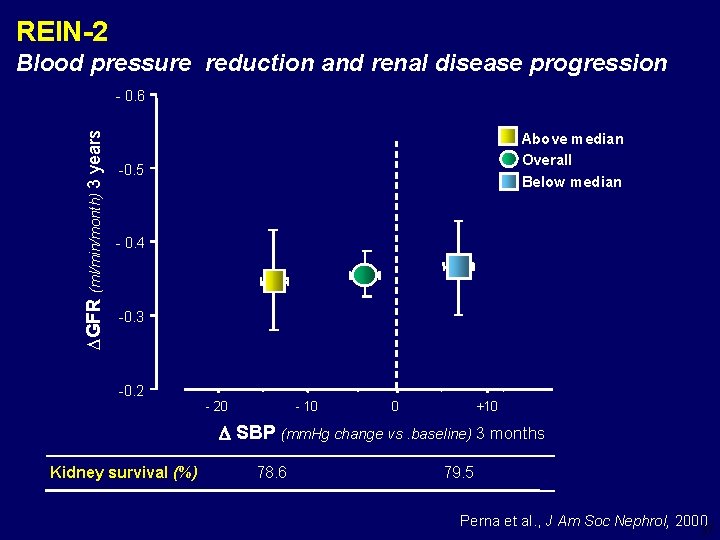
REIN-2 Blood pressure reduction and renal disease progression DGFR (ml/min/month) 3 years - 0. 6 Above median Overall Below median -0. 5 - 0. 4 -0. 3 -0. 2 - 20 - 10 0 +10 SBP (mm. Hg change vs. baseline) 3 months Kidney survival (%) 78. 6 79. 5 Perna et al. , J Am Soc Nephrol, 2000 37
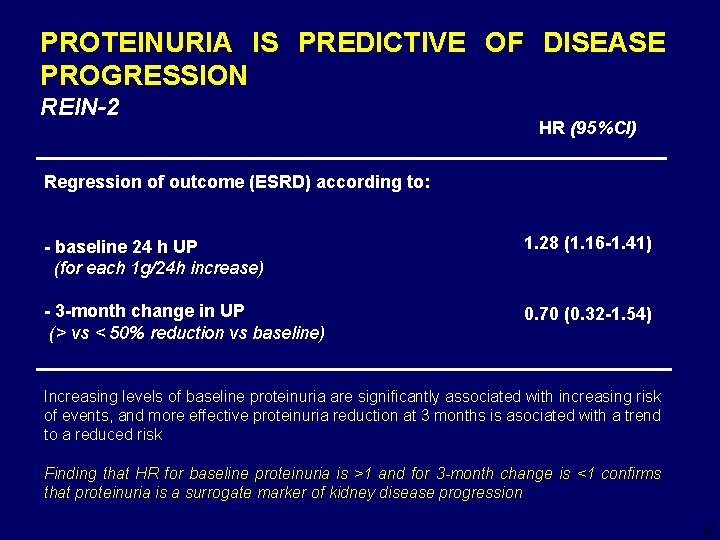
PROTEINURIA IS PREDICTIVE OF DISEASE PROGRESSION REIN-2 HR (95%CI) Regression of outcome (ESRD) according to: - baseline 24 h UP (for each 1 g/24 h increase) 1. 28 (1. 16 -1. 41) - 3 -month change in UP (> vs < 50% reduction vs baseline) 0. 70 (0. 32 -1. 54) Increasing levels of baseline proteinuria are significantly associated with increasing risk of events, and more effective proteinuria reduction at 3 months is asociated with a trend to a reduced risk Finding that HR for baseline proteinuria is >1 and for 3 -month change is <1 confirms that proteinuria is a surrogate marker of kidney disease progression 38
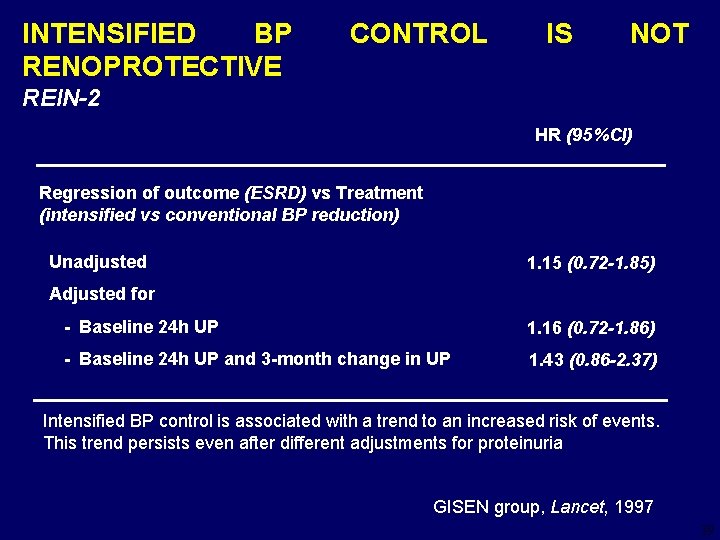
INTENSIFIED BP RENOPROTECTIVE CONTROL IS NOT REIN-2 HR (95%CI) Regression of outcome (ESRD) vs Treatment (intensified vs conventional BP reduction) Unadjusted 1. 15 (0. 72 -1. 85) Adjusted for - Baseline 24 h UP 1. 16 (0. 72 -1. 86) - Baseline 24 h UP and 3 -month change in UP 1. 43 (0. 86 -2. 37) Intensified BP control is associated with a trend to an increased risk of events. This trend persists even after different adjustments for proteinuria GISEN group, Lancet, 1997 39
Editorial Prevention of Microalbuminuria in Type 2 Diabetes: Millimeters or Milligrams? Richard J. Glassock J Am Soc Nephrol, 2006 40
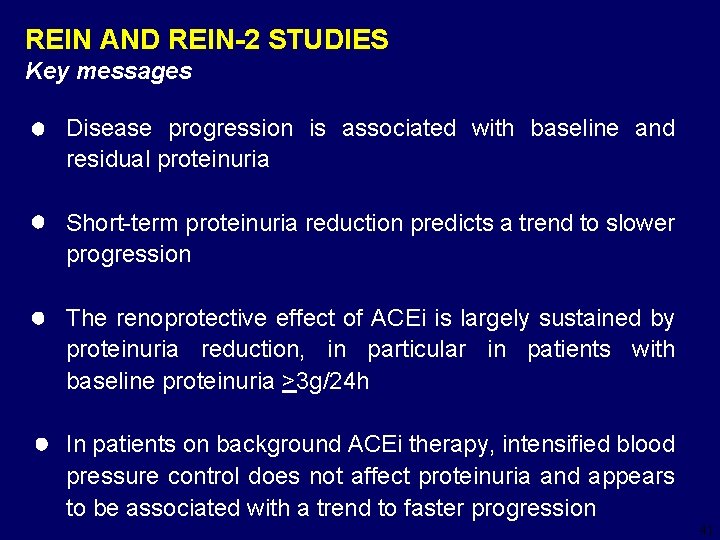
REIN AND REIN-2 STUDIES Key messages Disease progression is associated with baseline and residual proteinuria Short-term proteinuria reduction predicts a trend to slower progression The renoprotective effect of ACEi is largely sustained by proteinuria reduction, in particular in patients with baseline proteinuria >3 g/24 h In patients on background ACEi therapy, intensified blood pressure control does not affect proteinuria and appears to be associated with a trend to faster progression 41
42
These slides are belonging to Giuseppe Remuzzi, M. D. Mario Negri Institute for Pharmacological Research, Bergamo, Italy. Using these slides is only authorized by mentioning the source 43
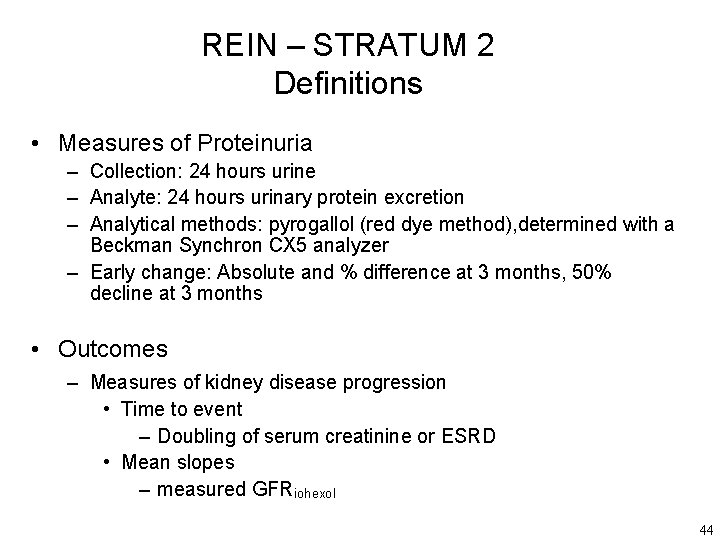
REIN – STRATUM 2 Definitions • Measures of Proteinuria – Collection: 24 hours urine – Analyte: 24 hours urinary protein excretion – Analytical methods: pyrogallol (red dye method), determined with a Beckman Synchron CX 5 analyzer – Early change: Absolute and % difference at 3 months, 50% decline at 3 months • Outcomes – Measures of kidney disease progression • Time to event – Doubling of serum creatinine or ESRD • Mean slopes – measured GFRiohexol 44
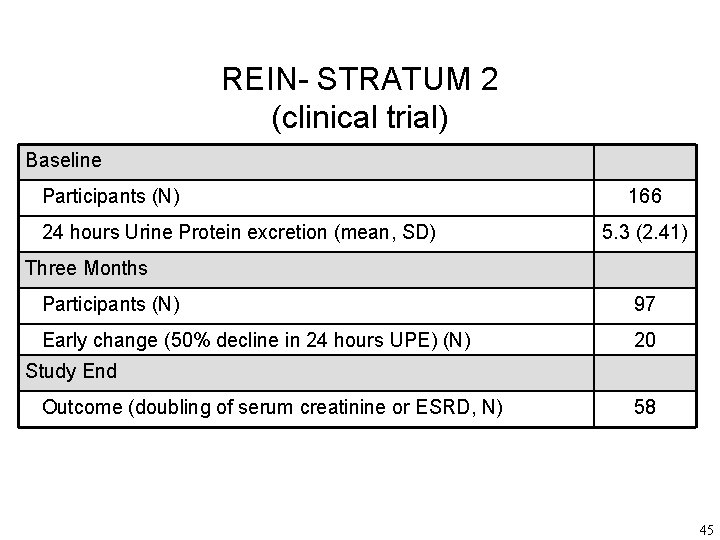
REIN- STRATUM 2 (clinical trial) Baseline Participants (N) 24 hours Urine Protein excretion (mean, SD) 166 5. 3 (2. 41) Three Months Participants (N) 97 Early change (50% decline in 24 hours UPE) (N) 20 Study End Outcome (doubling of serum creatinine or ESRD, N) 58 45
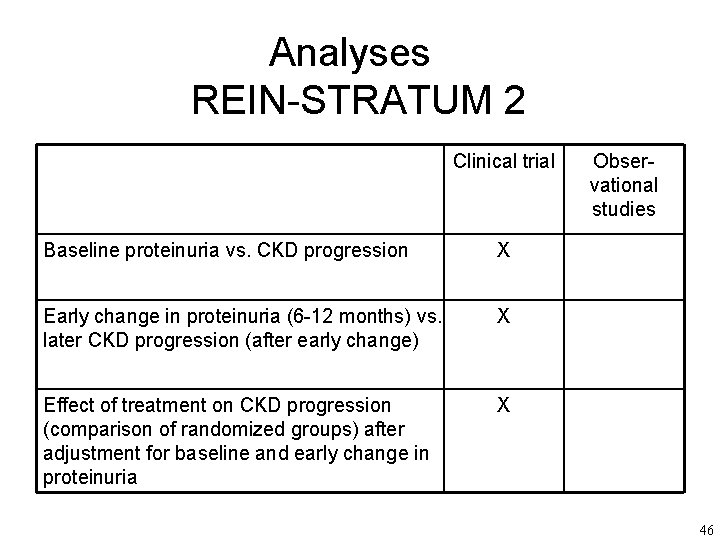
Analyses REIN-STRATUM 2 Clinical trial Baseline proteinuria vs. CKD progression X Early change in proteinuria (6 -12 months) vs. later CKD progression (after early change) X Effect of treatment on CKD progression (comparison of randomized groups) after adjustment for baseline and early change in proteinuria X Observational studies 46
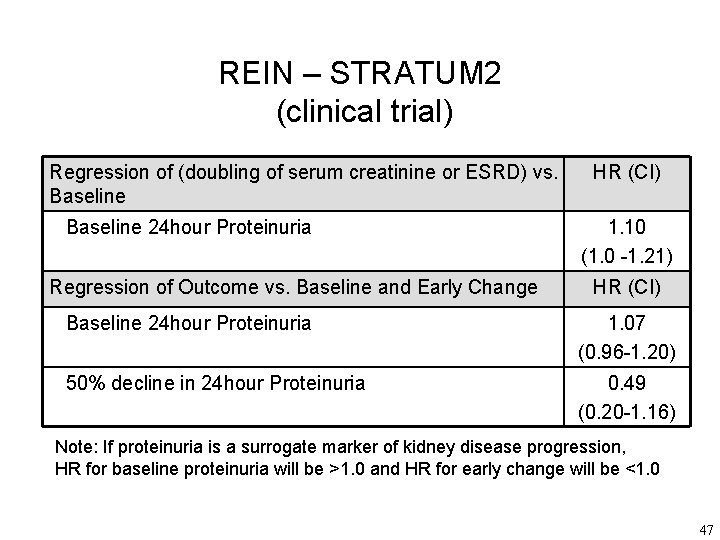
REIN – STRATUM 2 (clinical trial) Regression of (doubling of serum creatinine or ESRD) vs. Baseline 24 hour Proteinuria Regression of Outcome vs. Baseline and Early Change HR (CI) 1. 10 (1. 0 -1. 21) HR (CI) Baseline 24 hour Proteinuria 1. 07 (0. 96 -1. 20) 50% decline in 24 hour Proteinuria 0. 49 (0. 20 -1. 16) Note: If proteinuria is a surrogate marker of kidney disease progression, HR for baseline proteinuria will be >1. 0 and HR for early change will be <1. 0 47
REIN – STRATUM 2 (clinical trial) Regression of Outcome (doubling of serum creatinine or ESRD) vs. Treatment (ACE inhibitor vs placebo) Treatment Regression of Outcome vs. Treatment Adjusted for Baseline HR (CI) 0. 53 (0. 30 -0. 92) HR (CI) Treatment 0. 50 (0. 28 -0. 87) Baseline 24 hour. UPE 1. 12 (1. 01 -1. 24) Regression of Outcome vs. Treatment Adjusted for Baseline and Early Change (3 months) HR (CI) Treatment 0. 67 (0. 36 -1. 25) Baseline 24 hour. UPE 1. 09 (0. 97 -1. 22) 50% decline in 24 hour. UPE 0. 58 (0. 23 -1. 44) Note: If treatment is effective, HR for treatment will be <1. 0. If proteinuria is a surrogate marker for treatment effect, HR for treatment effect will increase from <1. 0 to closer to 1. 0 in adjusted models. 48
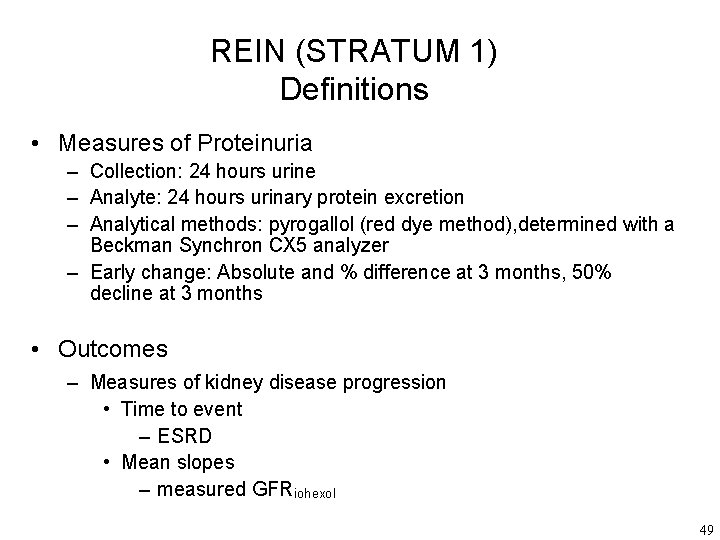
REIN (STRATUM 1) Definitions • Measures of Proteinuria – Collection: 24 hours urine – Analyte: 24 hours urinary protein excretion – Analytical methods: pyrogallol (red dye method), determined with a Beckman Synchron CX 5 analyzer – Early change: Absolute and % difference at 3 months, 50% decline at 3 months • Outcomes – Measures of kidney disease progression • Time to event – ESRD • Mean slopes – measured GFRiohexol 49
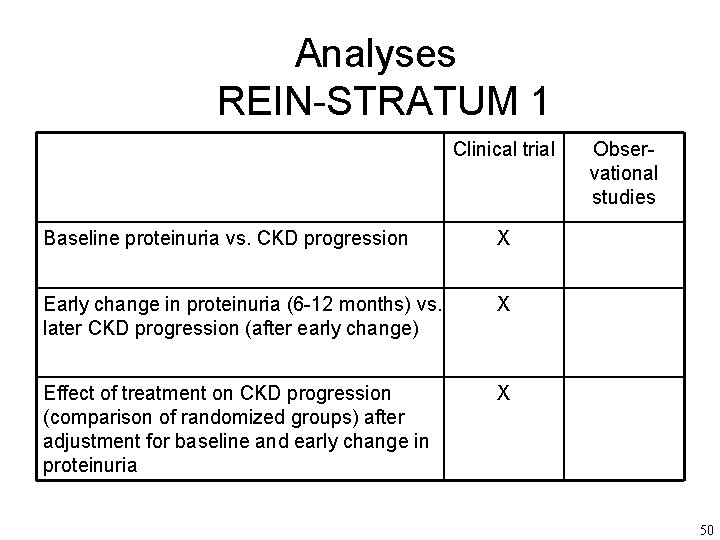
Analyses REIN-STRATUM 1 Clinical trial Baseline proteinuria vs. CKD progression X Early change in proteinuria (6 -12 months) vs. later CKD progression (after early change) X Effect of treatment on CKD progression (comparison of randomized groups) after adjustment for baseline and early change in proteinuria X Observational studies 50
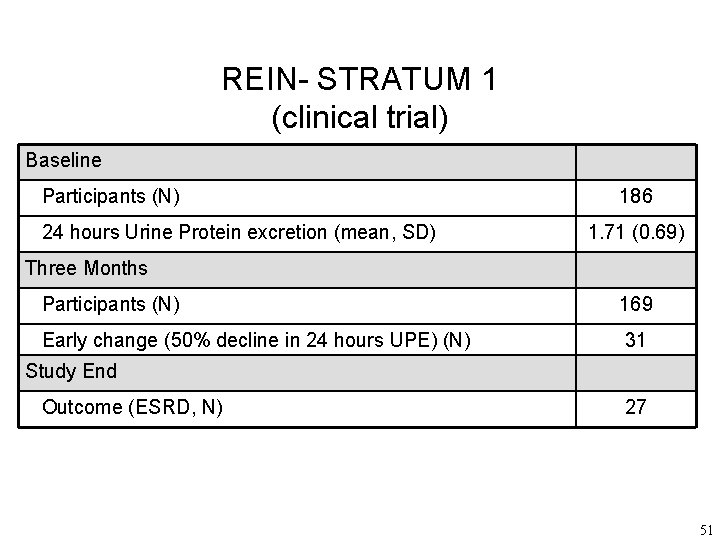
REIN- STRATUM 1 (clinical trial) Baseline Participants (N) 24 hours Urine Protein excretion (mean, SD) 186 1. 71 (0. 69) Three Months Participants (N) 169 Early change (50% decline in 24 hours UPE) (N) 31 Study End Outcome (ESRD, N) 27 51
REIN – STRATUM 1 (clinical trial) Regression of (ESRD) vs. Baseline urine 24 hour Proteinuria Regression of Outcome vs. Baseline and Early Change HR (CI) 1. 75 (1. 01 -3. 03) HR (CI) Baseline urine 24 hour Proteinuria 1. 80 (1. 01 -3. 21) 50% decline in 24 hour Proteinuria 0. 59 (0. 17 -1. 98) Note: If proteinuria is a surrogate marker of kidney disease progression, HR for baseline proteinuria will be >1. 0 and HR for early change will be <1. 0 52
REIN – STRATUM 1 (clinical trial) Regression of Outcome (ESRD) vs. Treatment (ACE inhibitor vs placebo) Treatment Regression of Outcome vs. Treatment Adjusted for Baseline HR (CI) 0. 37 (0. 17 -0. 82) HR (CI) Treatment 0. 34 (0. 15 -0. 79) Baseline 24 hour. UPE 1. 71 (0. 96 -3. 02) Regression of Outcome vs. Treatment Adjusted for Baseline and Early Change (3 months) HR (CI) Treatment 0. 29 (0. 12 -0. 70) Baseline 24 hour. UPE 1. 89 (1. 02 -3. 49) 50% decline in 24 hour. UPE 0. 86 (0. 25 -3. 0) Note: If treatment is effective, HR for treatment will be <1. 0. If proteinuria is a surrogate marker for treatment effect, HR for treatment effect will increase from <1. 0 to closer to 1. 0 in adjusted models. 53
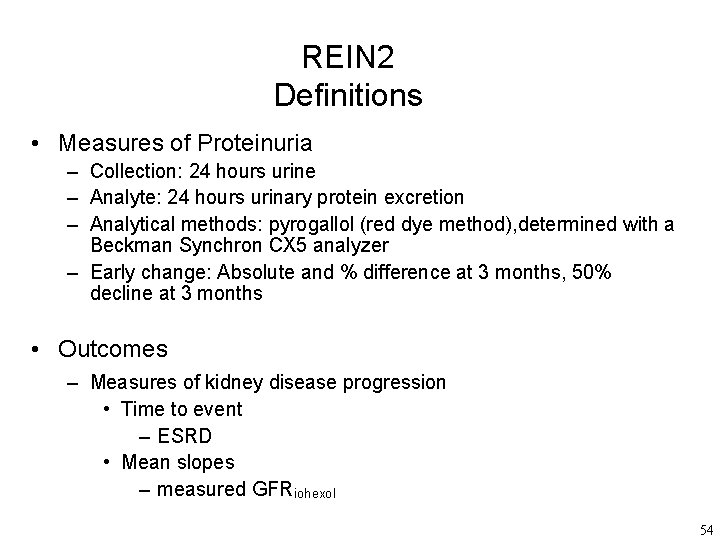
REIN 2 Definitions • Measures of Proteinuria – Collection: 24 hours urine – Analyte: 24 hours urinary protein excretion – Analytical methods: pyrogallol (red dye method), determined with a Beckman Synchron CX 5 analyzer – Early change: Absolute and % difference at 3 months, 50% decline at 3 months • Outcomes – Measures of kidney disease progression • Time to event – ESRD • Mean slopes – measured GFRiohexol 54
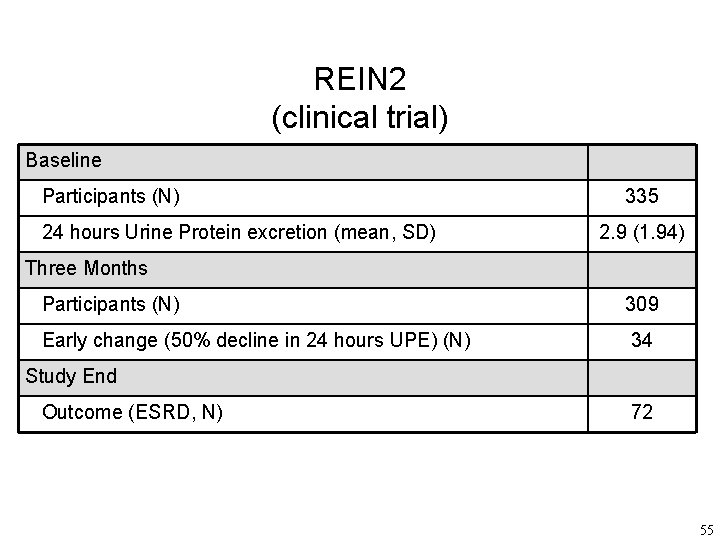
REIN 2 (clinical trial) Baseline Participants (N) 24 hours Urine Protein excretion (mean, SD) 335 2. 9 (1. 94) Three Months Participants (N) 309 Early change (50% decline in 24 hours UPE) (N) 34 Study End Outcome (ESRD, N) 72 55
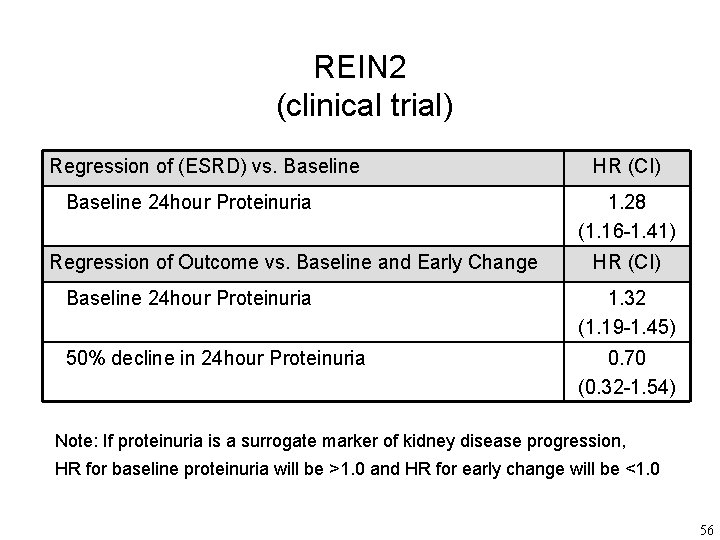
REIN 2 (clinical trial) Regression of (ESRD) vs. Baseline 24 hour Proteinuria Regression of Outcome vs. Baseline and Early Change HR (CI) 1. 28 (1. 16 -1. 41) HR (CI) Baseline 24 hour Proteinuria 1. 32 (1. 19 -1. 45) 50% decline in 24 hour Proteinuria 0. 70 (0. 32 -1. 54) Note: If proteinuria is a surrogate marker of kidney disease progression, HR for baseline proteinuria will be >1. 0 and HR for early change will be <1. 0 56
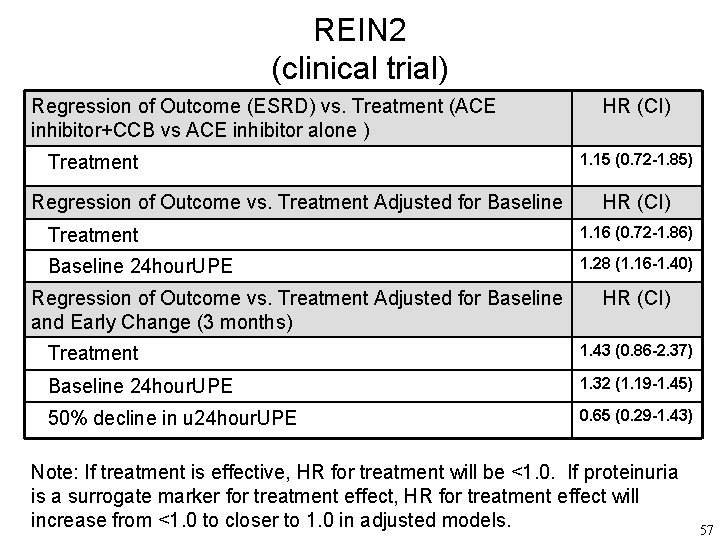
REIN 2 (clinical trial) Regression of Outcome (ESRD) vs. Treatment (ACE inhibitor+CCB vs ACE inhibitor alone ) Treatment Regression of Outcome vs. Treatment Adjusted for Baseline HR (CI) 1. 15 (0. 72 -1. 85) HR (CI) Treatment 1. 16 (0. 72 -1. 86) Baseline 24 hour. UPE 1. 28 (1. 16 -1. 40) Regression of Outcome vs. Treatment Adjusted for Baseline and Early Change (3 months) HR (CI) Treatment 1. 43 (0. 86 -2. 37) Baseline 24 hour. UPE 1. 32 (1. 19 -1. 45) 50% decline in u 24 hour. UPE 0. 65 (0. 29 -1. 43) Note: If treatment is effective, HR for treatment will be <1. 0. If proteinuria is a surrogate marker for treatment effect, HR for treatment effect will increase from <1. 0 to closer to 1. 0 in adjusted models. 57
Extra Slides REIN Stratum 1 + 2 58
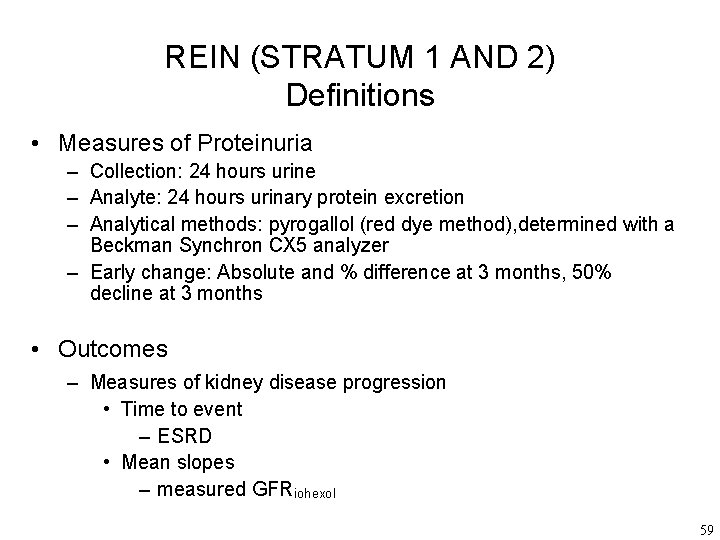
REIN (STRATUM 1 AND 2) Definitions • Measures of Proteinuria – Collection: 24 hours urine – Analyte: 24 hours urinary protein excretion – Analytical methods: pyrogallol (red dye method), determined with a Beckman Synchron CX 5 analyzer – Early change: Absolute and % difference at 3 months, 50% decline at 3 months • Outcomes – Measures of kidney disease progression • Time to event – ESRD • Mean slopes – measured GFRiohexol 59
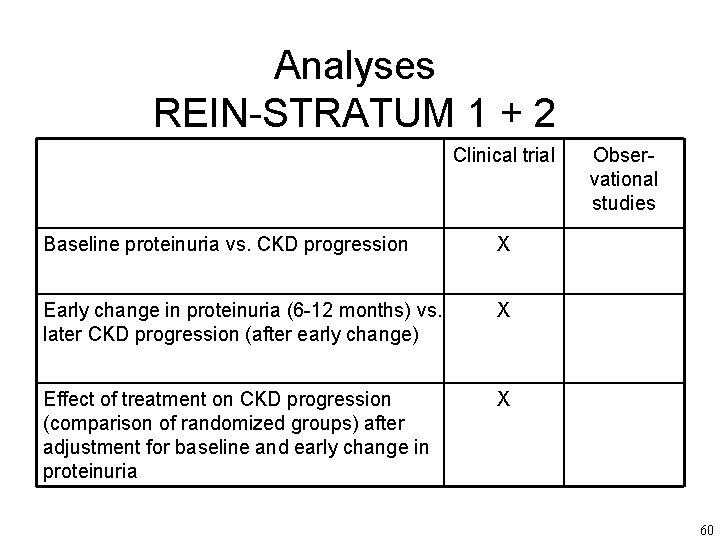
Analyses REIN-STRATUM 1 + 2 Clinical trial Baseline proteinuria vs. CKD progression X Early change in proteinuria (6 -12 months) vs. later CKD progression (after early change) X Effect of treatment on CKD progression (comparison of randomized groups) after adjustment for baseline and early change in proteinuria X Observational studies 60
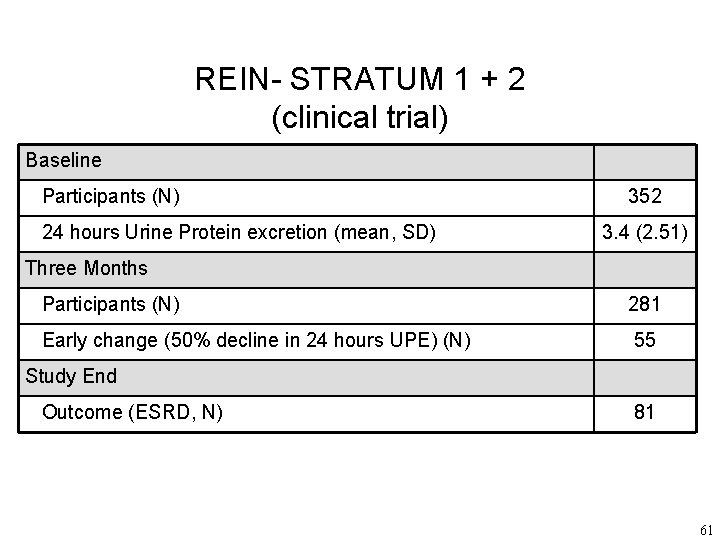
REIN- STRATUM 1 + 2 (clinical trial) Baseline Participants (N) 24 hours Urine Protein excretion (mean, SD) 352 3. 4 (2. 51) Three Months Participants (N) 281 Early change (50% decline in 24 hours UPE) (N) 55 Study End Outcome (ESRD, N) 81 61
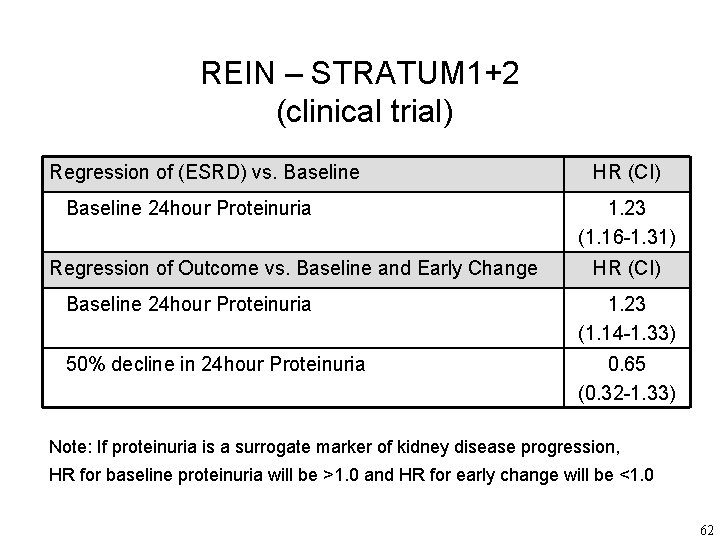
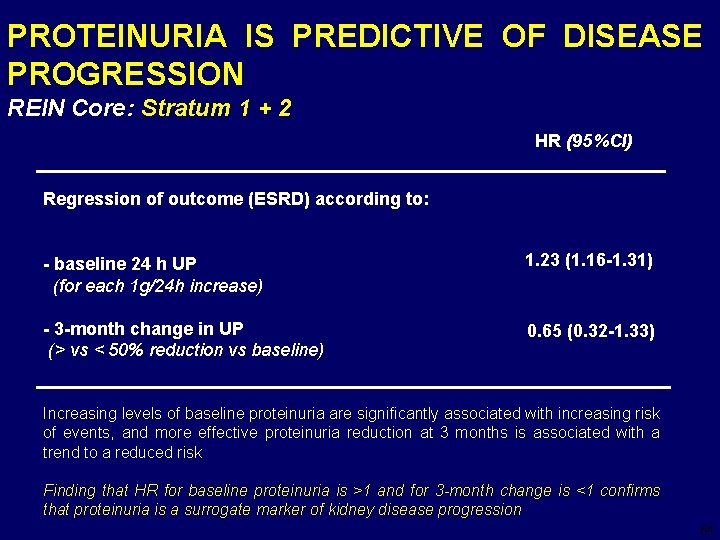
REIN – STRATUM 1+2 (clinical trial) Regression of (ESRD) vs. Baseline 24 hour Proteinuria Regression of Outcome vs. Baseline and Early Change HR (CI) 1. 23 (1. 16 -1. 31) HR (CI) Baseline 24 hour Proteinuria 1. 23 (1. 14 -1. 33) 50% decline in 24 hour Proteinuria 0. 65 (0. 32 -1. 33) Note: If proteinuria is a surrogate marker of kidney disease progression, HR for baseline proteinuria will be >1. 0 and HR for early change will be <1. 0 62
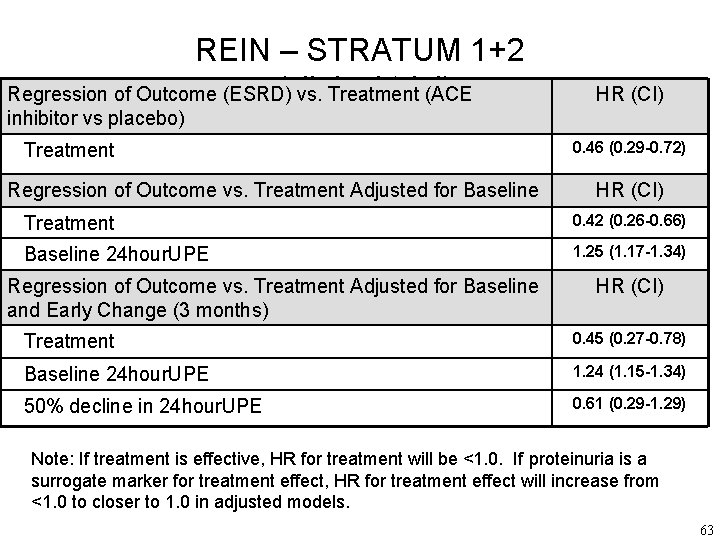
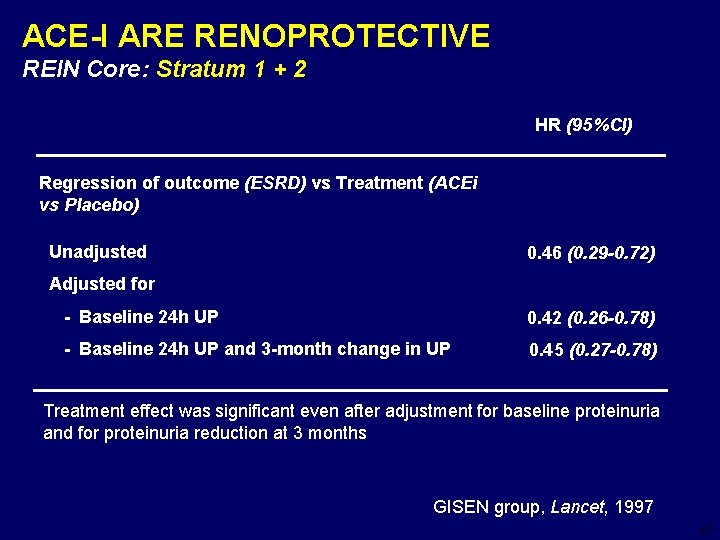
REIN – STRATUM 1+2 (clinical trial) Regression of Outcome (ESRD) vs. Treatment (ACE HR (CI) inhibitor vs placebo) Treatment Regression of Outcome vs. Treatment Adjusted for Baseline 0. 46 (0. 29 -0. 72) HR (CI) Treatment 0. 42 (0. 26 -0. 66) Baseline 24 hour. UPE 1. 25 (1. 17 -1. 34) Regression of Outcome vs. Treatment Adjusted for Baseline and Early Change (3 months) HR (CI) Treatment 0. 45 (0. 27 -0. 78) Baseline 24 hour. UPE 1. 24 (1. 15 -1. 34) 50% decline in 24 hour. UPE 0. 61 (0. 29 -1. 29) Note: If treatment is effective, HR for treatment will be <1. 0. If proteinuria is a surrogate marker for treatment effect, HR for treatment effect will increase from <1. 0 to closer to 1. 0 in adjusted models. 63
PROTEINURIA IS PREDICTIVE OF DISEASE PROGRESSION REIN Core: Stratum 1 + 2 HR (95%CI) Regression of outcome (ESRD) according to: - baseline 24 h UP (for each 1 g/24 h increase) 1. 23 (1. 16 -1. 31) - 3 -month change in UP (> vs < 50% reduction vs baseline) 0. 65 (0. 32 -1. 33) Increasing levels of baseline proteinuria are significantly associated with increasing risk of events, and more effective proteinuria reduction at 3 months is associated with a trend to a reduced risk Finding that HR for baseline proteinuria is >1 and for 3 -month change is <1 confirms that proteinuria is a surrogate marker of kidney disease progression 64
ACE-I ARE RENOPROTECTIVE REIN Core: Stratum 1 + 2 HR (95%CI) Regression of outcome (ESRD) vs Treatment (ACEi vs Placebo) Unadjusted 0. 46 (0. 29 -0. 72) Adjusted for - Baseline 24 h UP 0. 42 (0. 26 -0. 78) - Baseline 24 h UP and 3 -month change in UP 0. 45 (0. 27 -0. 78) Treatment effect was significant even after adjustment for baseline proteinuria and for proteinuria reduction at 3 months GISEN group, Lancet, 1997 65
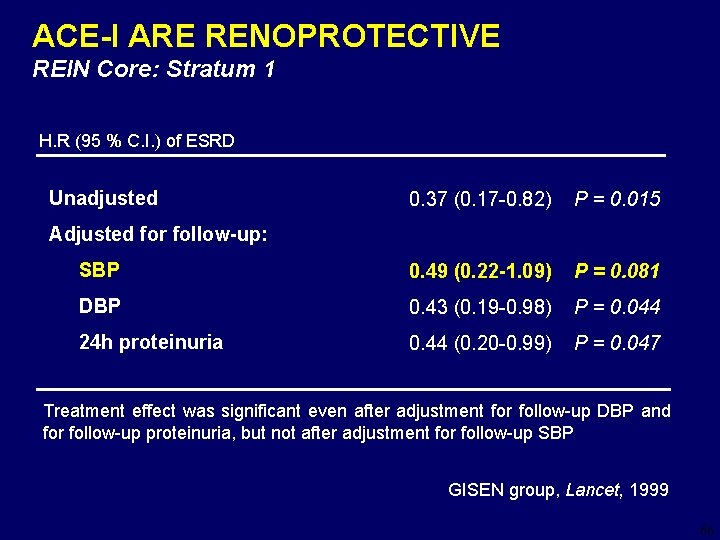
ACE-I ARE RENOPROTECTIVE REIN Core: Stratum 1 H. R (95 % C. I. ) of ESRD Unadjusted 0. 37 (0. 17 -0. 82) P = 0. 015 SBP 0. 49 (0. 22 -1. 09) P = 0. 081 DBP 0. 43 (0. 19 -0. 98) P = 0. 044 24 h proteinuria 0. 44 (0. 20 -0. 99) P = 0. 047 Adjusted for follow-up: Treatment effect was significant even after adjustment for follow-up DBP and for follow-up proteinuria, but not after adjustment for follow-up SBP GISEN group, Lancet, 1999 66
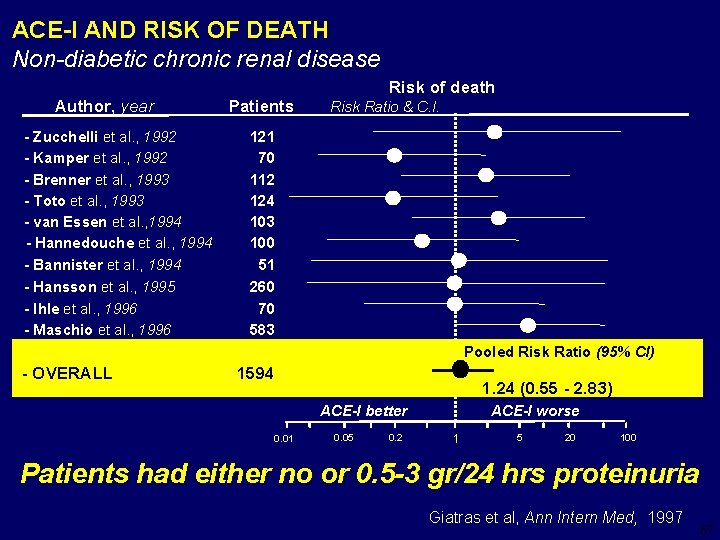
ACE-I AND RISK OF DEATH Non-diabetic chronic renal disease Author, year - Zucchelli et al. , 1992 - Kamper et al. , 1992 - Brenner et al. , 1993 - Toto et al. , 1993 - van Essen et al. , 1994 - Hannedouche et al. , 1994 - Bannister et al. , 1994 - Hansson et al. , 1995 - Ihle et al. , 1996 - Maschio et al. , 1996 Patients Risk of death Risk Ratio & C. I. 121 70 112 124 103 100 51 260 70 583 Pooled Risk Ratio (95% CI) - OVERALL 1594 1. 24 (0. 55 - 2. 83) ACE-I better 0. 01 0. 05 0. 2 ACE-I worse 1 5 20 100 Patients had either no or 0. 5 -3 gr/24 hrs proteinuria Giatras et al, Ann Intern Med, 1997 67