GIS USING R A few examples Jaya Krishnan

")


")


 Classified")


 •")


- Slides: 22
GIS USING R A few examples Jaya Krishnan GIS Consultant jayaakrish@gmail. com
R : Overview • Open source & cross platform software environment (UNIX, Win, Mac) • A programming language • Data manipulation, analysis, statistics, modeling • Excellent graphical capabilities • Flexible, extensible, and customizable • 9000+ packages (functions and codes) • Growing user base • Complements GIS
Examples • Animated thematic map in html player • Interactive map : html • Interactive map or app : ‘shiny’ server • Landsat imagery : Land cover classification • Using R within QGIS • Crime data analysis
Eg 1: Animated map in html player • Input : Unemployment (% of total labor force) 1991 to 2014 • Data source: World Bank • R packages: choroplethr, WDI, reshape • Output : series of choropleth or thematic maps • html player with play and pause options • choropleth. html
…Animated map in html player
Eg. 2 : Interactive map : html • Input : shapefiles (polygon, line, point) • Data source : City of Vancouver • R packages : leaflet, raster • Output : Interactive web map - manual zoom and pan radio buttons to toggle between base maps check boxes to switch layers on/off metadata popup on mouse click / hover • webmap
Interactive map : html
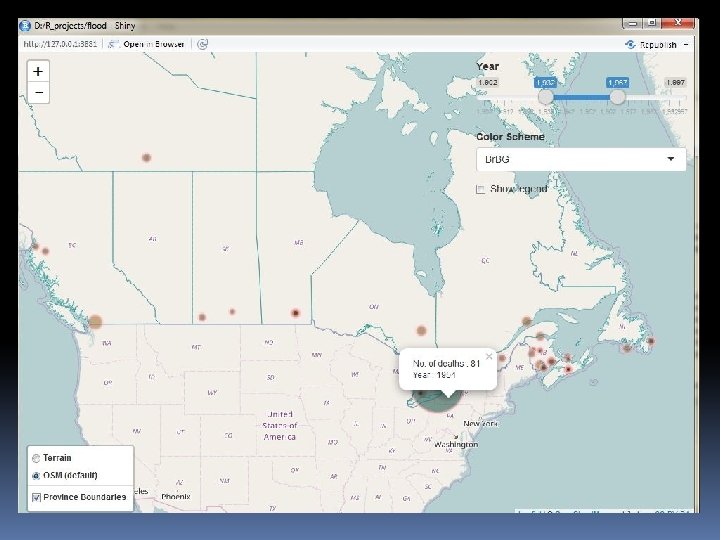
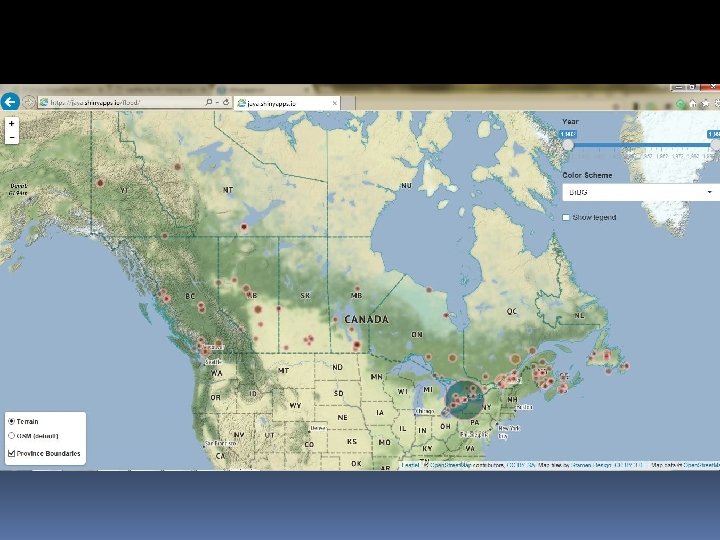
Eg. 3 : Interactive map : ‘shiny’ server • Input : shapefile – flood events (1900 to 1997), province boundaries • Data source : Geogratis, Canada • R packages : shiny, leaflet, rsconnect, rgdal • Output : Interactive web map deployed on ‘shiny’ server Slider bar to choose year(s) of event drop down list of color palette metadata popup on mouse click automated zoom and pan https: //jaya. shinyapps. io/flood/
Eg. 4 : Land cover classification • Input : Landsat 30 m resolution satellite image from 2015 • Data source : US Geological Survey • R packages : raster • Processing • • Stack 7 Landsat bands Clip to study area Plot false color composite Perform unsupervised classification • Output : classified tif image
Input Landsat 8, 2015 satellite image False color composite – (NIR, Red, Green) Classified output : 5 clusters • • • Green : Dense vegetation Brown : Built-up (residential) Yellow: Built-up (commercial) Purple: Sparse veg (mixed class) Blue : Water Caveats Downtown : shadows of tall buildings Mixing of classes
Eg. 5 : Using R within QGIS • Several statistical R scripts to choose from in QGIS • Option to create scripts
Using R within QGIS • Input : Li. DAR tile from 2013 (cluster of trees) • Data source : City of Vancouver • R packages : r. Li. DAR, rgl • Processing • reading Li. DAR tile • plotting in 3 D • Output : png image
Li. DAR plot of trees
Eg. 6 : Crime data analysis • Input : Crime data, (2003 -2016) • Data source : City of Van • No. of points : 529, 038 • R packages : sp, spatstat, rgdal
… Crime data analysis Plot : entire data
… Crime data analysis Plot : subset - Break and Entry Residential
… Crime data analysis Quadrat Counting
… Crime data analysis Kernel Density – indicator of point density
… Crime data analysis
Thank you Jaya Krishnan jayaakrish@gmail. com