GIS software introduction Basic concepts Arc catalogue Arc

GIS software introduction

Basic concepts �Arc catalogue � Arc Map. � Arc Toolbox

Basic concepts �Arc catalogue data holdings, for managing your database designs, and for recording and viewing metadata. � Arc Map is used for all mapping and editing tasks, as well as for map-based analysis.

Cont. Arc Toolbox is used for data conversion and geo processing. Using these three applications together, you can perform any GIS task, simple to advanced, including mapping, data management, geographic analysis, data editing, and geo processing.
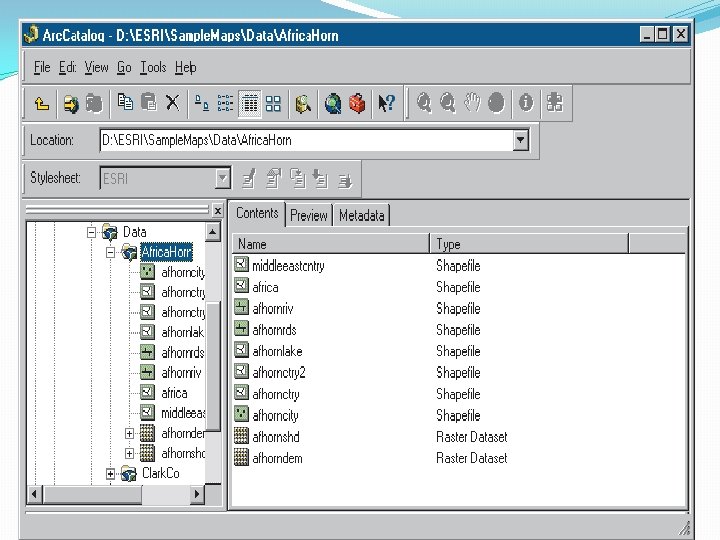

Creating shape files Folder in Arc. Catalog Shapefiles in Arc. Catalog

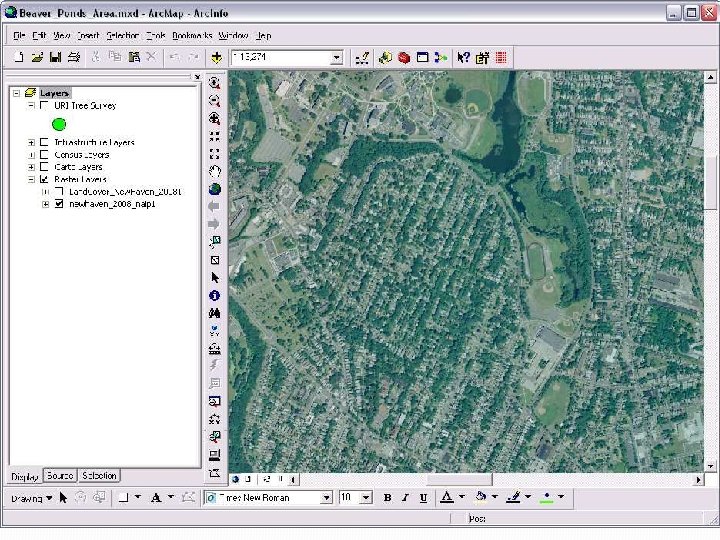
Main menue Standard Table of contents Drawing tool bar Data frame Tools tool bar

Storing Data Coverages Shapefiles Feature Countries Counties. shp Counties. shx ROADS Counties. dbf Counties. prj Counties. sbn Building Counties. sbx

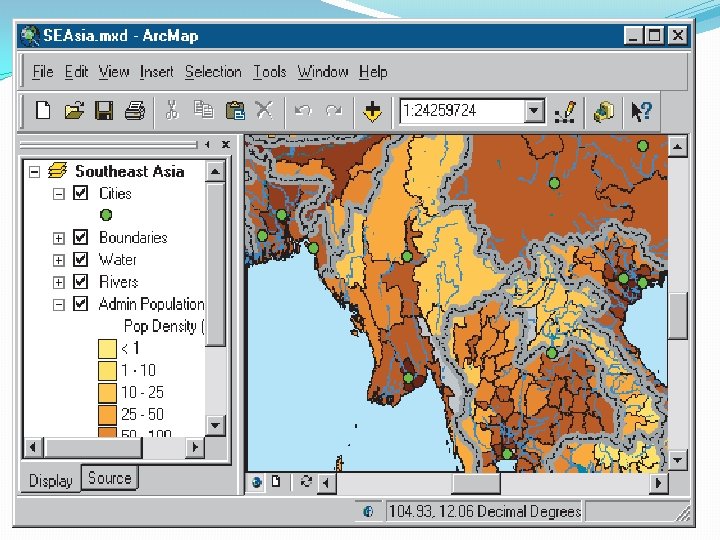
Arc Map �Arc Map lets you create and interact with maps. In Arc Map, you can view, edit, and analyze your geographic data. �You can query your spatial data to find and understand relationships among geographic features.

Arc Map Display information from a database � Data Editing Querying � Analyzing � Graphing � Reporting �

Arc Map �You can symbolize your data in a wide variety of ways.

Arc Toolbox �Arc Toolbox is a simple application containing many GIS tools used for geo processing.

ARC MAP �Arc Map is the tool for creating, viewing, querying, editing, composing, and publishing maps. �Most maps present several types of information about an area at once. This map of Green valley contains three layers that show public buildings, streets, and parks. �You can see the layers in this map listed in the table of contents. Each layer has a check box that lets you turn it on or off.

Table of content Arc Map Table of Contents Point features Line features Area features

Zoom in and get information �If you want to see an area of the map in greater detail, you can zoom in to the map. 1. Click the Zoom In button. 2. Drag a box around one of the parks to zoom in to it.

Tools tool bar Moving around the map Zoom in or out Pan Full extents Back or forward one display Zoom to layer

Feature properties � 1. Right-click water mains arc in the Arc Map table of contents and click Properties.

2. Click the Symbology tab on the Properties dialog box.

Properties �Click Quantities. The panel changes to give you controls for drawing with graduated colors

Click View and click Layout View.

Data Frame �Now you can see the map on a virtual page. The layers of data appear in a data frame on the page. Data frames are a way of organizing the layers you want to see together on a map.

Add map Elements

Map Data Sources
- Slides: 25