GIS is composed of layers Layers landwater roads


 •")
 – Spatial and attribute")


 • Most common vector data format • Openly published files specs –")


 – Scanned USGS")


- Slides: 28
GIS is composed of layers • Layers – – land/water roads urban areas pollution levels • Data can be represented by VECTORS, or • Data can be represented by RASTERS
Vector and Raster Data Models
Vector Data Model • Discrete – Boundaries are well defined (x, y coordinates) • Geographic features are represented as: • Points • Lines • Polygons Every object is given a location
Types of Vector Data Models • Georelational (e. g. shapefiles) – Spatial and attribute stored separately • “geo” – graphic/spatial part • “relational” – database part (tabular) • Classical approach to vector data • Object-based (oriented) (e. g. geodatabase) • Spatial and tabular component are stored as a single system • Spatial features can have properties and methods • Recent trend towards object-based model
Vector Data File Types • Shapefiles – georelational • Coverage – georelational • Geodatabase – object-based (oriented) • DXF Digital Exchange Format (Autocad) ASCII w/binary code maintains layers • DLG Digital Line Graph - USGS (1: 100, 000 & 1: 24, 000) ASCII
Maps as numbers • Binary 0000 1111 – Eight bits in a row are termed a byte – 256 combinations or 0 to 255 • ASCII text- American Standard Code for Information Interchange - 256 standard meanings for the values that fall into one byte. (letters, numbers, special characters) – http: //www. asciitable. com/
Shapefiles (~1990) • Most common vector data format • Openly published files specs – non proprietary • Simple file structure – 3 main files with same name but different 3 letter extension • Local. Streets. shp Local. Streets. dbf Local. Streets. shx – Attribute data stored in a d. Base file (. dbf) – Geometry and location data stored in the. shp file – The. shx provides the “glue” • Does not support true topology
Topology – Spatial Relationships • Study of geometric properties that do not change when forms are bent, stretched, etc… • Knowledge about relative spatial positioning of features – How are features connected and which features are adjacent to each other – Directed lines are called arcs (have length and direction) – Points where arcs meet or intersect are called nodes node arc node
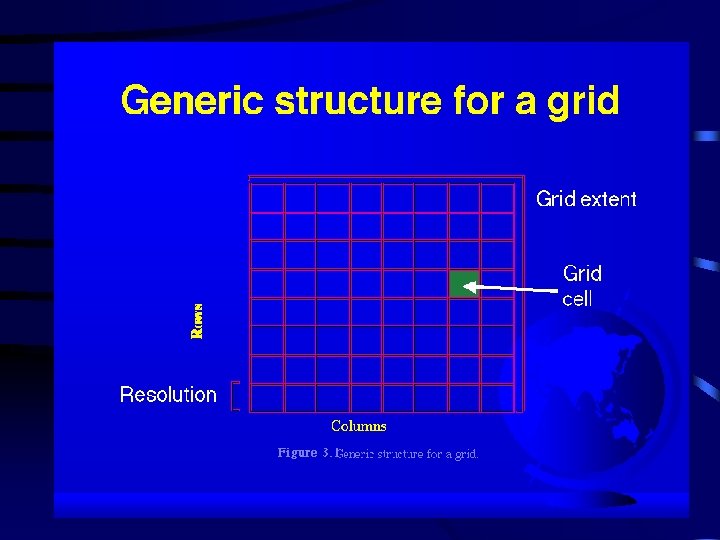
Raster Data Model • The world is composed of cells/pixels arranged in a grid • Each cell/pixel is assigned a numeric value – Integer – (no decimal) – Floating-point (decimal) (However data may be represented by codes) • The size of the cell/pixel determines the resolution Every location given an object
Creating A Raster • Overlay grid on real world • give each cell a value
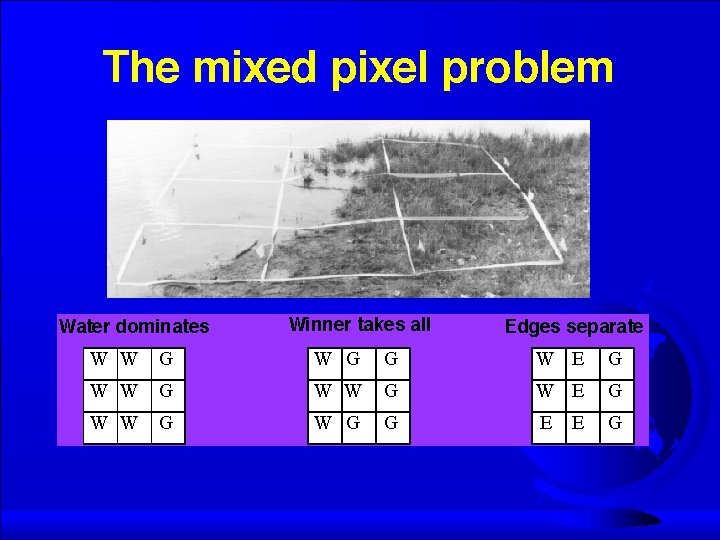
Cell Values • Assume only one value per cell in any given layer • How do you decide what value to give the cell? – Value of greatest proportion? – Value of the most important feature? – Some systems allow for percent composition, edge effect
Characteristics of a Raster • Resolution – smallest unit discernible – often grid size, but not always • Orientation – angle that grid makes with true north • Value – information stored in cell
Characteristics of a Raster • Zones – areas of continuous values • e. g. county, land parcels, etc. • Class - term used to describe all the zones of same value in a layer – e. g. state parks
Characteristics of a Raster • Location – each cell has a unique location • often defined by bottom left corner • X, Y coordinate
Raster Data Structure and Compression – Lossless – no information is lost – Lossy – information is degraded • How is the raster data stored? – Cell-by-cell Encoding - data not compressed – Run-Length Encoding – data compressed – Quad Tree – data compressed – Wavelet – data compressed (lossy)
Storing the Information • Full length encoding – store every single cell’s value individually
Storing the Information • Run Length encoding – compress data
Storing the Information • Quadtree Encoding – compress data e. g. 0 and 2 are homogenous And 1 and 3 are broken down further
Types of Raster Data • Remotely Sensed Images – Satellite • Landsat (http: //landsat. usgs. gov/) • AVHRR (http: //edc. usgs. gov/products/satellite/avhrr. html) • SPOT (http: //www. spot. com/) – Digital Elevation Models (DEMs) • U. S. Geologic Survey (USGS) DEMs • LIDAR (light detection and ranging) • Multibeam sonar (acoustics for capturing depth information) – Digital Orthophotos
Types of Raster Data – Images • Digital Raster Graphics (DRGs) – Scanned USGS topographic maps (http: //topomaps. usgs. gov/drg/) • Graphic Image Files – historic aerial photos, scanned paper maps – – . tif (Tagged Image File Format) Associated world file provides geosid (Lizard. Tech Mr. SID) reference. . img (ERDAS Imagine). jpg (Joint Photographic Experts Group). Many packages work on RECTIFYING these images photograph’s scale is not constant across image
Raster Data Formats – ESRI Grids • Proprietary format • Discrete – integer (whole number) • Continuous – floating point (number with decimals)
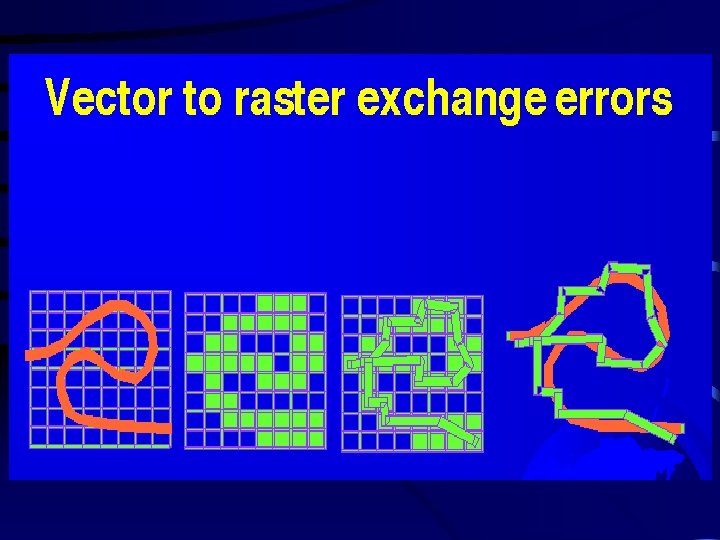
Raster and Vector Summary • Vectors have advantage of accuracy but not good with continuous fields • Vectors were used first - digitizing • Earliest include ASCII (x, y coordinates but got too large) then binary took over. • Raster not good with lines or points but good with continuous coverage areas. • Raster has the mixed pixel problem.
Raster Advantages: • Simple data structure • Compatible with remotely sensed or scanned data • Simpler spatial analysis procedures Raster Disadvantages: • Requires greater storage space on computer • Depending on pixel size, graphical output may be less pleasing • Projection transformations are more difficult (and can be time consuming) • More difficult to represent topological relationships • Positional precision set by cell size
Vector Advantages • Requires less disk storage space • Topological relationships are readily maintained • Graphical output more closely resembles hand-drawn maps • Preferred for network analysis Vector Disadvantages • More complex data structure • Not as compatible with remotely sensed data • Software and hardware often more expensive • Some spatial analysis procedures may be more difficult • Overlaying multiple vector maps is often time consuming
Triangulated Irregular Networks TIN • A data model commonly used to represent terrain heights. • TIN forms a connected network of triangles • It is not a raster or vector format