GIS Geographic Information Systems MAP SHEETS Zoning Poly
 MAP SHEETS Zoning, Poly Streams, Line Wells, Point Roads, Line")

: computer information system that can input, store,")

 • created")


")


- Slides: 76
GIS (Geographic Information Systems) MAP SHEETS Zoning, Poly Streams, Line Wells, Point Roads, Line Buildings. Poly
GIS Overview
What is GIS? GIS (Geographic Information System): computer information system that can input, store, manipulate, analyze, and display geographically referenced (spatial) data to support decision making processes.
Tools for a GIS • Hardware - Computer - Printer / Plotter - Digitizer - Scanner • GIS Desktop Software (ESRI, Inc. – Arc. View) • CAD Software (Auto. Desk - Auto. CAD) • Multimedia (Photos, Video, 3 D Models) • World Wide Web (ESRI, Inc. – ARCIMS) • Personnel
GIS Data Sources Digitized and Scanned Maps • purchased, donated, free (Internet) • created by user Data Bases – Tables of data GPS – Global Positioning System • accurate locations Field Sampling of Attributes Remote Sensing & Aerial Photography
Conventional Information Systems • Answer the following questions: - Who ? - What ? - When ? - Why ? - How ?
GIS answers the following • Location: What is at. . . ? • Condition: Where is it? • Trends: What has changed since. . . ? • Patterns: What spatial patterns exist? • Modeling: What if…? Exploring data using GIS turns data into information into knowledge
Data • Location Data How Many? – What Kind? – Where? • Scale of Data Global to Local • Data Presentation Words, Charts, Graphs, Tables, Maps, Photos
GIS Data Raster Images - grids • “pixels” • satellite images • aerial photos Vector - grids • features: points, lines & polygons • attributes: size, type, length, etc.
Databases • Not easy to interpret
Visualizing Data A picture is worth a thousand words
“Layers” of GIS Data Municipalities
“Layers” of GIS Data Census Tracts
“Layers” of GIS Data Lakes and Rivers
“Layers” of GIS Data Polluting Companies
“Layers” of GIS Data Schools
GIS Connects Graphics to Data
Maps and Databases are Interactive
Queries and Restrictions
GIS Turns Data Into Information
GIS Examples
GIS Applications • Business Site Location, Delivery Systems, Marketing • Government Local, State, Federal, Military • Economic Development Population Studies, Incomes, Census and Demographic Studies • Emergency Services Fire & Police • Environmental Monitoring & Modeling • Industry Transportation, Communication, Mining, Pipelines, Healthcare • Public Health Epidemiology Studies • Urban Planning Land Use, Historic studies, Environmental and Conservation Studies, Housing Studies, Crime Analysis • Politics Elections and Reappointment • Education Research, Teaching Tool, Administration Wherever Spatial Data Analysis is Needed
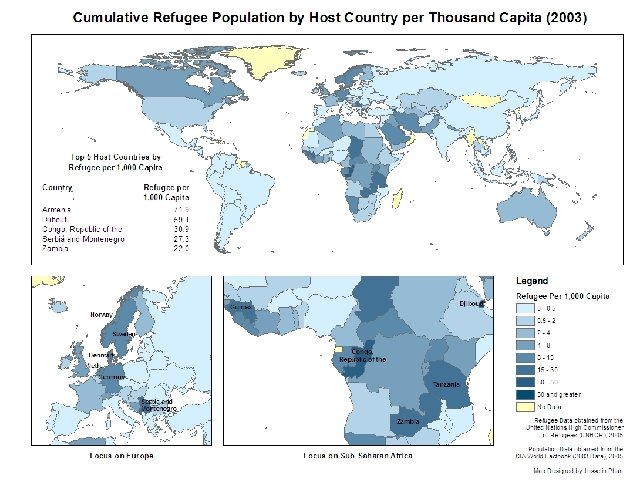
Global Example
Number of AIDS Cases
AIDS Cases per 10, 000 persons
National Level
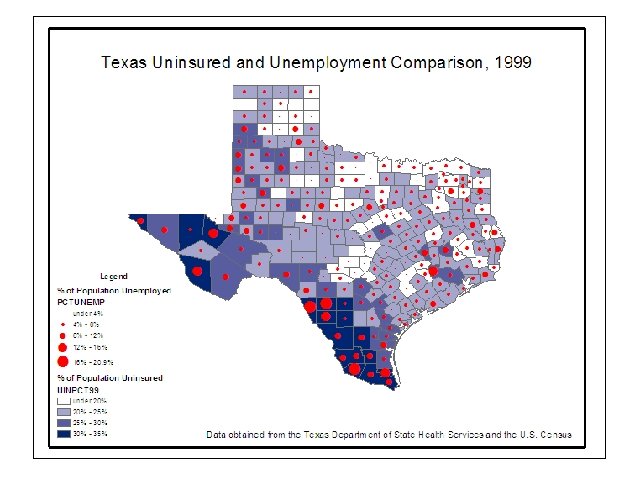
State Level Maps
Percentage of Uninsured by Ages 0 -18, 1999 Ages 19 - 64, 1999
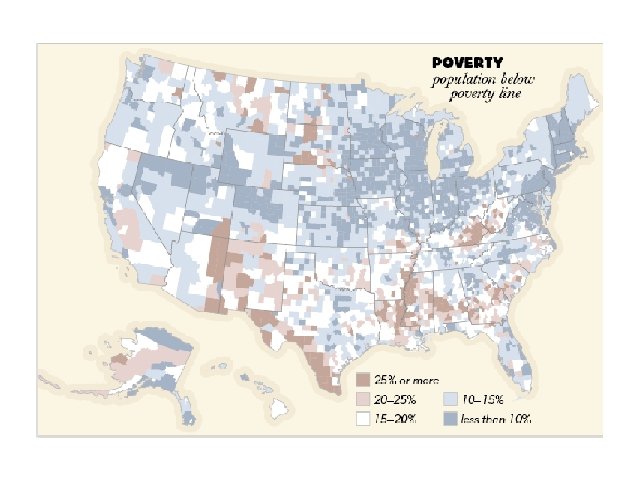
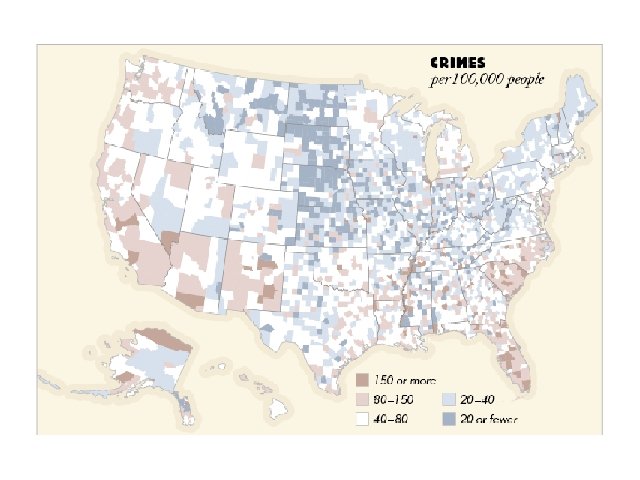
Demographic Studies Brookings Institution Report – Back to Prosperity
Source: United States House of Representatives http: //www. house. gov
Source: The Washington Post http: //www. washingtonpost. com/wp-srv/elections/2004/pa/
Higher Education Locations Note the proliferation of schools located in SW Pennsylvania where the majority of Competitive Districts lie. Source: 50 States. com http: //www. 50 states. com/college/penn. htm http: //www. 50 states. com/cc/penn. htm Pennsylvania Commission for Community Colleges http: //www. . pacommunitycolleges. org/content/blogcategory/14/40/
School Location and Census Block Groups By District Competitiveness – 2006 Census Block Group centroids and 2 -Mile buffers around each school. Using this method we can calculate how many people between 18 -24 live within 2 miles of each school, and thus approximate how many persons 18 -24 live in each Congressional District. Source: U. S. Census 2000
Competitive and Moderately Competitive Districts for 2006 Election Representative Margin of 2004 Victory Population 18 -24 Gerlach 6, 022 151, 351 Weldon 60, 450 117, 162 Fitzpatrick 39, 335 43, 484 Schwartz 43, 977 119, 980 Dent 56, 042 40, 697 Holden 58, 207 28, 135 Sherwood 175, 871 48, 964 Source: U. S. Census Washington Post
Regional Level
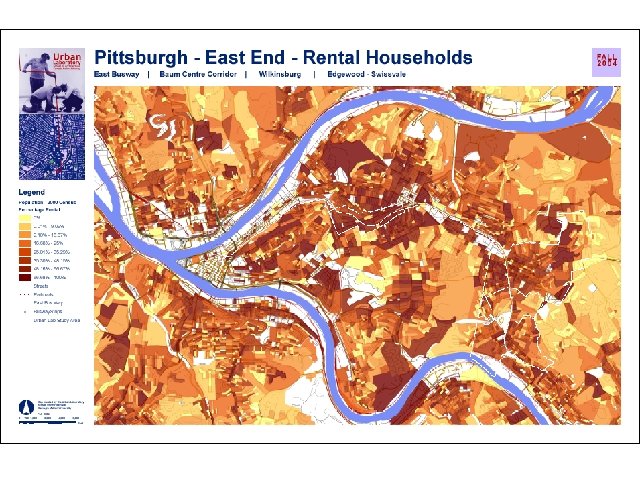
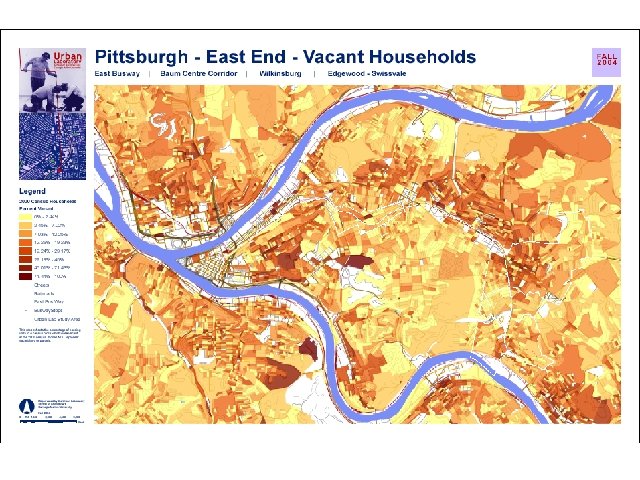
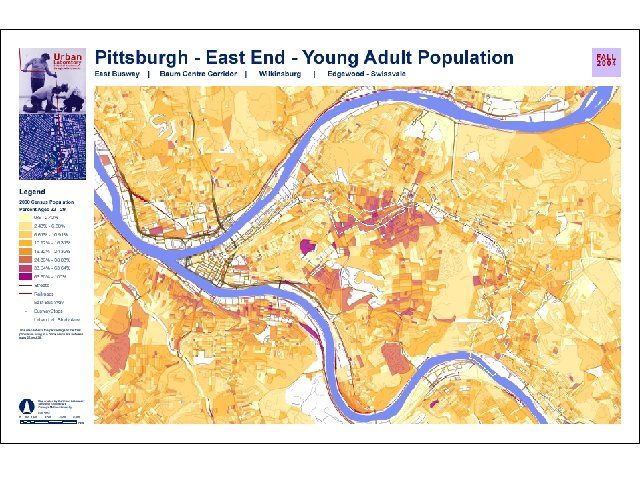
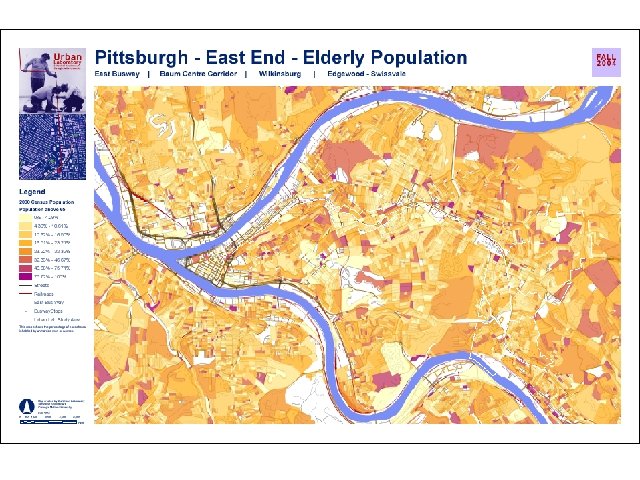
Allegheny County Housing Data obtained from U. S. Census
Children with Elevated Blood Levels Note: Cases aggregated to Census Tracts Data obtained from U. S. Census and Allegheny County Health Dept
Cases Zoomed to Neighborhoods Data obtained from U. S. Census and Allegheny County Health Dept
Cases Compared to Income Data obtained from U. S. Census and Allegheny County Health Dept
Cases by Educational Attainment Data obtained from U. S. Census and Allegheny County Health Dept
Environmental Analysis
Neighborhood Level
Green spaces near Schools
Green spaces near Schools
Aerial Photos Polygon buffer created ¼ and ½ mile around schools Data obtained from PASDA and City of Pittsburgh – City Planning Dept.
Aerial Photos Zoomed Helps identify types of green spaces near schools Ball fields vs. Urban Boulevards Data obtained from PASDA and City of Pittsburgh – City Planning Dept.
Food Sources Data source US Census
Neighborhood Walkability
Emergency Management Layers
ESRI To learn more, visit: http: //www. esri. com/industries. html
GIS Lab Overview
Arc. GIS Software ESRI, Inc. http: //www. esri. com • Desktop GIS -Arc. View/Arc. Map, Arc. View Extensions -Arc. Info, Arc. Editor -Arc. Reader (Free), Arc. Explorer (Free) • Server GIS -Arc. IMS (WEB) -Arc. GIS Server • Mobile GIS -Arc. PAD
Arc. Map
Layers • Shapefiles, databases, aerial images, CAD files • Added with the “Add Data” button
Project Files (. MXD)
Project Files “Point to” layers Add multiple layers Symbolize layers
Arc. Catalog Importing and exporting map layers Renaming map layers Copying map layers
Desktop GIS • Arc. Toolbox
WEB Based GIS • Arc. IMS -An Internet map server for geopublishing maps, data, and metadata: implementing portals; and leveraging Web services.
Desktop GIS Arc. Info – used by • GIS professionals who build and maintain comprehensive GIS processes. • Cartographers • Scientists • Data administrators or data providers • GIS professionals and administrators who import and export data between many sources
Gistutorial Step by Step Lab Tutorials
Step by Step Instructions
Accessing GIS Data • GIS Tutorial - CD ROM or • CMU Thunderbolt Server - \thunderbolt. heinz. cmu. edulobbyacade mic90784
Copy to C: Drive
IMPORTANT!!!!! YOU MUST WORK FROM C: Gistutorial NOT U: Drive NOT C: Desktop NOT C: My Documents
Saving Homework Files Must save files in C: GistutorialAnswersAssignment 1…
Zip Files Zip all GIS files, Word docs, etc. into one. ZIP file
Copy ZIP File to \thunderbolt