Giant Wave Triggered by 2004 Sumatra Earthquake Map

Giant Wave Triggered by 2004 Sumatra Earthquake Map credit: http: //www. asiantsunamivideos. com/ Page created by W. G. Huang

Largest Earthquakes in the World Since 1900 Location Date UTC Magnitude Coordinates 1. Chile 1960 05 22 9. 5 38. 24 S 73. 05 W 2. Prince William Sound, Alaska 1964 03 28 9. 2 61. 02 N 147. 65 W 3. Andreanof Islands, Alaska 1957 03 09 9. 1 51. 56 N 175. 39 W 4. Off the West Coast of Northern Sumatra 2004 12 26 9. 0 3. 30 N 95. 78 E 5. Kamchatka 1952 11 04 9. 0 52. 76 N 160. 06 E 6. Off the Coast of Ecuador 1906 01 31 8. 8 1. 00 N 81. 50 W 7. Northern Sumatra, Indonesia 2005 03 28 8. 7 2. 08 N 97. 01 E 8. Rat Islands, Alaska 1965 02 04 8. 7 51. 21 N 178. 50 E 9. Assam Tibet 1950 08 15 8. 6 28. 5 N 96. 50 E 10. Ningxia Gansu, China 1920 12 16 8. 6 36. 60 N 105. 32 E 11. Kuril Islands 1963 10 13 8. 5 44. 90 N 149. 60 E 12. Banda Sea, Indonesia 1938 02 01 8. 5 5. 05 S 131. 62 E 13. Kamchatka 1923 02 03 8. 5 54. 00 N 161. 0 E Source: USGS Page created by W. G. Huang

Map Credit: USGS Page created by W. G. Huang

印尼蘇門答臘地震的震源參數 USGS Earthquake Information Centre gives the following parameters for the earthquake location and magnitude. 2004年 12月26日 規模 (Mw) 9. 0 發震時間 (Origin time) 國際標準時間 2004/12/26 00: 58: 53. 00 震央位置 (epicenter) 北緯 3. 267 度 ; 東經 95. 812 度 震源深度 (Focal depth) 10 公里 2005年 03月28日 規模 (Mw) 8. 6 發震時間 (Origin time) 國際標準時間 2005/03/28 16: 09: 00. 00 震央位置 (epicenter) 北緯 2. 065 度 ; 東經 97. 010 度 震源深度 (Focal depth) 28 公里 USGS Earthquake Information Centre Page created by W. G. Huang

Spatial and temporal aftershocks distribution from 26/12/2004 to 28/03/2005 A change in the pattern of distribution of the aftershocks is observed since January 26 th. A cluster centered on Nicobar Islands appears. Map Credit: EMSC Page created by W. G. Huang

Aftershocks distribution since 28/03/2005 New pattern in aftershocks distribution on April 10 th ! The seismicity moved 400 km to the South East Map Credit: EMSC Page created by W. G. Huang

Aftershock animation of the Sumatra earthquake of December 26, 2004年印尼蘇門答臘地震的主震與餘震分佈 (2004. 12. 25 ~ 2005. 01. 12) Animated GIF of the seismic activity in the Sumatra Andaman islands region from December 25, 0: 00 UTC until January 12, 0: 00 UTC. All epicenters shown were automatically determined using stations of the GEOFON and partner networks in the European Mediterranean area. The time step between the frames is one hour. The color code refers to the time elapsed between the earthquake and the time indicated at the right bottom, i. e. the youngest events are always plotted in red. Map Credit: GFZ Page created by W. G. Huang

3 D Visualization of Recent Sumatra Earthquake 3 D Visualization To view this visualization, viewers need to download and install the free viewer program i. View 3 D (http: //www. ivs 3 d. com/products/iview 3 d). Scripps Institution of Oceanography The 26 December 2004 and the 28 March 2005 events are shown as red diamonds in the scene (the deeper diamond represents the 28 March event). The orange spheres represent aftershocks (magnitudes 4. 7 to 6. 1) in the region since 28 March 2005, and the gray spheres indicate aftershocks from the December event. The yellow spheres on the surface show the fault rupture due to the December event, and the purple cross hairs on the surface indicate the possible error in the rupture location. Credit: University of California Page created by W. G. Huang

USGS: Why the March Tsunami was Smaller than the December Tsunami The first factor, obviously, is magnitude in March, it was 8. 7, in December 9. 0. the magnitude of an earthquake is a function of the rupture area and the average amount of slip throughout the rupture. The second factor is water depth and is probably the biggest contributor to the difference in the two tsunamis, Geist said. "In December, a lot of the energy in the initial earthquake rupture occurred in deep water (about 1 to 2. 5 miles), whereas the March earthquake occurred beneath the shelf just offshore mainland Sumatra at water depths of less than. 6 miles or even beneath Sumatra itself. The third factor is the depth below the surface of the earth where most of the fault slip occurred. In March, most of slip occurred at depths of 12 to 25 miles below the surface, whereas for the December earthquake, slip may have extended all the way to the sea floor at the oceanic trench. The last factor is that there was a significant difference between the two events in the primary direction of tsunami-wave "focusing, " which affects the distant or "far field" impact of the tsunami. U. S. Department of the Interior, U. S. Geological Survey Office of Communication Eric Geist Released: 4/27/2005 Page created by W. G. Huang

2004年 12月26日印尼蘇門答臘-安達曼地震 Earthquake in Sumatra-Andaman on December 26 th, 2005 Map Credit: EMSC Page created by W. G. Huang
 Last Updated: 2005 Jan.")
Giant Thrust Earthquake & Faulting Yuji Yagi (IISEE, BRI, 2004) Last Updated: 2005 Jan. 12 Page created by W. G. Huang
 seismogram")
Giant Thrust Earthquake & Faulting Chen Ji, Caltech Intitial body wave (short period) seismogram analysis shows most slip in southern 400 km (Chen Ji, Caltech) Page created by W. G. Huang

HENCE INITIAL REPORT: CJ's Comments: It is noteworthy that the seismic data we used only could constrain the slip in first 220 sec. So we can not totally rule out later smaller slip occurred further north. Initial estimates from the aftershock distribution show the magnitude 9. 0 Sumatra Andaman Earthquake ruptured a patch of fault roughly the size of California (~ 406000 km 2). Page created by W. G. Huang

Speed and size of the Sumatra earthquake Nature, 31 March 2005, vol 434 pp 581 -2 ØStudies using body waves show that rupture started at the epicenter at the south end of this zone and propagated northward, with most of the rapid slip on the southern third of the rupture. ØInitial estimates (CMT solution) based on surface waves at at periods 300 s and below measured a moment (4 x 1029 dyne cm) given Mw = 9. 0. Seth Stein and Emile A. Okal Department of Geological Sciences 1850 Campus Drive Northwestern University, Evanston Illinois 60208 USA Stein and Okal indicate that Sumatra earthquake slowly released its energy by slip along a 1, 200 km fault, generating a long rupture that contributed to the subsequent tsunami. Page created by W. G. Huang

From an analysis of the Earth’s normal modes 0 S 2 , 0 S 3 and 0 S 4, which can be observed by Fourier analysis of long seismograms. 0 S 2 yields Mo = 1. 3 x 1030 dyne cm 3 times bigger than inferred from 300 s surface waves (4 X 1029 dyne cm) corresponding Mw is 9. 3, compared to 9. 0 from surface waves. The revised estimate makes this earthquake to be the second largest earthquake (after the 1960 Chilean Earthquake, Mw=9. 5) recorded since the invention of the seismometer in the late 1800 s. 0 S 2 period 3223 s, 54 min 0 S 3 period 2135 s, 36 min 0 S 4 period 1546 s, 26 min 0 S 5 period 1191 s, 20 min Page created by W. G. Huang

Comparison of predicted tsunami amplitudes assuming the entire fault ruptured or only the southern segment did. Page created by W. G. Huang

Tsunami Excitation Entire Fault Southern Segment Only The largest tsunami waves would have missed Sri Lanka if only the southern segment of the fault had ruptured. Page created by W. G. Huang

We now have a clearer picture of the seismic features of last year’s gigantic event Comparison of fault areas, moments, magnitudes, amount of slip shows this was a gigantic earthquake. Seismic moment 2. 5 times that inferred from surface waves implies slow slip on area larger It seems that the slow slip on the northern helped to excite the large tsunami amplitudes in Sri Lanka and India. Entire 1200 -km long aftershock zone likely slipped. Consistent with split mode amplitudes and tsunami. Page created by W. G. Huang
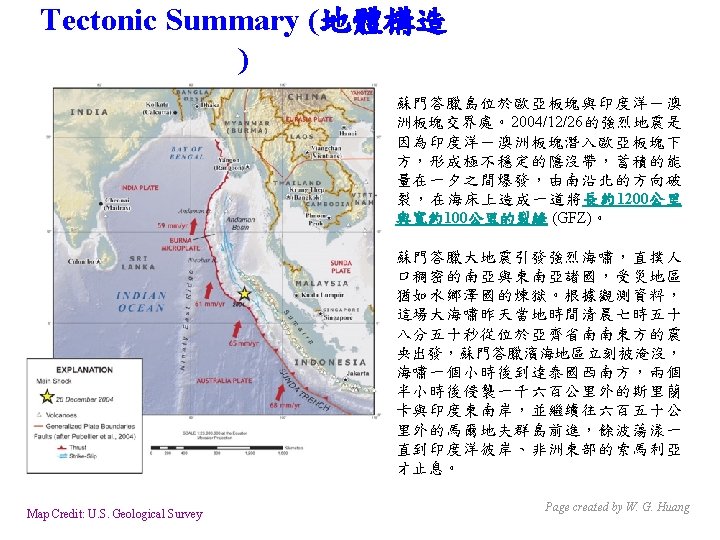

地體構造 Map Credit: Vector One GIS and Visualisation, Berlin, Germany Page created by W. G. Huang

HMS Scott Map Credit: The United Kingdom Hydrographic Office Page created by W. G. Huang

Images of the ocean floor near the epicentre of December's giant Asian earthquake (by the Royal Navy's hydrographic survey ship HMS Scott ) Looking south, the purple area marks where the ocean floor, which sits on the Indian tectonic plate, is pushing into, and moving under, the Burma plate. The Indonesian landmass sits atop the Burma plate. A rupture 30 km below this area produced violent shaking, triggering the tsunami. The images show clearly the boundary between the Indian and Burma tectonic plates a region known as the Sunda Arc. The flat Indian plate shows up in purple, which turns to blue as this portion of the Earth's oceanic crust disappears underneath the Burma micro plate (part of the Eurasian plate). The forces created by this process have rumpled and buckled the surface rocks, whose folds show up in green and yellow. Image: Royal Navy UK Page created by W. G. Huang

2004年 12月26日遭受南亞地震海嘯所侵襲的地區 Map Credit: Compare Infobase Pvt. Ltd. 2004 05 Page created by W. G. Huang

Here is a timeline of the disaster: 12: 59 am GMT A massive 9. 0 earthquake occurs in the Indian Ocean off Sumatra, Indonesia. Huge buildings in the Thai capital of Bangkok shake under the force of the earthquake. Bangkok is nearly 2, 000 km from where the earthquake took place. 01: 07 am GMT After the quake, stations in Australia alert the NOAA Pacific Tsunami Warning Center of the earthquake and the potential tsunami threat. 02: 27 am GMT The massive waves hit Kalmunai, Sri Lanka. 02: 30 am GMT Kattankudy is hit. By now, almost the entire east coast of Sri Lanka is under 2. 7 meters of water. 02: 40 am GMT Batticaloa, Mullaitivu and Trincomalee, Sri Lanka, are hit. Yala, Thailand, is also struck by the tsunami. Though it has not yet been reported, more than 15, 000 people have died. 02: 57. am GMT News wire services release the first report: "Earthquake sets off big waves. " Reports of heavy damage and fatalities began to come in from Thailand's Phukit resort area. 03: 00 am GMT An AFP news correspondent in Colombo, Sri Lanka, gets a phone call from reporters in Trinco: "The sea is coming in. " In the same moment, Valvettiturai and Hambantota are hit. Almost 7, 000 people are washed out to sea. 03: 15 am GMT A Washington Post correspondent reports a tsunami hitting Weligama, Sri Lanka. The Sri Lankan provinces of Matara, Galle and Panadura are also hit. Another 5, 000 people die. 03: 20 am GMT Loaded with European tourists, the Sri Lankan resort Rae of Kalutara is hit. Satellite imagery reveals the water reaching 460 meters in from the shore line. 03: 30 am GMT The AFP news correspondent in Colombo gets a call from Matara indicating that a second round of waves is coming. Waves hit the Indian coast. PTWC begins getting wire reports from the Internet about Sri Lankan casualties. Negombo, Sri Lanka, is hit. 03: 46 am GMT AFP news reports massive casualties and numbers of homeless in Sri Lanka. 04: 11 am GMT Rapidly rising water levels in India damage the coastline. Some small tremors are felt. 05: 00 am GMT PTWC advises the U. S. Pacific Command in Hawaii of the potential threat of more tsunamis in the western Indian Ocean. 05: 41 am GMT The Prime Minister of Thailand orders the evacuation of three major provinces, including Phukit. 06: 09 am GMT In a few hours, the tsunami has all but crossed the ocean, flooding Male, the capitol of Maldives. 07: 15 am GMT The PTWC advises the U. S. State Department on the continuing threat of tsunamis in Madagascar and Africa. In the next few hours, organized relief efforts begin. Page created by W. G. Huang
 Pantong Beach (Video) Kanyakumari (Video) (Video) Kenya (Video) Aceh Map Credit:")
2004年 12月26日南亞地震海嘯的影帶畫面 (Video) Pantong Beach (Video) Kanyakumari (Video) (Video) Kenya (Video) Aceh Map Credit: Guardian Unlimited Page created by W. G. Huang

A massive 9. 0 earthquake Sunday off the western coast of Sumatra sent tsunami waves across the Indian Ocean, killing nearly 300, 000 people. 截至 2005年 1月27日的死亡人數: 298, 055 孟加拉 2 阿拉伯海 孟加拉灣 緬甸 59 泰國 8, 506 印度 16, 389 斯里籣卡 43, 832 東非 137 馬爾地夫 82 馬來西亞 74 印尼 228, 948 Map Credit: Guardian Unlimited Page created by W. G. Huang

2004年 12月26日蘇門答臘地震海嘯之模擬動畫 Animation of Indonesia tsunami l Active Fault Research Center (by Kenji Satake in Tsukuba, Japan) The tsunami propagation is animated (up to 5 hours) from a 1200 km fault. The red color means that the water surface is higher than normal, while the blue means lower. It indicates that initial tsunami to the east (e. g. , Phuket) began with receding wave, while to the west (e. g. , Sri Lanka) large wave suddenly reached. The darker the color, the larger the amplitude. The tsunamis were larger in the east and west directions. l National Oceanic & Atmospheric Administration (NOAA) (download i. Tunes here) NOAA has run the tsunami model used to generate a world-wide picture. NOAA scientist Vasily Titov, using seismic data, rendered an animation showing how the tsunami waves propagated across the Earth. Titov used the numerical model called Method of Splitting Tsunami, or MOST. The animation covers a period of 44 hours and 27 minutes of tsunami propagation. l USGS (by Eric L. Geist) This is a local tsunami simulation using the slip distribution determine from the inversion of seismic waveforms l Institute of Geophysics and Planetary Physics at the Univ. of California (by Dr. Steven Ward) This animation shows the tsunami's progress across the Indian Ocean. It also shows some water level graphs and run-up heights throughout the region. Inundation Page created by W. G. Huang

l Bureau of Meteorology, National Tidal Centre, Australia The animation covers a period of 48 hours of tsunami propagation. The tsunami reached the Atlantic and Pacific coasts of the United States about the same time. l EMSC (by H. Hebert ; LDG, Bruyeres la Chatel, France) l Geo. Forschungs. Zentrum(GFZ)Potsdam by Andrey Babeyko (University of Frankfurt/Main, Geophysical Institute)and Stephan Sobolev (Geo. Forschungs. Zentrum Potsdam). Initial sea bottom displacement is calculated following Okada’s (1985) analytical solution for the surface deformation caused by deep planar fault of arbitrary size and orientation. Tsunami wave propagation is calculated in the so called shallow-water approximation. The model accuracy degrades in the near shore regions. Model zoom in Maldives (3 D view animation) Model zoom in Thailand (3 D view animation) l Joint Research Centre, European Commission JRC Tsunami Propagation Model The model allows to predict the propagation wave once the initial location of the earthquake is fixed. The model, in contrast to other detailed 3 d models, is extremely fast but sufficiently precise that can be integrated in the Global Disaster Alert System to give a first estimate should the conditions favour a Tsunami (magnitude > 7 and epicenter in a location under water). Page created by W. G. Huang
 for the entire Indian Ocean 主震 餘震 the")
2004/12/26蘇門答臘地震海嘯在整個印度洋的走時曲線 Tsunami Travel Time (in hours) for the entire Indian Ocean 主震 餘震 the red circles indicate aftershocks occurred within 24 hours 左圖顯示海嘯在地震發 生兩個小時後抵達普吉 島與斯里蘭卡海岸,在 8到 11小 時 後 則 到 達 非 洲東部海岸。 http: //staff. aist. go. jp/kenji. satake/Sumatra. jpg Page created by W. G. Huang
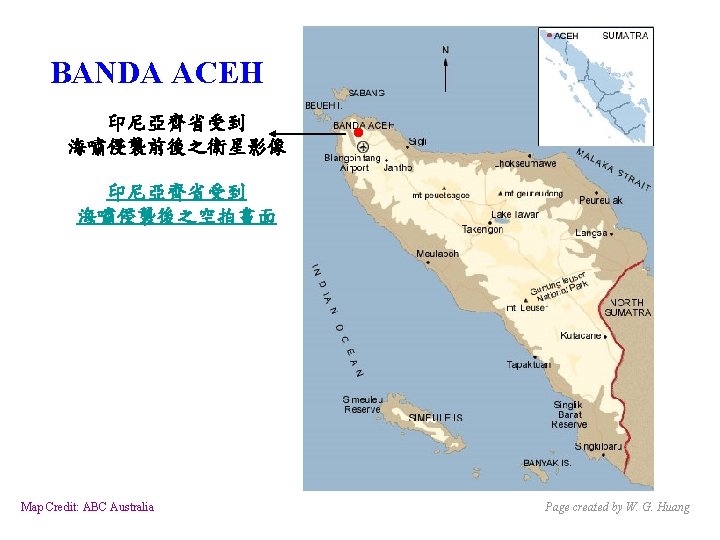
 Image Credit: “Digital. Globe” 海嘯後(攝於 2005年 1月7日) Page created")
Meluaboh Overview 海嘯前(攝於 2004年 5月18日) Image Credit: “Digital. Globe” 海嘯後(攝於 2005年 1月7日) Page created by W. G. Huang
與海嘯後(攝於 2004年 12月28日)之衛星影像 Image Credit: “Digital. Globe” Page created")
Banda Aceh Shore 海嘯前(攝於 2004年 6月23日)與海嘯後(攝於 2004年 12月28日)之衛星影像 Image Credit: “Digital. Globe” Page created by W. G. Huang
與海嘯後(攝於 2004年 12月28日)之衛星影像 Image Credit: “Digital. Globe” Page created")
Banda Aceh Shore 海嘯前(攝於 2004年 6月23日)與海嘯後(攝於 2004年 12月28日)之衛星影像 Image Credit: “Digital. Globe” Page created by W. G. Huang
與海嘯後(攝於 2004年 12月28日)之衛星影像 Image Credit: “Digital. Globe” Page created")
Banda Aceh Shore 海嘯前(攝於 2004年 6月23日)與海嘯後(攝於 2004年 12月28日)之衛星影像 Image Credit: “Digital. Globe” Page created by W. G. Huang
與海嘯後(攝於 2004年 12月28日)之衛星影像 Image Credit: “Digital. Globe” Page")
Banda Aceh City Detail 海嘯前(攝於 2004年 6月23日)與海嘯後(攝於 2004年 12月28日)之衛星影像 Image Credit: “Digital. Globe” Page created by W. G. Huang

Aceh, Sumatra, Indonesia 海嘯前 與海嘯後 之衛星影像 Image Credit: “Digital. Globe” Page created by W. G. Huang

Banda Aceh Detail This image was taken by Space Imaging's IKONOS satellite on Jan. 10, 2003. The image shows a portion of the northern shore of Aceh Province, Sumatra, Indonesia. Images acquired and processed by CRISP, Singapore. This image was taken by Space Imaging's IKONOS satellite on Dec. 29, 2004. The image shows an overview of the widespread damage to structures, landmass, crops, and general infrastructure. Damage from major flooding and standing water is visible. Page created by W. G. Huang

Aceh, Sumatra, Indonesia This image was taken by Space Imaging's IKONOS satellite on Jan. 10, 2003. The image shows the western coast of Sumatra, Indonesia and Lhoknga, a village near the capital city of Banda Aceh, in the Aceh province. A white colored mosque is in the center of the town. Images acquired and processed by CRISP, Singapore. This image was taken by Space Imaging's IKONOS satellite on Dec. 29, 2004. The town of Lhoknga, on the west coast of Sumatra near the capital of Banda Aceh, was completely destroyed by the tsunami, with the exception of the white mosque in the city’s center. Page created by W. G. Huang

斯里蘭卡 SRI LANKA Trincomalee Harbour area 首都 可倫波 Kalutara 海嘯侵襲前後 之衛星影像 Map Credit: University of Texas Libraries Page created by W. G. Huang
與海嘯來襲 (攝於 2004年 12月26日)之衛星影像 Image Credit: “Digital. Globe” Page")
Kalutara Water Detail 海嘯前(攝於 2004年 1月1日)與海嘯來襲 (攝於 2004年 12月26日)之衛星影像 Image Credit: “Digital. Globe” Page created by W. G. Huang
與海嘯入侵前之退潮 (攝於 2004年 12月26日)之衛星影像 150 公尺 Image Credit: “Digital.")
Kalutara Water Detail 海嘯前(攝於 2004年 1月1日)與海嘯入侵前之退潮 (攝於 2004年 12月26日)之衛星影像 150 公尺 Image Credit: “Digital. Globe” Page created by W. G. Huang

THAILAND 泰國 曼谷 海嘯侵襲前後 之衛星影像 Similan Islands 普吉島 Map Credit: University of Texas Libraries Page created by W. G. Huang

The Blue Village Pakarang Resort is surrounded by a white scenic beach, natural forests and waterfalls. Only 1 hour by car from Phuket International Airport, and situated on the well-preserved Pakarang Cape, it's on one of a very few unspoiled beaches along Andaman sea in Thailand. Khaolak, Thailand : located in Phang-Nga, a southern province on Thailand's Andaman seaboard. 海嘯前 Image Credit: “Digital. Globe” 海嘯後 Page created by W. G. Huang

Sofitel Magic Lagoon Resort & Spa Khao Lak is the most luxurious choice for a tropical holiday in Khao Lak. Khaolak, Thailand 海嘯前 Image Credit: “Digital. Globe” 海嘯後 Page created by W. G. Huang
 2. BBC special news 3.")
2004蘇門達臘烈震相關新聞報導 1. CH 9 News (Earthquake Hits Banda Aceh) 2. BBC special news 3. CH 10 News (Tsunami Hits Pantong Beach and Banda Ache) 4. Tsunami Hits Patong Beach

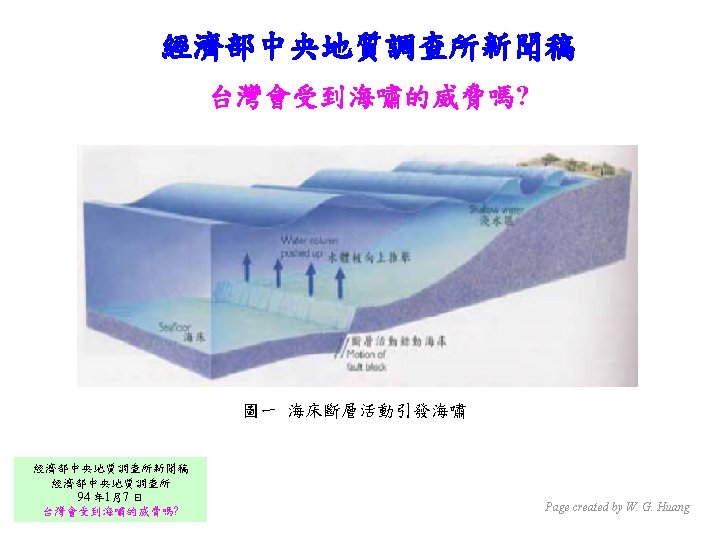
Earthquake-generated tsunamis u Seafloor deformed by earthquake u Wave initiated with small amplitude and high speed in deep water u Speed decreases and amplitude increases in shallow water Tsunami Generation: This animation by Prof. Miho Aoki from the University of Alaska Fairbanks Art Department provides a very nice look at how a tsunami can be generated by a subduction zone earthquake. Page created by W. G. Huang

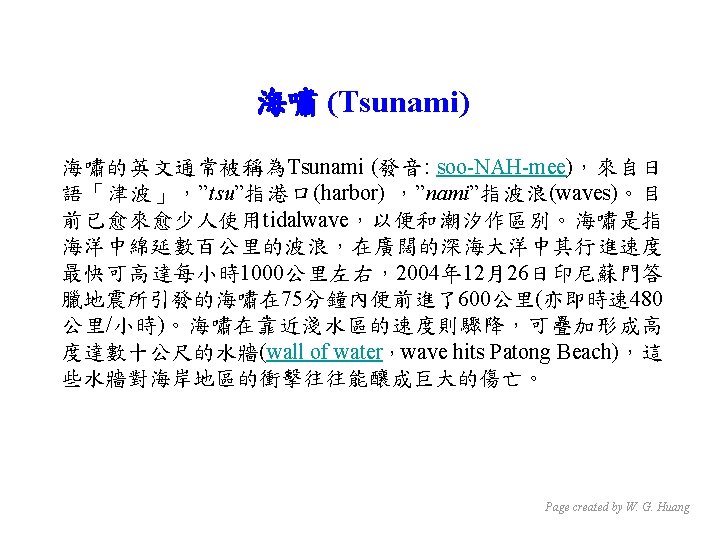
海嘯和一般的風所引起海浪兩者有許多的不同,主 要的差異在於它們的來源,速度與尺度的大小 Tsunamis and normal waves are many differences between the two. The primary differences are size, speed and source. 典型的海嘯與典型的風浪之區別 Typical Tsunami Wave versus Typical Wind-generated Wave 波速 (Wave Speed) 波的週期 (Wave Period) 波長 (Wave Length) 風所引其起的波浪 海嘯 Wind-generated Wave Tsunami Wave 8 – 100 公里/小時 (kph) 500 – 1, 000公里/小時 (kph) 5 – 20 秒 (seconds) 10 分鐘 (minutes) – 2小時(hours) 100 – 200 公尺 (meters) 100 – 500公里 (km) Page created by W. G. Huang

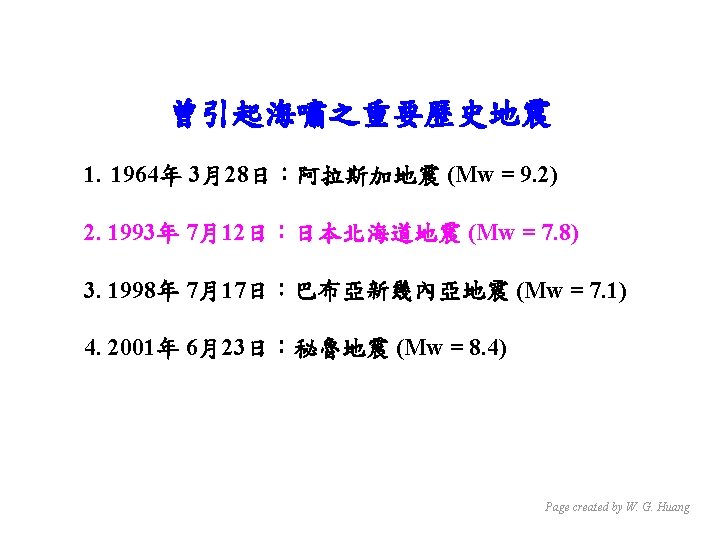
Major recorded tsunamis Dec. 26, 2004: A 9. 0 magnitude earthquake centred off the Indonesian island of Sumatra triggers tsunamis that pound the shorelines of nine countries, killing more than 226, 000 people. July 17, 1998: A tsunami triggered by a 7. 1 magnitude earthquake offshore triggers a tsunami that hits Papua, New Guinea. Waves as high as 12 metres kill about 3, 000 people and destroy whole villages. June 3, 1994: Earthquakes cause a series of waves more than 60 metres high that slam into Eastern Java and Indonesia, killing 200 people. July 12, 1993: An underwater earthquake off the coast of Hokkaido in Japan generates five metre high waves that leave 202 dead. Aug. 17, 1976: Tsunamis generated by an earthquake near Mindanao, Philippines, kill 8, 000. March 27, 1964: The largest earthquake of the 20 th century in the northern hemisphere, with a magnitude of 8. 4. , strikes off Alaska's shore. It spurs tsunami waves as high as six metres, which kill more than 120 people. March 3, 1933: An earthquake generated tsunami strikes Sanriku, Japan. It kills nearly 3, 000 people, destroys 9, 000 houses and sinks about 3, 000 ships. Nov. 18, 1929: A magnitude 7. 2 earthquake occurs on the Grand Banks and is felt as far away as Ottawa. The resulting tsunami kills 28 people on Newfoundland's Burin Peninsula. June 15, 1896: A tsunami with waves up to 30 metres high pounds the east coast of Japan around Yoshihimama, leaving about 27, 000 dead. Aug. 27, 1883: A volcanic eruption near Krakatoa, Indonesia, triggers tsunamis that kill about 36, 000. Page created by W. G. Huang
 Lituya Bay, Alaska, on July 9, 1958 (landslide generated tsunami) On")
歷史上最大的海嘯 (Mega Tsunami) Lituya Bay, Alaska, on July 9, 1958 (landslide generated tsunami) On the night of July 9, 1958, a magnitude 8. 0 earthquake occurred along the Fairweather Fault with an near Lituya Bay (利圖尤灣). The earthquake caused a large landslide in the bay, which produced a local tsunami of frightening size. The wave washed out trees to a maximum altitude of 518 meters by the time it hit the opposite slope. The volume of the rockfall was approximately 30 million of cubic meters. Map Credit: University of Texas Libraries Page created by W. G. Huang
 The most devastating recorded")
歷史上殺傷力最大的海嘯 East Indies on Aug. 27, 1883 (landslide generated tsunami) The most devastating recorded tsunami demolished parts of the East Indies on Aug. 26, 1883, after the volcano Krakatau exploded. More than 36, 000 people died because of the waves, which reached heights of 30 meters and speeds of 724 km/h. Tsunami waves were recorded or observed throughout the Indian Ocean, the Pacific Ocean, the American West Coast, South America, and even as far away as the English Channel. 克拉卡托火山 Total energy: 200 megatons of TNT. Hiroshima atomic bomb was only about 20 kilotons The amount of ejected material about 21 km 3. Child of Krakatoa When Krakatoa erupted in 1883, the entire northern portion of the island was blown away. On January 25, 1925, a new small island was named Anak Krakatau or Child of Krakatoa that was born. Page created by W. G. Huang
地震 (Mw = 7. 8) 北海道 Location map of the July 12, 1993")
1993年 7月12日日本北海道(Hokkaido)地震 (Mw = 7. 8) 北海道 Location map of the July 12, 1993 Okushiri earthquake and tsunami. The white box outlines the source area of this event. Yellow and red circles outline the felt and damaged areas of this earthquake, respectively. The earthquake produced one of the largest tsunamis in Japan‘s history. At 2217 local time (1317 UTC), the quake rocked the west coast of Hokkaido and the small, offshore island of Okushiri in the Sea of Japan, generating a major tsunami. The killer waves strike with little warning. Within 2 5 minutes, extremely large waves engulfed the Okushiri coastline and the central west coast of Hokkaido, killing 202 people who were trying to flee for higher ground. Extensive damage occurred on the southern tip of Okushiri Island at the town of Aonae. Page created by W. G. Huang

Aonae Cape, Okushiri Island The animation you will see here shows Aonae Cape, a small peninsula that points south off of Okushiri. The peninsula was completely overtopped by the giant wave, to heights of over 10 m. (the largest recorded wave runup on the island was nearly 30 m) In the image above, the wave approached from the left and swept over the land. Structures remaining after the wave attack were destroyed by the fires that engulfed the area due to broken gas lines and toppled fuel containers. http: //cwis. usc. edu/dept/tsunamis/2005/video_okushiri. html Credit : globalsecurity Page created by W. G. Huang

1993 Hokkaido-Nansei-Oki Tsunami Vasily V. Titov PMEL, NOAA, Seattle, Washington Costas Emmanuel Synolakis University of Southern California, Los Angeles The tsunami generated by the July 12, 1993 Hokkaido-Nansei-Oki Mw = 7. 8 earthquake produced in Japan the worst local tsunami related death toll in fifty years [Hokkaido Tsunami Survey Group, 1993; Shuto and Matsutomi, 1995], with estimated 10 18 m/sec overland flow velocities and 30 m high wave runup. These extreme values are the largest recorded in Japan this century [Hokkaido Tsunami Survey Group, 1993; Shuto and Matsutomi, 1995] and are among the highest ever documented for non landslide generated tsunamis. We model this event to confirm the estimated overland flow velocities, and we find that current state of the art shallow water wave models can predict tsunami inundation correctly including extreme runup, current velocities and overland flow. Our results qualitatively suggest that for this event coastal inundation is more correlated with inundation velocities than with inundation heights, thereby providing one explanation why threshold type modeling has substantially underpredicted coastal inundation in this and other recent events. Animation (MOST Model Method of Splitting Tsunami): 動畫 1 動畫 2 Credit : U. S. National Oceanic & Atmospheric Administration (NOAA) and U. S. National Tsunami Hazard Mitigation Program Page created by W. G. Huang

海嘯預警系統 Alaska Tsunami Warning Center ATWC Alaska DART station Hawaii Pacific Tsunami Warning Center PTWC 黃色表地震帶 Photo courtesy DART Map Credit : U. S. National Oceanic & Atmospheric Administration (NOAA) and U. S. National Tsunami Hazard Mitigation Program The PTWC was established in 1948, following the 1946 tsunami in Hawaii that left more than 150 people dead. The ATWC was established in 1967 as a result of the 1964 9. 2 earthquake in Alaska that left 132 dead— 122 of those deaths have been attributed to the tsunami that was generated. Page created by W. G. Huang

Tsunami Memorial Video A very touching tsunami memorial video made by Chris Valentine featuring most of the videos available on this site. A must see video, please share it with as many people as possible to create awareness about this disaster. Page created by W. G. Huang
- Slides: 66