GHG Emission From Thailand Building sector 6 1


GHG Emission From Thailand Building sector 6

1 Sector Overview บญชกาซเรอนกระจกของประเทศไทย รายงานการปลอยกาซเรอนกระจกของประเทศไทยในป 2000 เทากบ 229 ลานตน และจากภาคพลงงาน รอยละ 653% 4% Energy Industrial process 21% Agricultural and livestock 7% 65% Forestry Waste management Greenhouse gas emission in CO 2 equivalent by sources in 2000 7

1 Sector Overview Commercial 7% Residential 15% Agriculture 5% Mining & Construction 1% Manufact-uring 36% Transportation 36% Note: for commercial buildings include only large building Share of Final Energy by sector 2013 8

2 Energy Use in Residential and Commercial Sectors 2. 2 Residential Sector 4, 000 3, 500 3, 000 2, 500 CO 2 Emission (k. Ton, C) 2, 000 Year 2010 1, 500 Projection (BAU Case) 1, 000 Projection (EE case) 500 er th O Li gh tin g Co ok En in te g rta in m en t A m en ity 0 Greenhouse gas emission from residential sector 9
 7%")
Energy Use in Residential and 2 2. 3 Commercial Sectors 2010 2030 (BAU) 7% 12% 15% 5% 2030(EE) 14% 23% 4% 19% 36% 6% 7% 7% 17% 6% 14% 6% 4% 4% 12% 4% 20% 6% 26% 6810 28% CO 2 Emission (k. Ton, C) 7000 6000 3, 348 2, 802 5000 4000 3000 2000 1000 0 Year 2010 Projection (BAU Case) Projection (EE Case) Electricity and fuel consumptions and GHG emission from commercial building 10

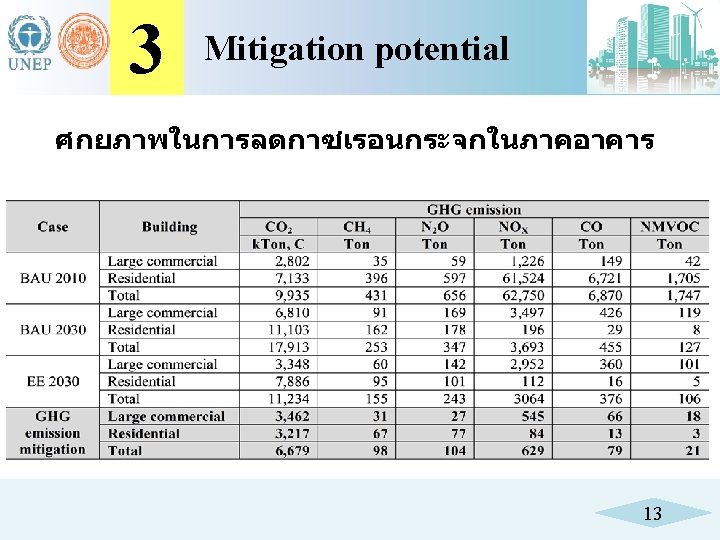
3 Mitigation potential สมรรถนะของอาคารในกรณปกต และกรณมมาตรการอนรกษพลงงาน Building BAU Scenario COP Energy Efficiency Scenario OTTV LPD EPD Office 61. 4 22. 7 45. 0 219. 2 20 6 25 81. 7 Hotel 33. 0 16. 2 35. 0 271. 2 10 5 30 116. 4 Hospital 35. 5 13. 7 12. 0 244. 1 10 5 10 114. 6 Department Store 43. 6 19. 6 26. 2 308. 3 15 8 20 146. 4 School 61. 1 14. 6 25. 0 102. 2 20 6 20 Condominium 33. 0 16. 2 40. 0 256. 3 10 5 30 132. 3 Hyper Market 43. 6 19. 6 45. 0 370. 0 15 8 25 160. 6 Other 57. 4 19. 6 20. 0 182. 1 15 8 15 66. 2 2. 21 Energy OTTV COP 4. 42 Energy 58. 0
 Buildings MEA Office Hotel Hospital")
3 Mitigation potential การใชพลงงานของภาคอาคารในกรณปกต และกรณทมการอนรกษพลงงาน BAU scenario Electricity (GWh) Buildings MEA Office Hotel Hospital Department store School Condominium Hyper market Other All buildings Fuel used Total PEA 8, 020 3, 191 660 2, 605 1, 392 538 804 12, 142 1, 021 1, 142 995 7, 471 4, 942 2, 425 860 1, 497 18, 693 31, 011 LPG Fuel oil Total 11, 211 3, 265 1, 931 12, 947 2, 163 8, 466 7, 366 2, 356 49, 704 831 118 CO 2 emission k. Ton, C 1, 369 399 236 1, 580 264 1, 033 899 288 6, 068 656 87 6, 810 Energy efficiency scenario Electricity (GWh) CO 2 emission MEA PEA Total k. Ton, C 2, 989 1, 189 4, 178 510 283 1, 118 1, 401 171 654 253 907 111 382 5, 768 6, 150 751 580 648 1, 228 150 514 3, 858 4, 372 534 2, 145 1, 052 3, 197 390 313 545 857 105 7, 858 14, 430 22, 289 2, 721 702 554 LPG 99 73 Fuel oil 3, 348
- Slides: 13