
GGOF Investment Strategy Gavin Graham Location goes here
- Slides: 44
GGOF Investment Strategy Gavin Graham (Location goes here) 1
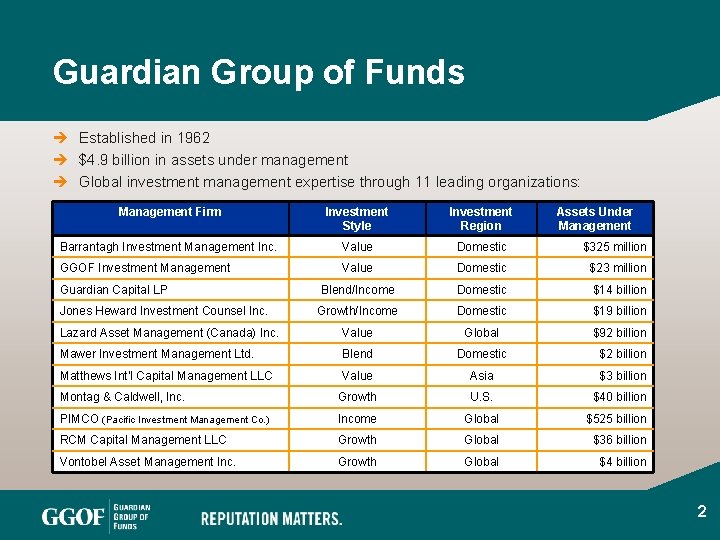
Guardian Group of Funds è Established in 1962 è $4. 9 billion in assets under management è Global investment management expertise through 11 leading organizations: Management Firm Investment Style Investment Region Barrantagh Investment Management Inc. Value Domestic $325 million GGOF Investment Management Value Domestic $23 million Blend/Income Domestic $14 billion Growth/Income Domestic $19 billion Lazard Asset Management (Canada) Inc. Value Global $92 billion Mawer Investment Management Ltd. Blend Domestic $2 billion Matthews Int’l Capital Management LLC Value Asia $3 billion Montag & Caldwell, Inc. Growth U. S. $40 billion PIMCO (Pacific Investment Management Co. ) Income Global $525 billion RCM Capital Management LLC Growth Global $36 billion Vontobel Asset Management Inc. Growth Global $4 billion Guardian Capital LP Jones Heward Investment Counsel Inc. Assets Under Management 2
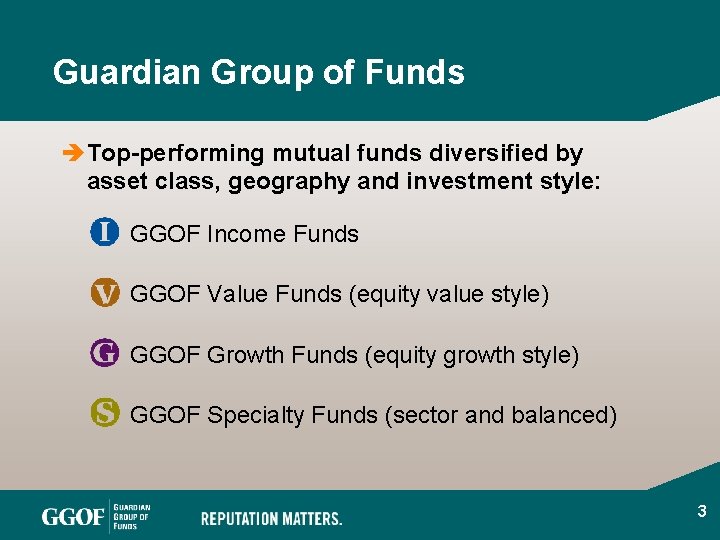
Guardian Group of Funds è Top-performing mutual funds diversified by asset class, geography and investment style: GGOF Income Funds GGOF Value Funds (equity value style) GGOF Growth Funds (equity growth style) GGOF Specialty Funds (sector and balanced) 3
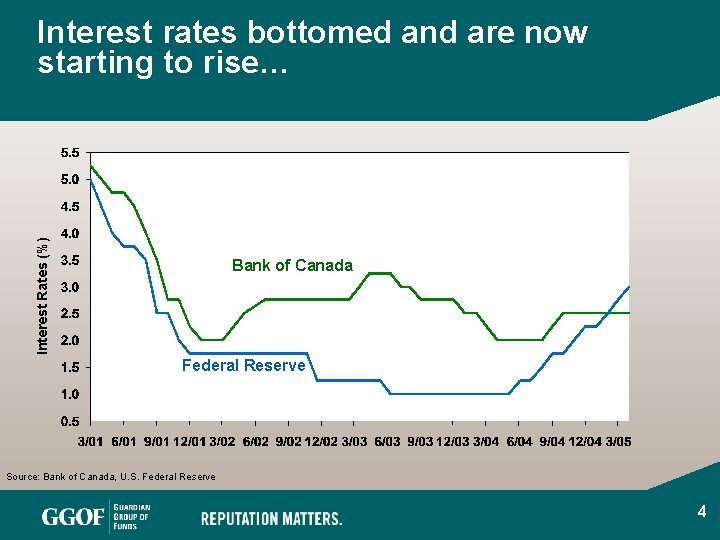
Interest Rates (%) Interest rates bottomed and are now starting to rise… Bank of Canada Federal Reserve Source: Bank of Canada, U. S. Federal Reserve 4
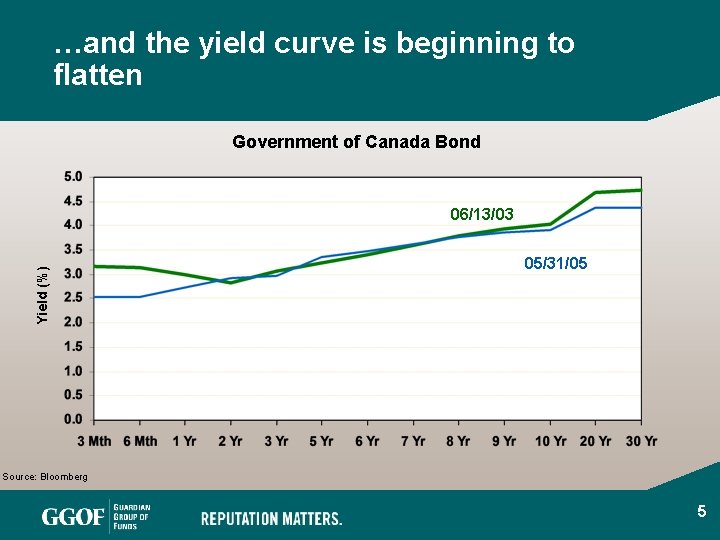
…and the yield curve is beginning to flatten Government of Canada Bond Yield (%) 06/13/03 05/31/05 Source: Bloomberg 5
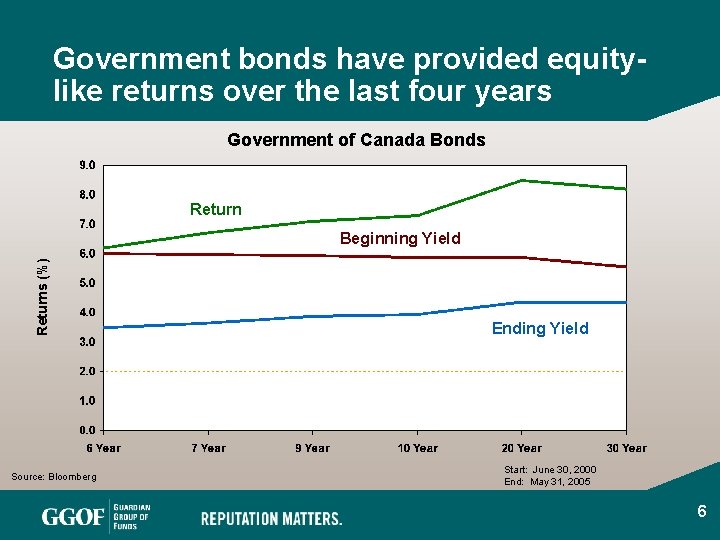
Government bonds have provided equitylike returns over the last four years Government of Canada Bonds Returns (%) Beginning Yield Source: Bloomberg Ending Yield Start: June 30, 2000 End: May 31, 2005 6
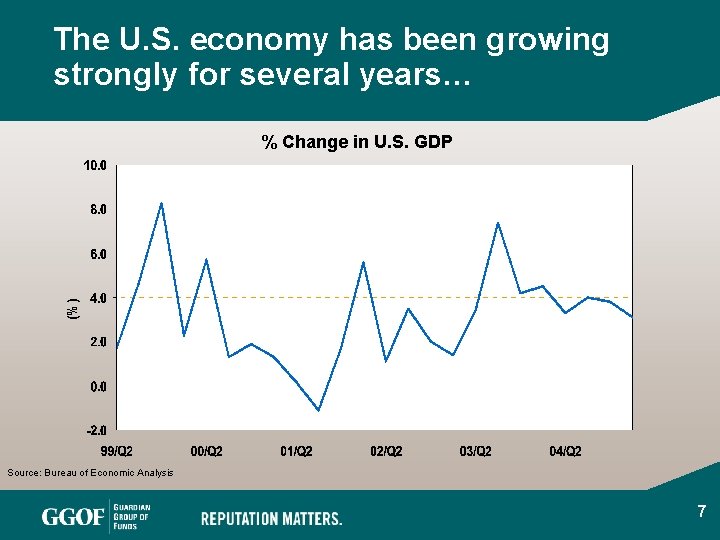
The U. S. economy has been growing strongly for several years… (%) % Change in U. S. GDP Source: Bureau of Economic Analysis 7
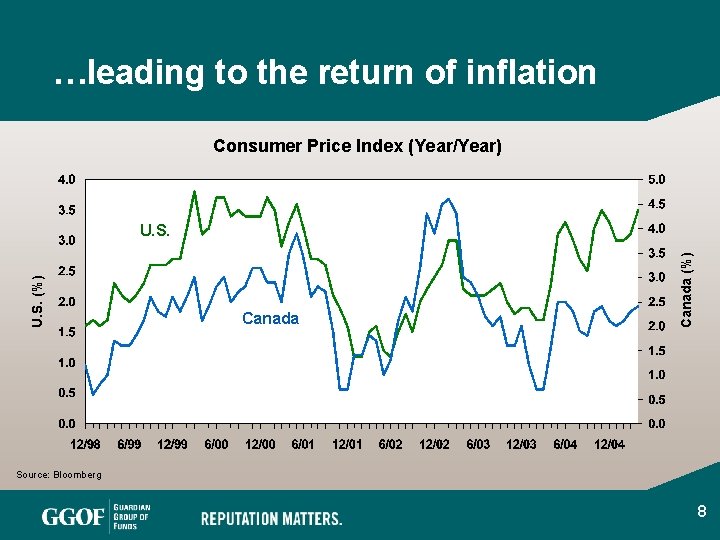
…leading to the return of inflation Consumer Price Index (Year/Year) Canada (%) U. S. Source: Bloomberg 8
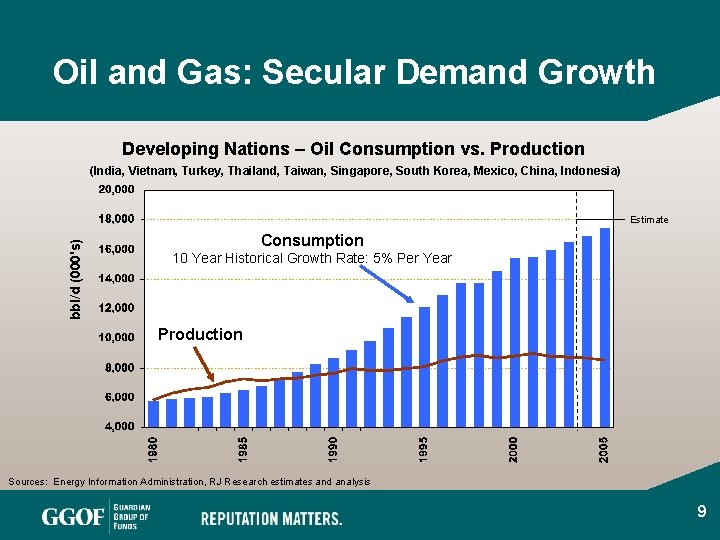
Oil and Gas: Secular Demand Growth Developing Nations – Oil Consumption vs. Production (India, Vietnam, Turkey, Thailand, Taiwan, Singapore, South Korea, Mexico, China, Indonesia) bbl/d (000's) Estimate Consumption 10 Year Historical Growth Rate: 5% Per Year Production Sources: Energy Information Administration, RJ Research estimates and analysis 9
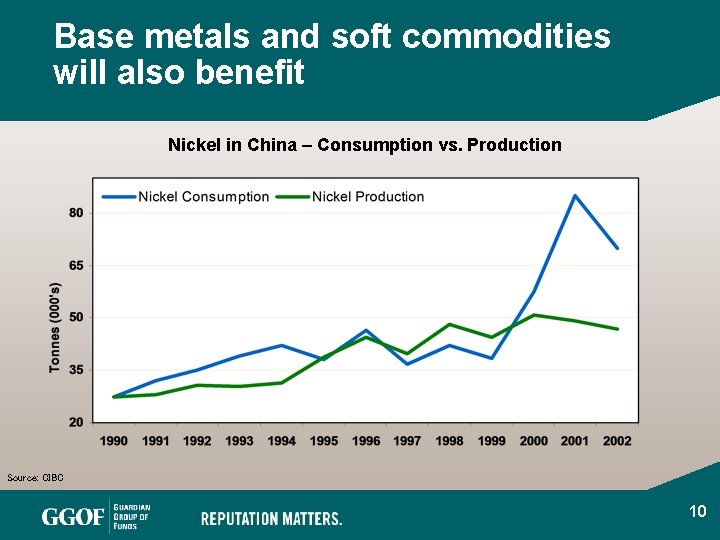
Base metals and soft commodities will also benefit Nickel in China – Consumption vs. Production Source: CIBC 10 10
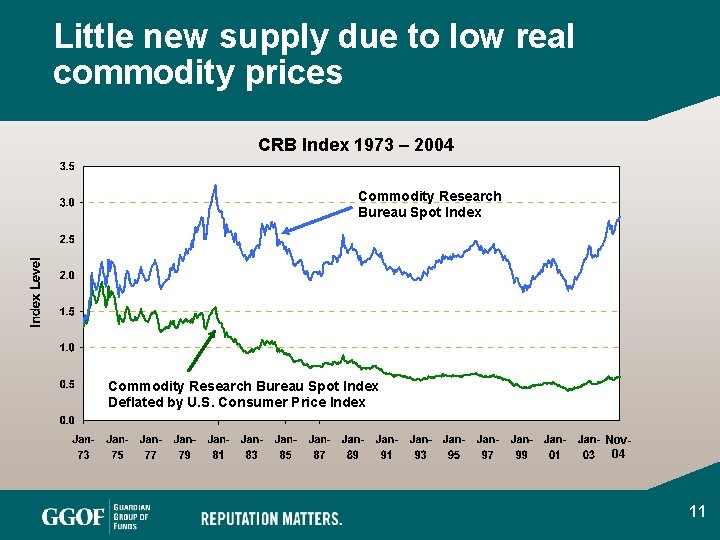
Little new supply due to low real commodity prices CRB Index 1973 – 2004 Commodity Research Bureau Spot Index Deflated by U. S. Consumer Price Index Nov 04 11 11
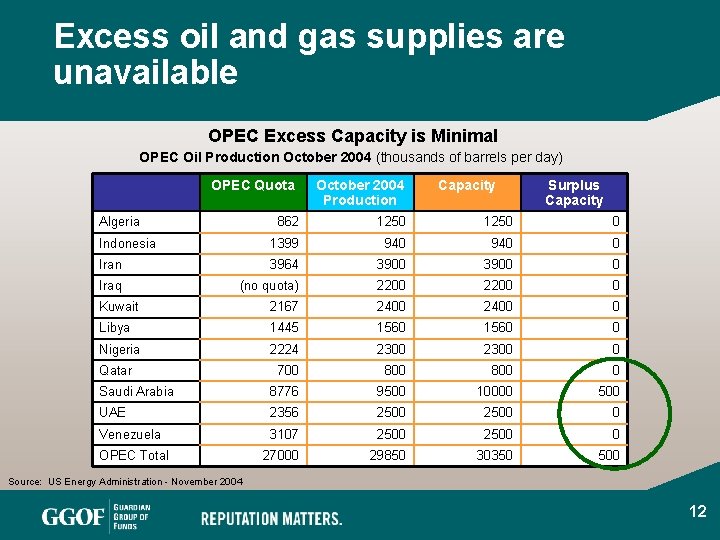
Excess oil and gas supplies are unavailable OPEC Excess Capacity is Minimal OPEC Oil Production October 2004 (thousands of barrels per day) OPEC Quota Algeria October 2004 Production Capacity Surplus Capacity 862 1250 0 Indonesia 1399 940 0 Iran 3964 3900 0 Iraq (no quota) 2200 0 Kuwait 2167 2400 0 Libya 1445 1560 0 Nigeria 2224 2300 0 700 800 0 Saudi Arabia 8776 9500 10000 500 UAE 2356 2500 0 Venezuela 3107 2500 0 27000 29850 30350 500 Qatar OPEC Total Source: US Energy Administration - November 2004 12 12
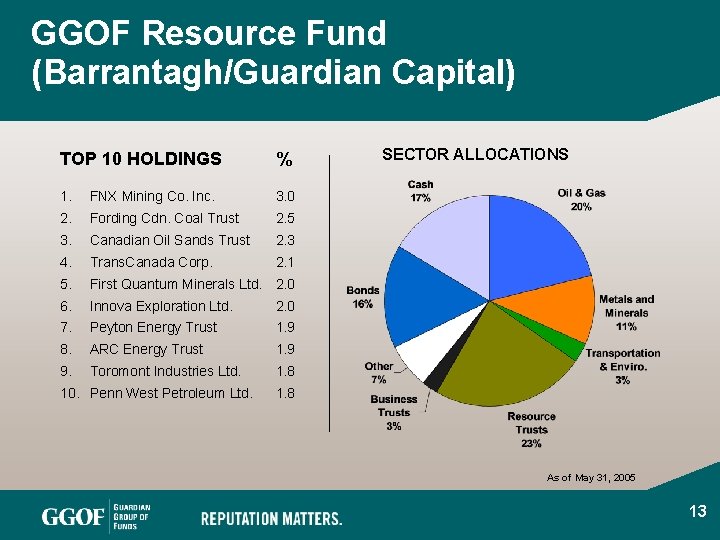
GGOF Resource Fund (Barrantagh/Guardian Capital) TOP 10 HOLDINGS % 1. FNX Mining Co. Inc. 3. 0 2. Fording Cdn. Coal Trust 2. 5 3. Canadian Oil Sands Trust 2. 3 4. Trans. Canada Corp. 2. 1 5. First Quantum Minerals Ltd. 2. 0 6. Innova Exploration Ltd. 2. 0 7. Peyton Energy Trust 1. 9 8. ARC Energy Trust 1. 9 9. Toromont Industries Ltd. 1. 8 10. Penn West Petroleum Ltd. SECTOR ALLOCATIONS 1. 8 As of May 31, 2005 13 13
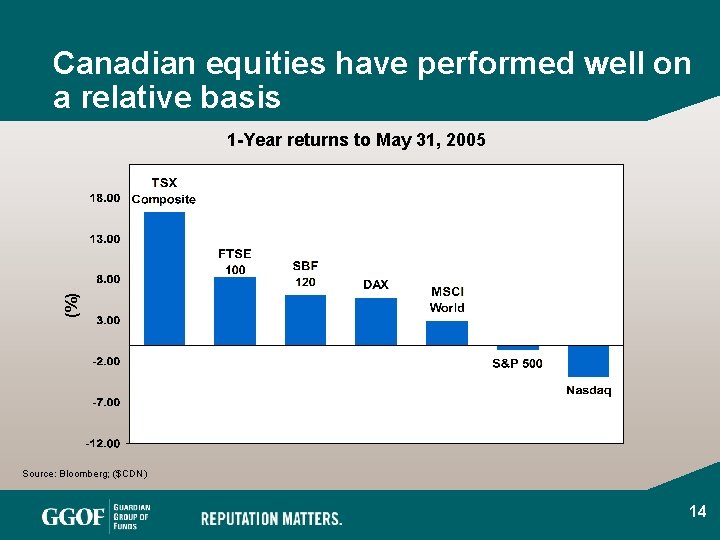
Canadian equities have performed well on a relative basis (%) 1 -Year returns to May 31, 2005 Source: Bloomberg; ($CDN) 14 14
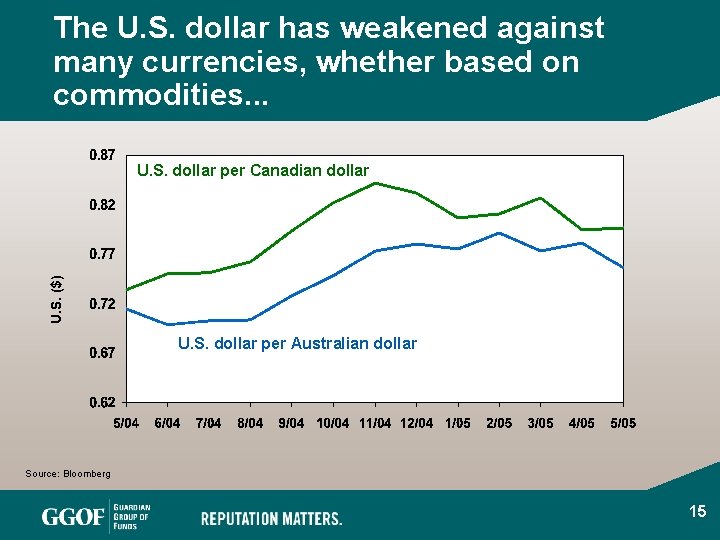
The U. S. dollar has weakened against many currencies, whether based on commodities. . . U. S. ($) U. S. dollar per Canadian dollar U. S. dollar per Australian dollar Source: Bloomberg 15 15
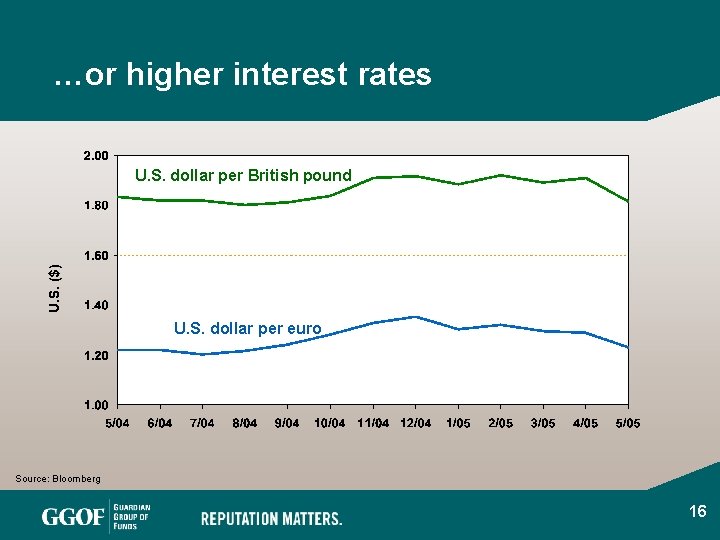
…or higher interest rates U. S. ($) U. S. dollar per British pound U. S. dollar per euro Source: Bloomberg 16 16
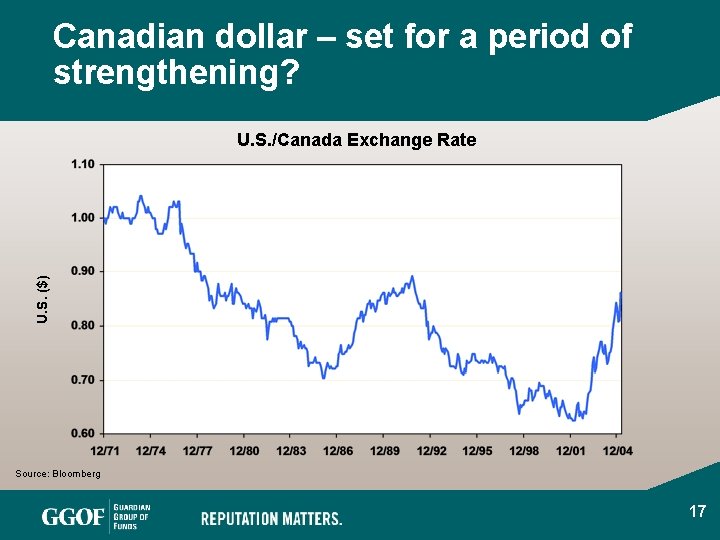
Canadian dollar – set for a period of strengthening? U. S. ($) U. S. /Canada Exchange Rate Source: Bloomberg 17 17
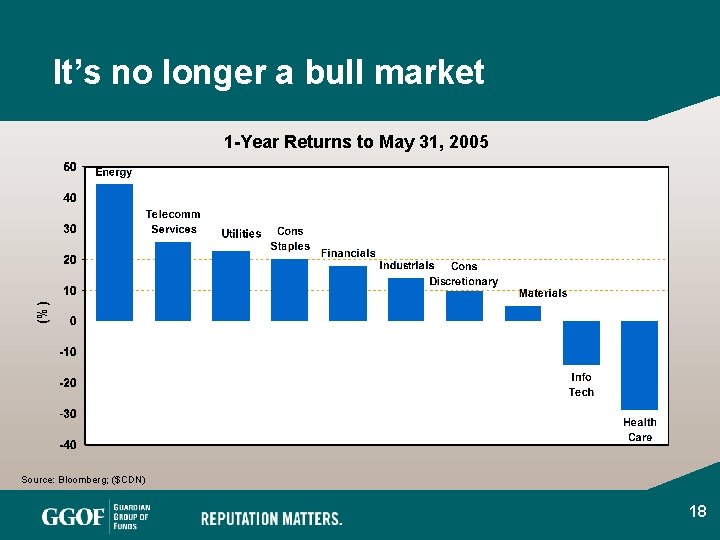
It’s no longer a bull market (%) 1 -Year Returns to May 31, 2005 Source: Bloomberg; ($CDN) 18 18
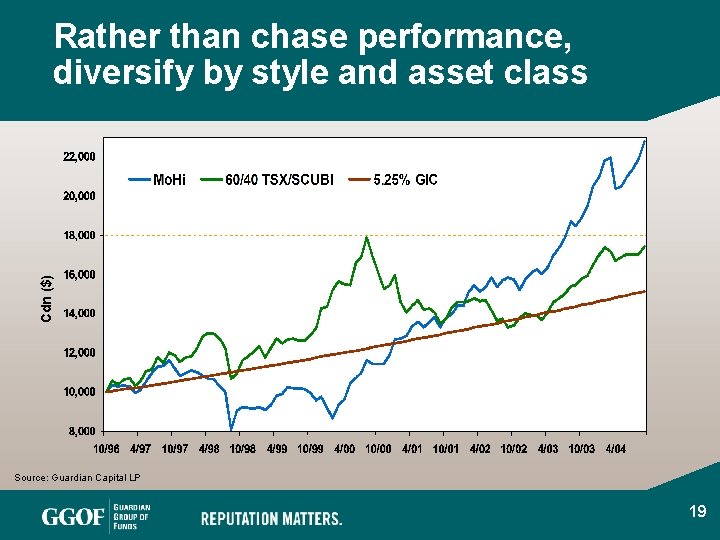
Cdn ($) Rather than chase performance, diversify by style and asset class Source: Guardian Capital LP 19 19
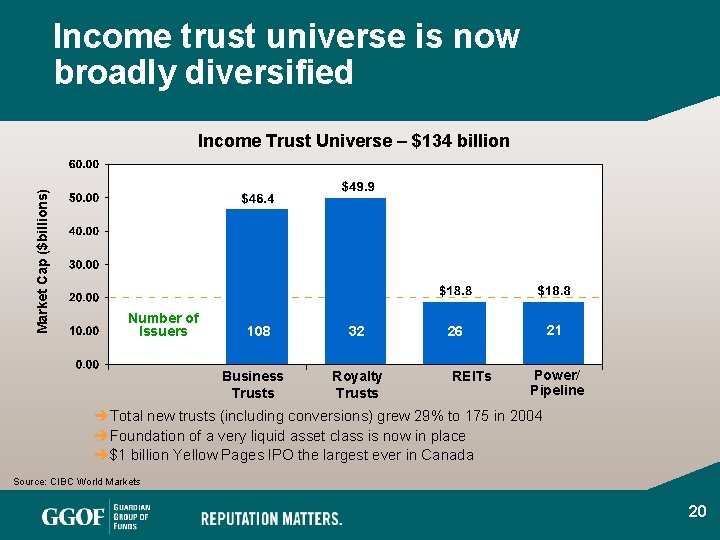
Income trust universe is now broadly diversified Market Cap ($billions) Income Trust Universe – $134 billion Number of Issuers 108 Business Trusts 32 Royalty Trusts 21 26 REITs Power/ Pipeline èTotal new trusts (including conversions) grew 29% to 175 in 2004 èFoundation of a very liquid asset class is now in place è$1 billion Yellow Pages IPO the largest ever in Canada Source: CIBC World Markets 20 20
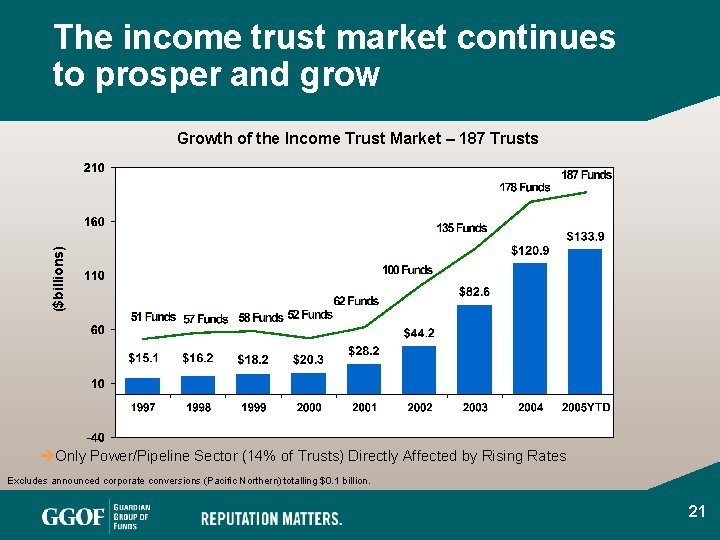
The income trust market continues to prosper and grow ($billions) Growth of the Income Trust Market – 187 Trusts èOnly Power/Pipeline Sector (14% of Trusts) Directly Affected by Rising Rates Excludes announced corporate conversions (Pacific Northern) totalling $0. 1 billion. 21 21
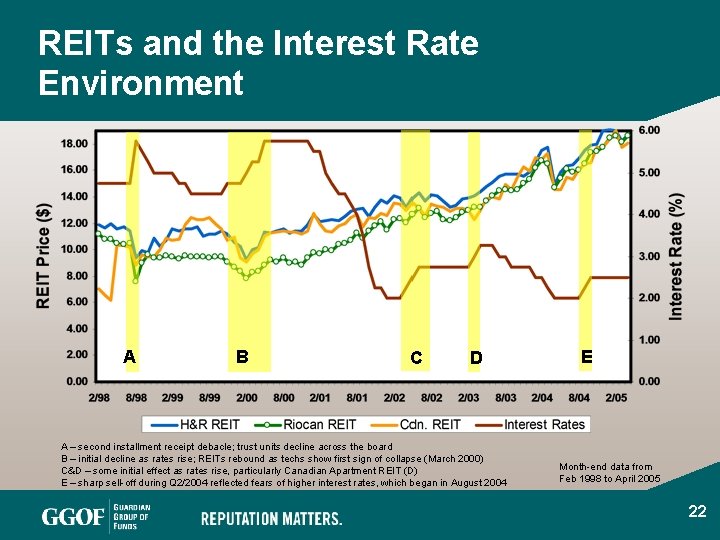
REITs and the Interest Rate Environment A B C D A – second installment receipt debacle; trust units decline across the board B – initial decline as rates rise; REITs rebound as techs show first sign of collapse (March 2000) C&D – some initial effect as rates rise, particularly Canadian Apartment REIT (D) E – sharp sell-off during Q 2/2004 reflected fears of higher interest rates, which began in August 2004 E Month-end data from Feb 1998 to April 2005 22 22
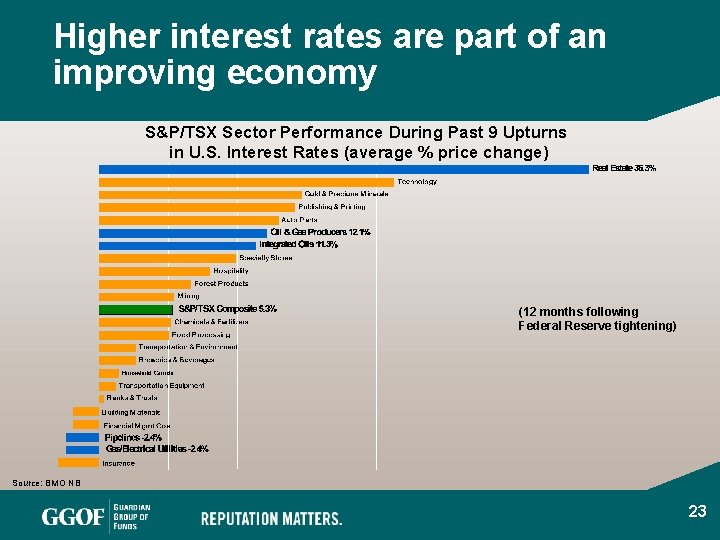
Higher interest rates are part of an improving economy S&P/TSX Sector Performance During Past 9 Upturns in U. S. Interest Rates (average % price change) (12 months following Federal Reserve tightening) Source: BMO NB 23 23
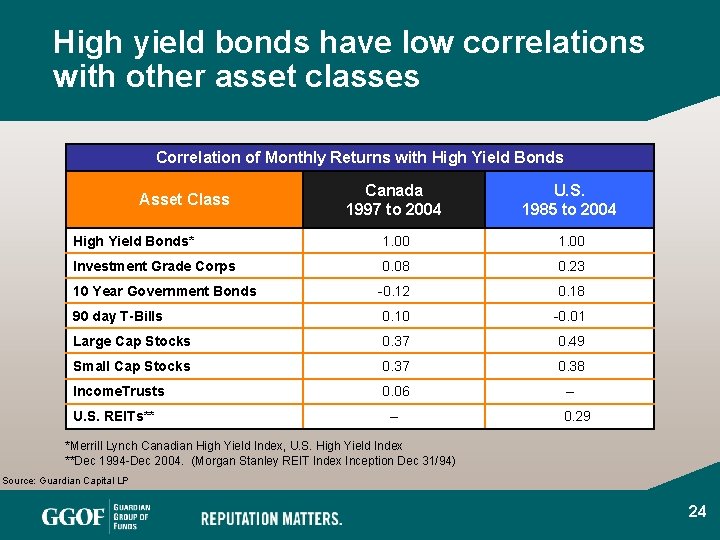
High yield bonds have low correlations with other asset classes Correlation of Monthly Returns with High Yield Bonds Canada 1997 to 2004 U. S. 1985 to 2004 High Yield Bonds* 1. 00 Investment Grade Corps 0. 08 0. 23 -0. 12 0. 18 90 day T-Bills 0. 10 -0. 01 Large Cap Stocks 0. 37 0. 49 Small Cap Stocks 0. 37 0. 38 Income. Trusts 0. 06 – Asset Class 10 Year Government Bonds U. S. REITs** – 0. 29 *Merrill Lynch Canadian High Yield Index, U. S. High Yield Index **Dec 1994 -Dec 2004. (Morgan Stanley REIT Index Inception Dec 31/94) Source: Guardian Capital LP 24 24
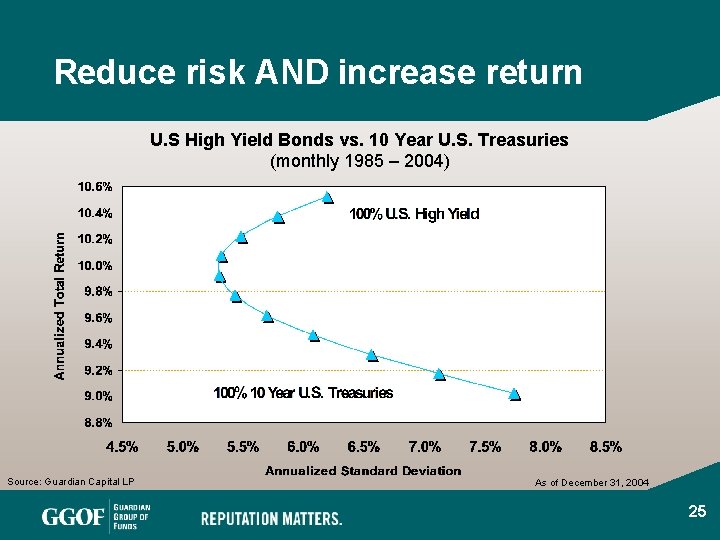
Reduce risk AND increase return U. S High Yield Bonds vs. 10 Year U. S. Treasuries (monthly 1985 – 2004) Source: Guardian Capital LP As of December 31, 2004 25 25
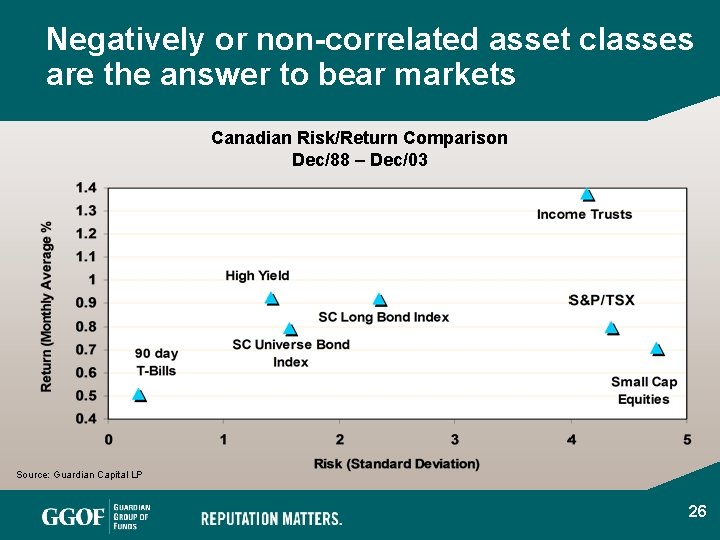
Negatively or non-correlated asset classes are the answer to bear markets Canadian Risk/Return Comparison Dec/88 – Dec/03 Source: Guardian Capital LP 26 26
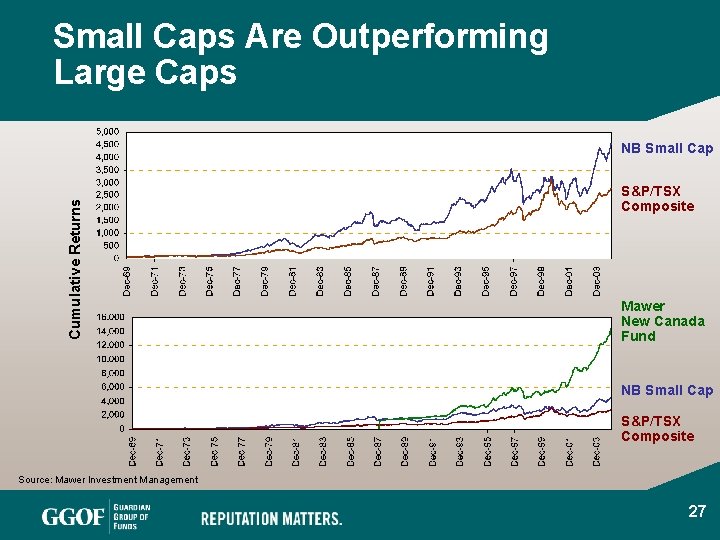
Small Caps Are Outperforming Large Caps Cumulative Returns NB Small Cap S&P/TSX Composite Mawer New Canada Fund NB Small Cap S&P/TSX Composite Source: Mawer Investment Management 27 27
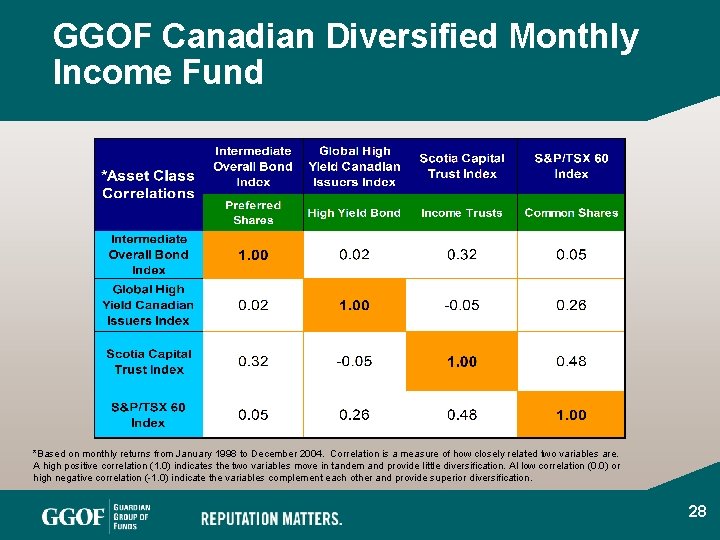
GGOF Canadian Diversified Monthly Income Fund *Based on monthly returns from January 1998 to December 2004. Correlation is a measure of how closely related two variables are. A high positive correlation (1. 0) indicates the two variables move in tandem and provide little diversification. Al low correlation (0. 0) or high negative correlation (-1. 0) indicate the variables complement each other and provide superior diversification. 28 28
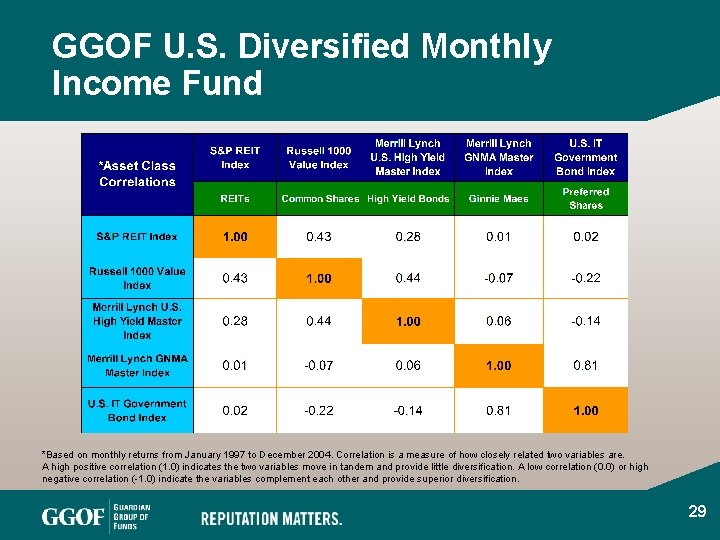
GGOF U. S. Diversified Monthly Income Fund *Based on monthly returns from January 1997 to December 2004. Correlation is a measure of how closely related two variables are. A high positive correlation (1. 0) indicates the two variables move in tandem and provide little diversification. A low correlation (0. 0) or high negative correlation (-1. 0) indicate the variables complement each other and provide superior diversification. 29 29
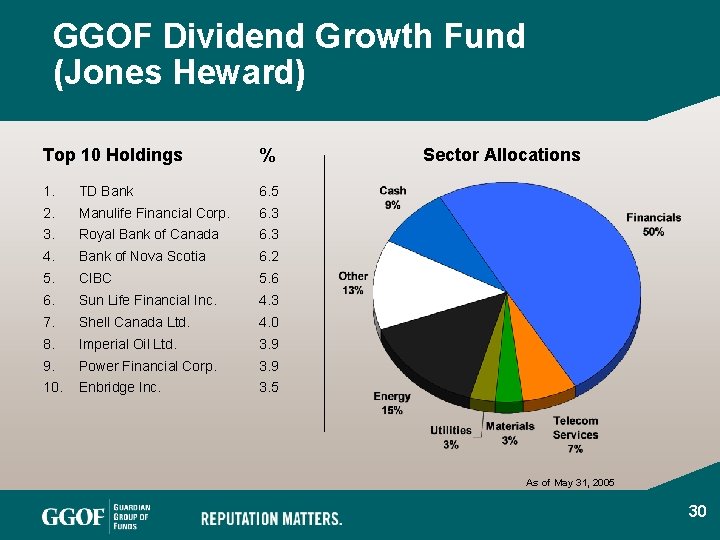
GGOF Dividend Growth Fund (Jones Heward) Top 10 Holdings % 1. TD Bank 6. 5 2. Manulife Financial Corp. 6. 3 3. Royal Bank of Canada 6. 3 4. Bank of Nova Scotia 6. 2 5. CIBC 5. 6 6. Sun Life Financial Inc. 4. 3 7. Shell Canada Ltd. 4. 0 8. Imperial Oil Ltd. 3. 9 9. Power Financial Corp. 3. 9 10. Enbridge Inc. 3. 5 Sector Allocations As of May 31, 2005 30 30
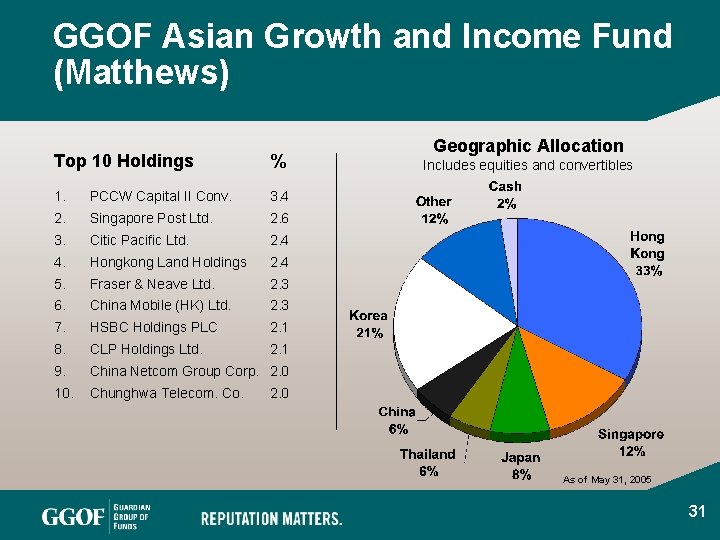
GGOF Asian Growth and Income Fund (Matthews) Top 10 Holdings % 1. PCCW Capital II Conv. 3. 4 2. Singapore Post Ltd. 2. 6 3. Citic Pacific Ltd. 2. 4 4. Hongkong Land Holdings 2. 4 5. Fraser & Neave Ltd. 2. 3 6. China Mobile (HK) Ltd. 2. 3 7. HSBC Holdings PLC 2. 1 8. CLP Holdings Ltd. 2. 1 9. China Netcom Group Corp. 2. 0 10. Chunghwa Telecom. Co. Geographic Allocation Includes equities and convertibles 2. 0 As of May 31, 2005 31 31
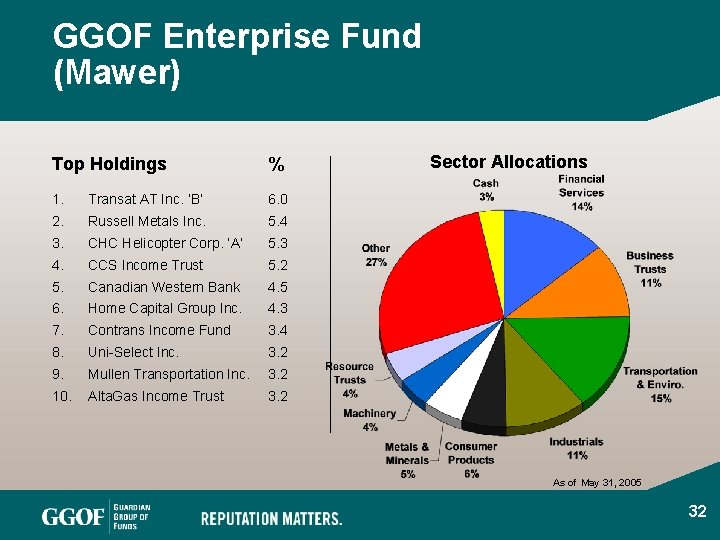
GGOF Enterprise Fund (Mawer) Top Holdings % 1. Transat AT Inc. ‘B’ 6. 0 2. Russell Metals Inc. 5. 4 3. CHC Helicopter Corp. ‘A’ 5. 3 4. CCS Income Trust 5. 2 5. Canadian Western Bank 4. 5 6. Home Capital Group Inc. 4. 3 7. Contrans Income Fund 3. 4 8. Uni-Select Inc. 3. 2 9. Mullen Transportation Inc. 3. 2 10. Alta. Gas Income Trust 3. 2 Sector Allocations As of May 31, 2005 32 32
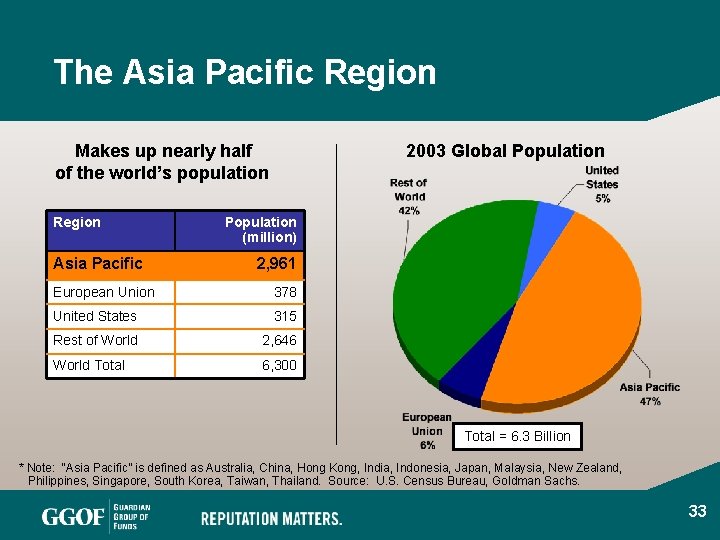
The Asia Pacific Region Makes up nearly half of the world’s population Region Asia Pacific 2003 Global Population (million) 2, 961 European Union 378 United States 315 Rest of World 2, 646 World Total 6, 300 Total = 6. 3 Billion * Note: “Asia Pacific” is defined as Australia, China, Hong Kong, India, Indonesia, Japan, Malaysia, New Zealand, Philippines, Singapore, South Korea, Taiwan, Thailand. Source: U. S. Census Bureau, Goldman Sachs. 33 33
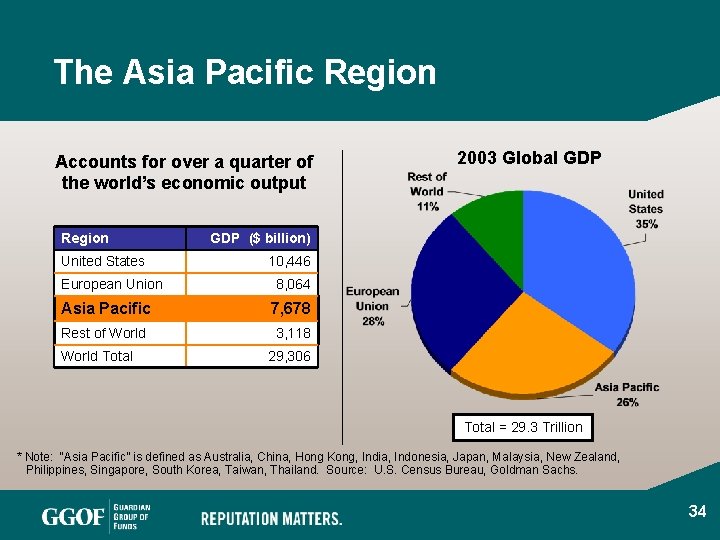
The Asia Pacific Region Accounts for over a quarter of the world’s economic output Region United States European Union GDP ($ billion) 10, 446 8, 064 Asia Pacific 7, 678 Rest of World 3, 118 World Total 2003 Global GDP 29, 306 Total = 29. 3 Trillion * Note: “Asia Pacific” is defined as Australia, China, Hong Kong, India, Indonesia, Japan, Malaysia, New Zealand, Philippines, Singapore, South Korea, Taiwan, Thailand. Source: U. S. Census Bureau, Goldman Sachs. 34 34
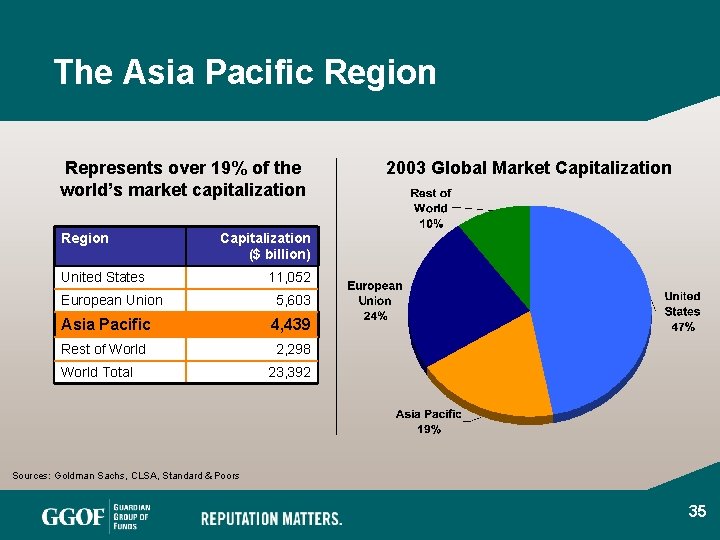
The Asia Pacific Region Represents over 19% of the world’s market capitalization Region 2003 Global Market Capitalization ($ billion) United States European Union 11, 052 5, 603 Asia Pacific 4, 439 Rest of World 2, 298 World Total 23, 392 Sources: Goldman Sachs, CLSA, Standard & Poors 35 35
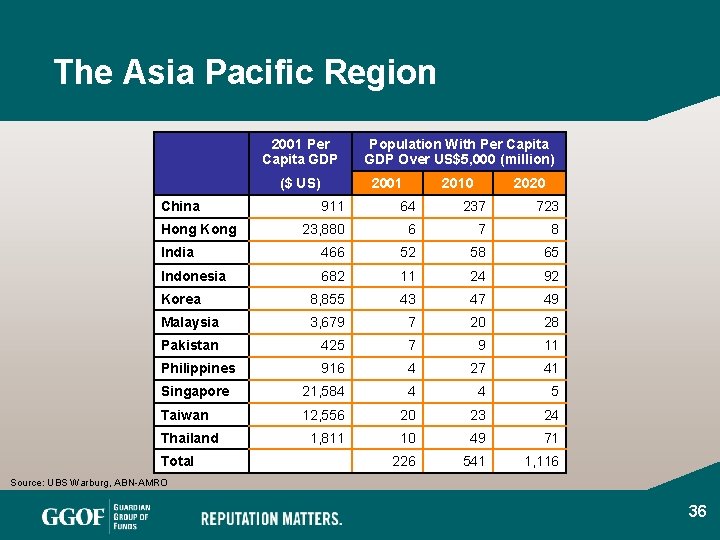
The Asia Pacific Region 2001 Per Capita GDP 2001 ($ US) China Population With Per Capita GDP Over US$5, 000 (million) 2010 2020 911 64 237 723 23, 880 6 7 8 India 466 52 58 65 Indonesia 682 11 24 92 Korea 8, 855 43 47 49 Malaysia 3, 679 7 20 28 Pakistan 425 7 9 11 Philippines 916 4 27 41 Singapore 21, 584 4 4 5 Taiwan 12, 556 20 23 24 1, 811 10 49 71 226 541 1, 116 Hong Kong Thailand Total Source: UBS Warburg, ABN-AMRO 36 36
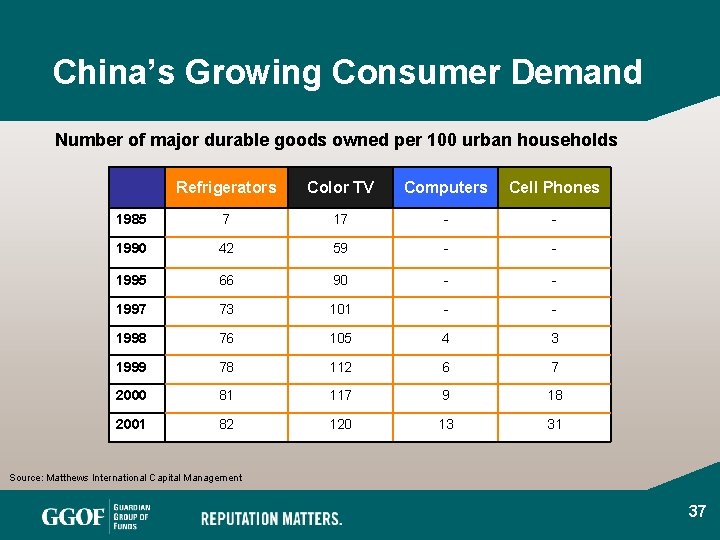
China’s Growing Consumer Demand Number of major durable goods owned per 100 urban households Refrigerators Color TV Computers Cell Phones 1985 7 17 - - 1990 42 59 - - 1995 66 90 - - 1997 73 101 - - 1998 76 105 4 3 1999 78 112 6 7 2000 81 117 9 18 2001 82 120 13 31 Source: Matthews International Capital Management 37 37
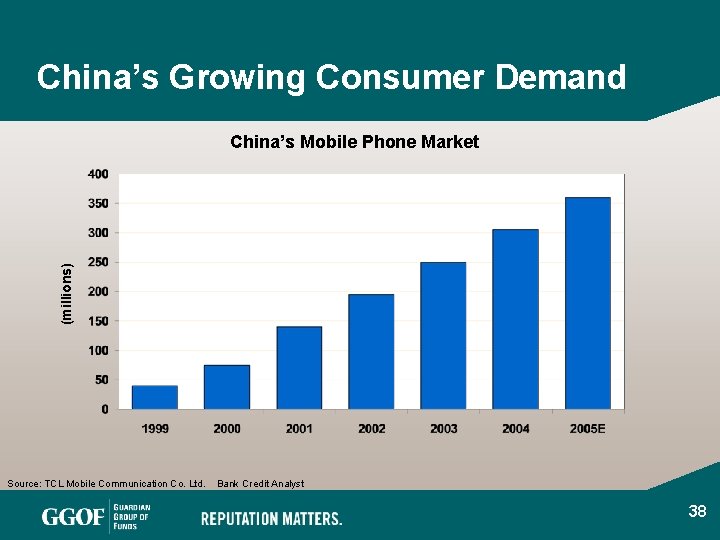
China’s Growing Consumer Demand (millions) China’s Mobile Phone Market Source: TCL Mobile Communication Co. Ltd. Bank Credit Analyst 38 38
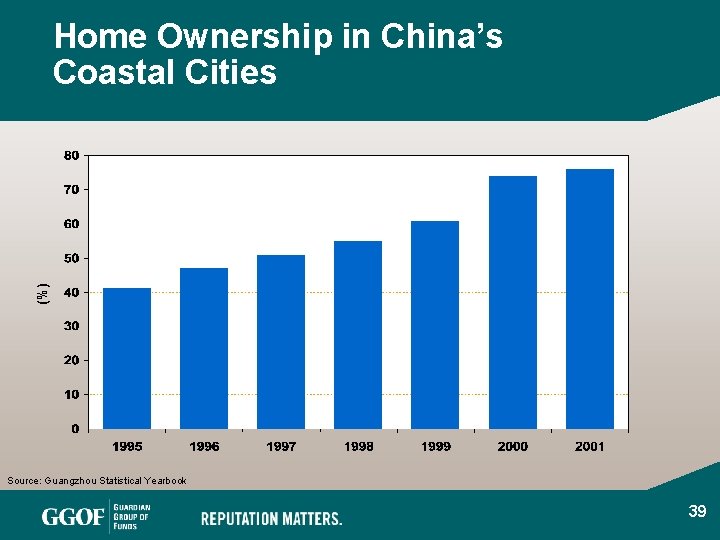
(%) Home Ownership in China’s Coastal Cities Source: Guangzhou Statistical Yearbook 39 39
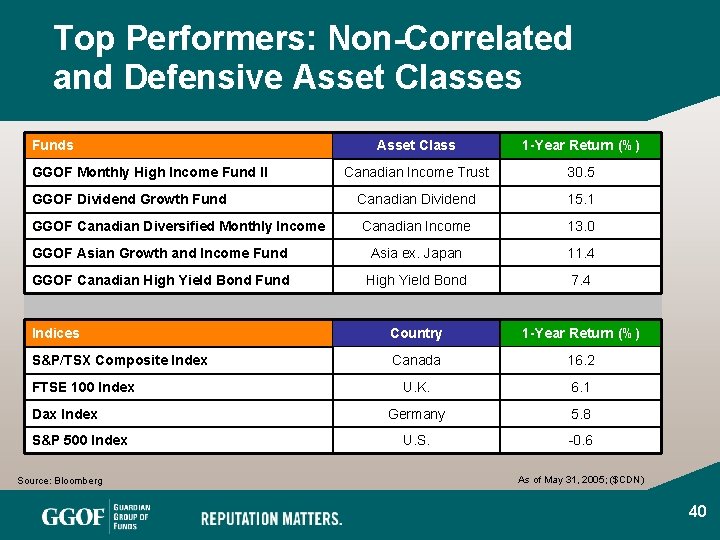
Top Performers: Non-Correlated and Defensive Asset Classes Funds Asset Class 1 -Year Return (%) Canadian Income Trust 30. 5 Canadian Dividend 15. 1 Canadian Income 13. 0 GGOF Asian Growth and Income Fund Asia ex. Japan 11. 4 GGOF Canadian High Yield Bond Fund High Yield Bond 7. 4 Indices Country 1 -Year Return (%) S&P/TSX Composite Index Canada 16. 2 U. K. 6. 1 Germany 5. 8 U. S. -0. 6 GGOF Monthly High Income Fund II GGOF Dividend Growth Fund GGOF Canadian Diversified Monthly Income FTSE 100 Index Dax Index S&P 500 Index Source: Bloomberg As of May 31, 2005; ($CDN) 40 40
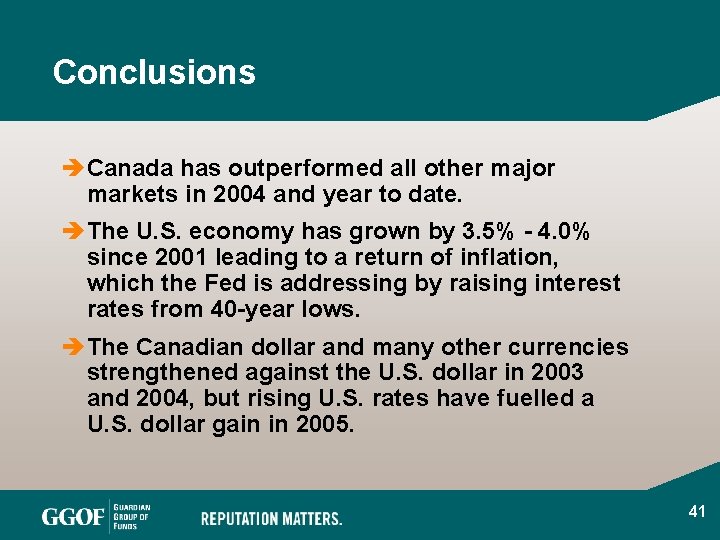
Conclusions è Canada has outperformed all other major markets in 2004 and year to date. è The U. S. economy has grown by 3. 5% - 4. 0% since 2001 leading to a return of inflation, which the Fed is addressing by raising interest rates from 40 -year lows. è The Canadian dollar and many other currencies strengthened against the U. S. dollar in 2003 and 2004, but rising U. S. rates have fuelled a U. S. dollar gain in 2005. 41 41
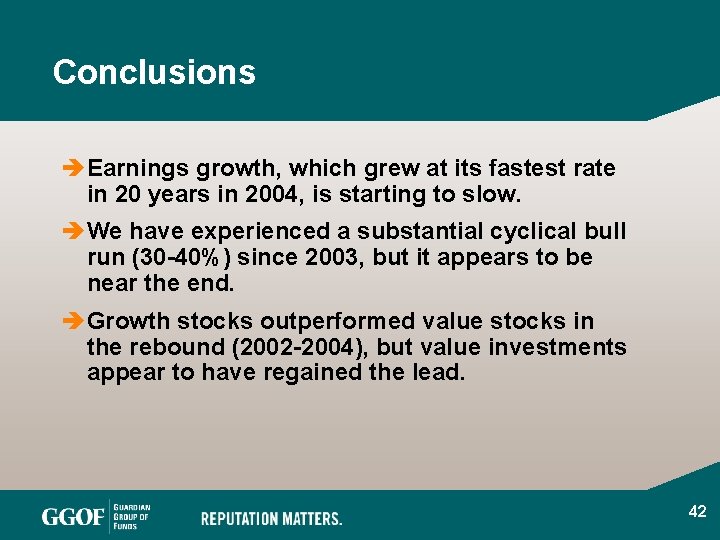
Conclusions è Earnings growth, which grew at its fastest rate in 20 years in 2004, is starting to slow. è We have experienced a substantial cyclical bull run (30 -40%) since 2003, but it appears to be near the end. è Growth stocks outperformed value stocks in the rebound (2002 -2004), but value investments appear to have regained the lead. 42 42
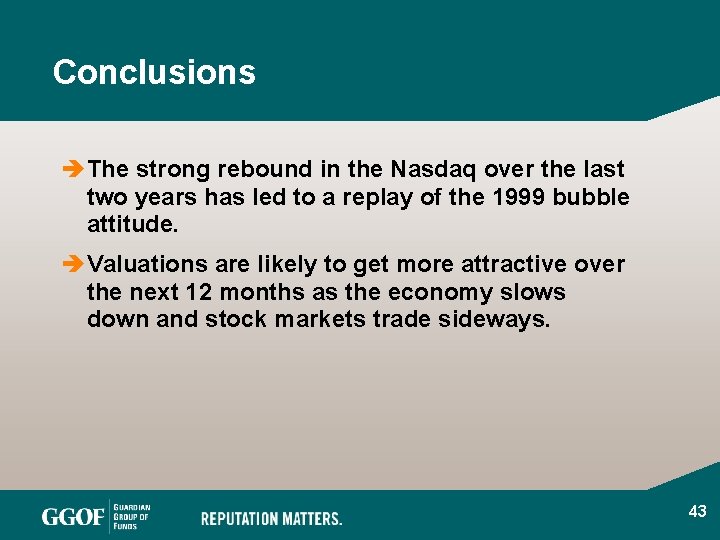
Conclusions è The strong rebound in the Nasdaq over the last two years has led to a replay of the 1999 bubble attitude. è Valuations are likely to get more attractive over the next 12 months as the economy slows down and stock markets trade sideways. 43 43
Disclaimer Sales commissions, service fees, management fees and expenses all may be associated with mutual fund investments. Please read the prospectus before investing. The indicated rates of return include changes in unit value and assume reinvestment of all distributions, and do not take into account sales, redemption or optional charges or income taxes payable by any securityholders, which would have reduced returns. Mutual funds are not guaranteed, their values change frequently and past performance may not be repeated. 44 44