Getting to know your LWDA The Statewide Workforce


")


 Sign in.")
, you should see a series of")


- Slides: 23
Getting to know your LWDA The Statewide Workforce Development’s Dashboard and selected canned reports in Jobs 4 TN Benjamin Passino l April 2018
What is the Dashboard for the Statewide Workforce Development Board? The Dashboard • Consistently provides board members with key measures they need in order to further a data driven approach • Started in May of 2017 and is quarterly • Founded by the desire of our board to compare fiscal and programmatic metrics. It is able to do so by using unified: • Definitions • Date ranges – Current quarter – Pervious quarter – Same quarter of the previous year • Reporting paths
Fall 2017 PY 17 Q 2 (10/01/2017 to 12/31/2017)
Future of the Dashboard • The dashboard continues to improve by incorporating measures that are – Accessible – Timely – Accurate • Workforce Services is currently working with WIRED to make a digital version of the dashboard – The goal is to have all live and transparent data
Taking a closer look at enrollment
New and Total Enrollments across Tennessee
Geographical Areas Currently, the SWDB’s Dashboard tracks measures across 17 geographical areas. • Tennessee as an aggregate • 3 Grand Regions • 13 Local Workforce Development Areas
Unified Definitions As with each measure on the dashboard, enrollments are defined as: A new enrollment occurs when a participant begins a new period of participation between the specified time period. -This is type of enrollment may be a better measure of activity. Total enrollments is a count of all enrolled individuals within the specified time period, included those that are carried in. -This type of enrollment measure may be a better metric to use when comparing with fiscal data as all active participants can continue to draw down funds.
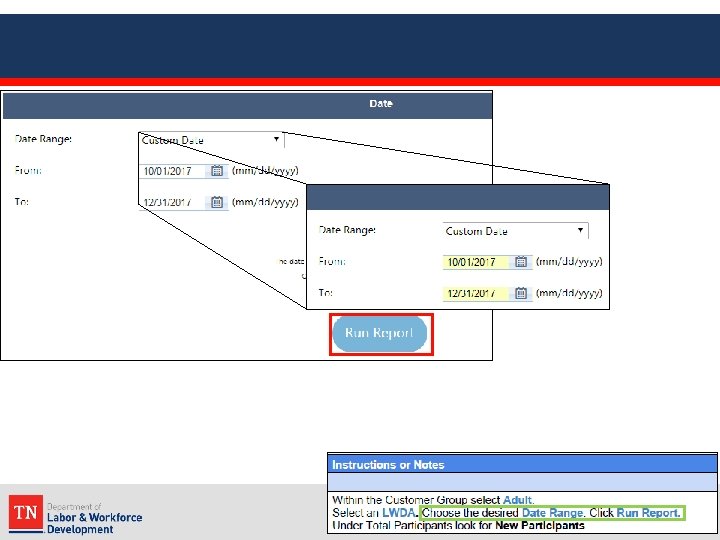
Unified Date Ranges Each measure has a unified set of date ranges. Current Quarter (PY 17 Q 2: Oct. 1, 2017 to Dec. 31, 2017) -most recent data available Same Quarter Previous Year (PY 16 Q 2: Oct. 1, 2016 to Dec. 31, 2016) -seasonally comparative to most recent quarter Latest Full Program Year (PY 16: July 1, 2016 to June 30, 2017) -provides historical context
Reporting Path
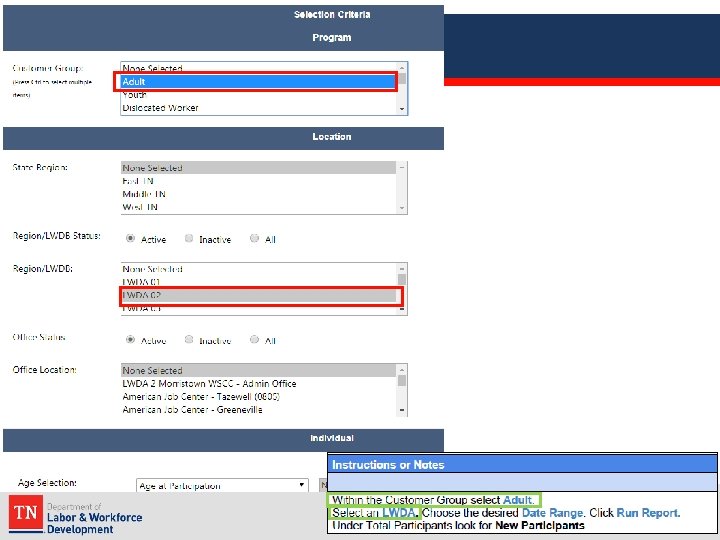
Reporting Path- example WIOA Title I Adult New Enrollments
Pull up VOS (Jobs 4 TN. gov) Sign in.
Reports • On the opening page (My Dashboard), you should see a series of menus on the left. Look for Reports.
WIOA Participant Summary
Reporting Path- example WIOA Title I Adult New Enrollments
New Enrollment Count Note: Total Enrollments, would be 316.
What can you do with this data?
Tennessee Title I Adult New Enrollment
Tennessee Title I Dislocated Workers New Enrollment
Tennessee Title I Youth New Enrollment
Thank you!