Getting the Dirt on Soils Texture and Properties


 • Sand - gritty • Silt - smooth, velvety")
 • • • Sand Loamy Sandy Loam Silt • Sandy")

")
 Sand Bulk Density (g/cc)")
 Powder funnels Balance")


- Slides: 19
Getting the Dirt on Soils: Texture and Properties Dr. David Lindbo Emeritus Professor, NC State University Director Soil Science Division, USDA-NRCS lindbo@ncsu. edu david. lindbo@usda. gov
Soil Texture
Soil Texture • Use texture to make inferences into pore size • From pore size begin to estimate water movement and treatment • Texture by itself is not enough information to determine site suitability
Soil Texture • Mineral material only • Material > 2 mm are coarse fragments • Material < 2 mm only – Sand - 2. 0 - 0. 05 mm – Silt - 0. 05 - 0. 002 mm – Clay - < 0. 002 mm
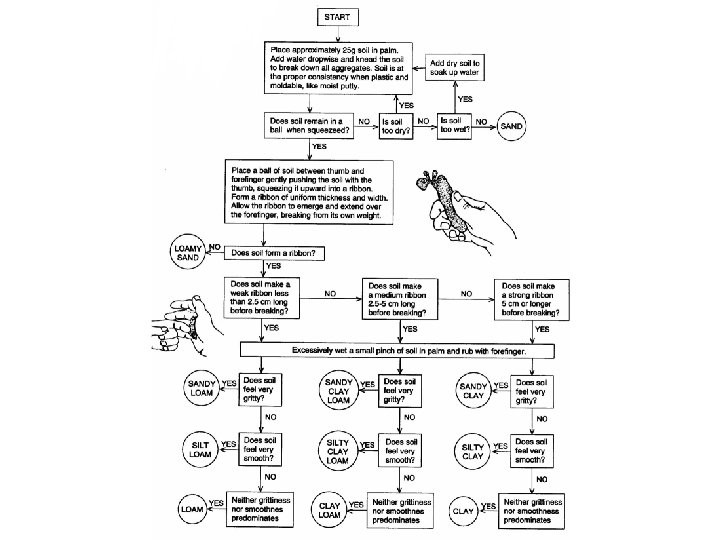
Soil Texture (mineral material only) • Sand - gritty • Silt - smooth, velvety • Clay - slick, sticky
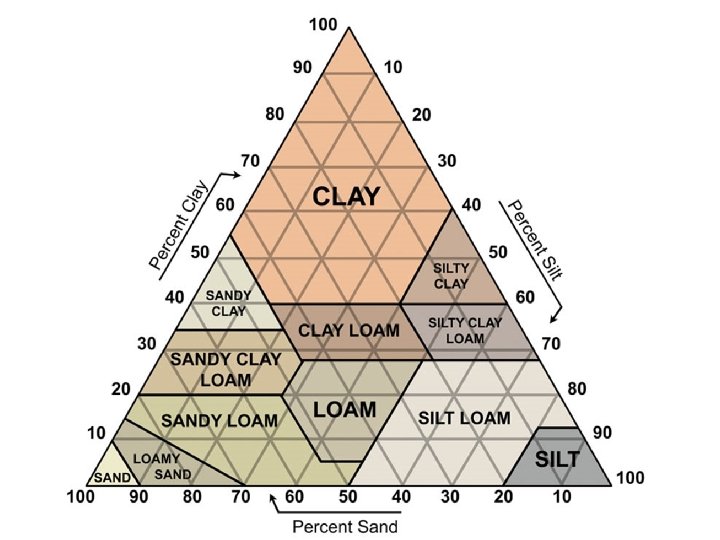
USDA Textural Classes (12) • • • Sand Loamy Sandy Loam Silt • Sandy Clay Loam • Silty Clay Loam • Sandy Clay • Silty Clay • Clay
Sand + Silt + Clay = 100% 34 % Sand 33 % Silt 33 % Clay Texture = CLAY LOAM
Texture Relationships Property Sand Silt Clay Bulk Density High Medium Low Porosity (pore space) Low Medium High Water Movement High Medium Low Plant Available Water (PAW) or Available Water Capacity (AWC) Low High Medium Water Holding Low Medium High Erosion Low to High Medium
Texture – Bulk Density – Porosity Relaionships Texture Porosity (%) Sand Bulk Density (g/cc) 1. 55+ Sandy Loam 1. 40+ 48 Loam 1. 20 55 Silt Loam 1. 15 56 Clay Loam 1. 10 59 Clay 1. 05 60 42
Experiment – Bulk Density • • 100 ml graduated cylinder (plastic) Powder funnels Balance 50 g of dry soil (different textures) – note that all soils should not be agregated – Sand – Silt (Silt loam) – Clay (no aggregates) – Organic (peat or other potting soil)
SAND SILT CLAY ORGANIC 100 ml 75 ml 50 ml 25 ml mass volume 50 g 30 ml Bulk 1. 67 Density g/ml 50 g 40 ml 1. 25 g/ml 50 g 45 ml 1. 11 g/ml 50 g 75 ml 0. 67 g/ml
Experiment – Water Holding • • • Synthetic sponge torn into smallish pieces 1 quart deep storage container ½ gallon pitcher Water Sharpie or similar marker
A – B = Saturation C – B = Gravitational Water A – C = Field Capacity (water still in the soil) D – (C + B) = Plant Available Water (PAW) or Available Water Capacity (AWC) A – D = Unavailable water or soil water at the permanent wilting point (PWP) A D C B
SAND SILT CLAY
Texture Plays a Major Role with Micropores. Structure Plays a Major Role with Macropores.
Questions?