Getting Started Lowlevel GDB 1 Download the tarball
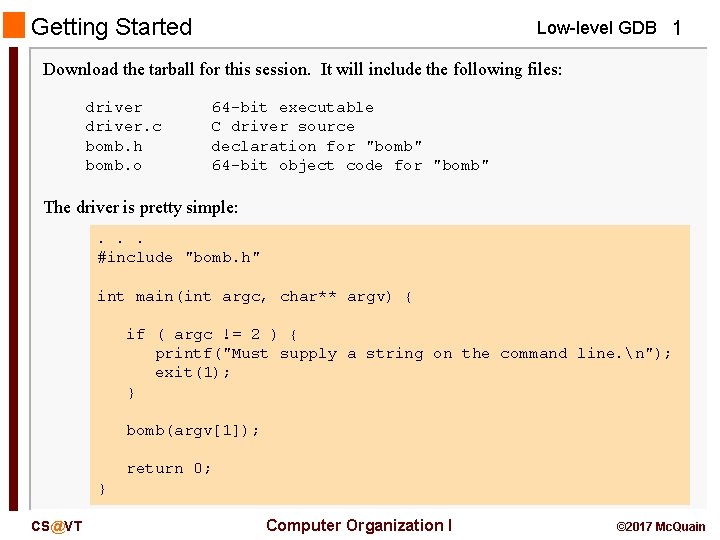
Getting Started Low-level GDB 1 Download the tarball for this session. It will include the following files: driver. c bomb. h bomb. o 64 -bit executable C driver source declaration for "bomb" 64 -bit object code for "bomb" The driver is pretty simple: . . . #include "bomb. h" int main(int argc, char** argv) { if ( argc != 2 ) { printf("Must supply a string on the command line. n"); exit(1); } bomb(argv[1]); return 0; } CS@VT Computer Organization I © 2017 Mc. Quain
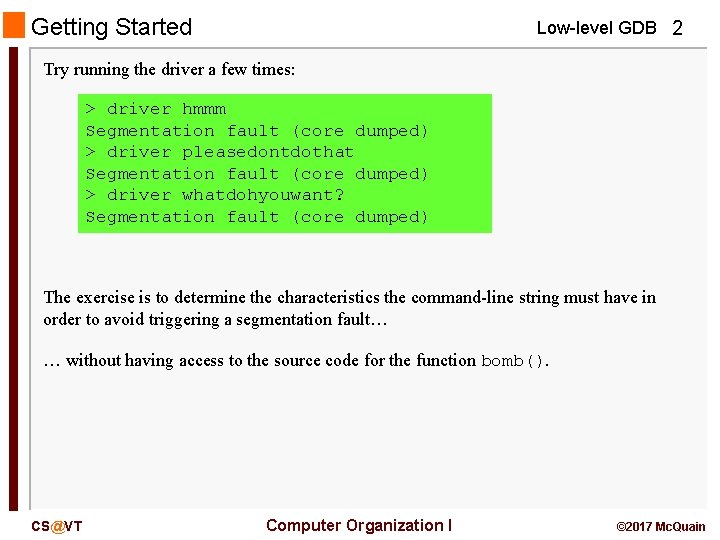
Getting Started Low-level GDB 2 Try running the driver a few times: > driver hmmm Segmentation fault (core dumped) > driver pleasedontdothat Segmentation fault (core dumped) > driver whatdohyouwant? Segmentation fault (core dumped) The exercise is to determine the characteristics the command-line string must have in order to avoid triggering a segmentation fault… … without having access to the source code for the function bomb(). CS@VT Computer Organization I © 2017 Mc. Quain
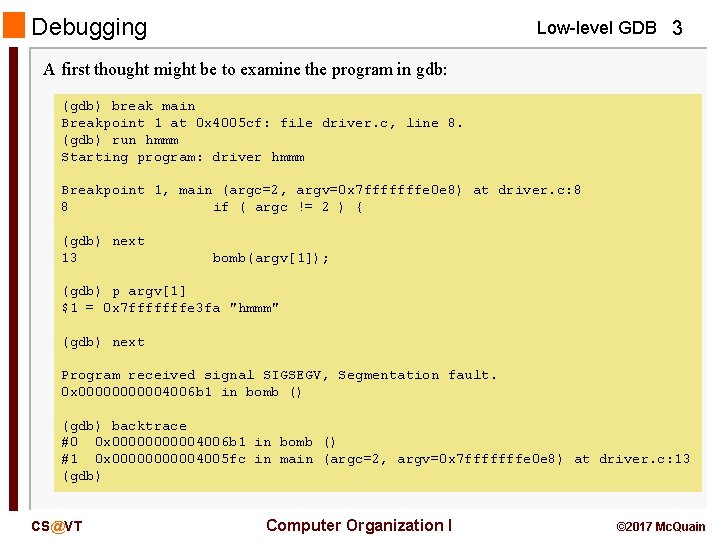
Debugging Low-level GDB 3 A first thought might be to examine the program in gdb: (gdb) break main Breakpoint 1 at 0 x 4005 cf: file driver. c, line 8. (gdb) run hmmm Starting program: driver hmmm Breakpoint 1, main (argc=2, argv=0 x 7 fffffffe 0 e 8) at driver. c: 8 8 if ( argc != 2 ) { (gdb) next 13 bomb(argv[1]); (gdb) p argv[1] $1 = 0 x 7 fffffffe 3 fa "hmmm" (gdb) next Program received signal SIGSEGV, Segmentation fault. 0 x 000004006 b 1 in bomb () (gdb) backtrace #0 0 x 000004006 b 1 in bomb () #1 0 x 000004005 fc in main (argc=2, argv=0 x 7 fffffffe 0 e 8) at driver. c: 13 (gdb) CS@VT Computer Organization I © 2017 Mc. Quain
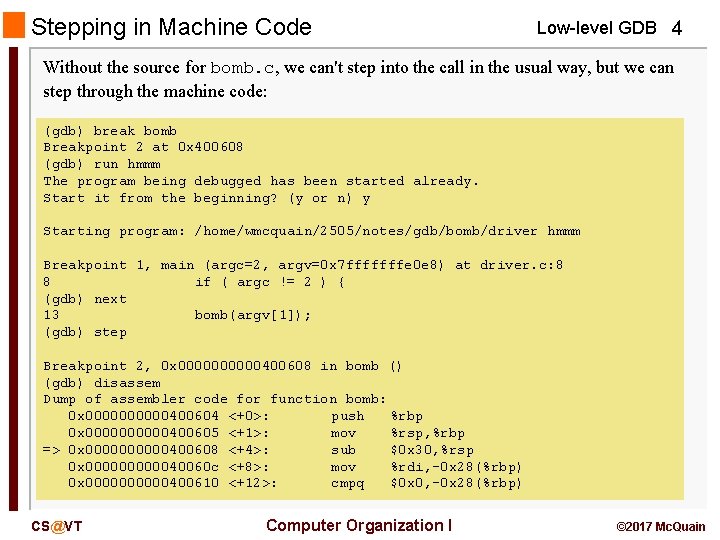
Stepping in Machine Code Low-level GDB 4 Without the source for bomb. c, we can't step into the call in the usual way, but we can step through the machine code: (gdb) break bomb Breakpoint 2 at 0 x 400608 (gdb) run hmmm The program being debugged has been started already. Start it from the beginning? (y or n) y Starting program: /home/wmcquain/2505/notes/gdb/bomb/driver hmmm Breakpoint 1, main (argc=2, argv=0 x 7 fffffffe 0 e 8) at driver. c: 8 8 if ( argc != 2 ) { (gdb) next 13 bomb(argv[1]); (gdb) step Breakpoint 2, 0 x 00000400608 in bomb () (gdb) disassem Dump of assembler code for function bomb: 0 x 00000400604 <+0>: push %rbp 0 x 00000400605 <+1>: mov %rsp, %rbp => 0 x 00000400608 <+4>: sub $0 x 30, %rsp 0 x 0000040060 c <+8>: mov %rdi, -0 x 28(%rbp) 0 x 00000400610 <+12>: cmpq $0 x 0, -0 x 28(%rbp) CS@VT Computer Organization I © 2017 Mc. Quain
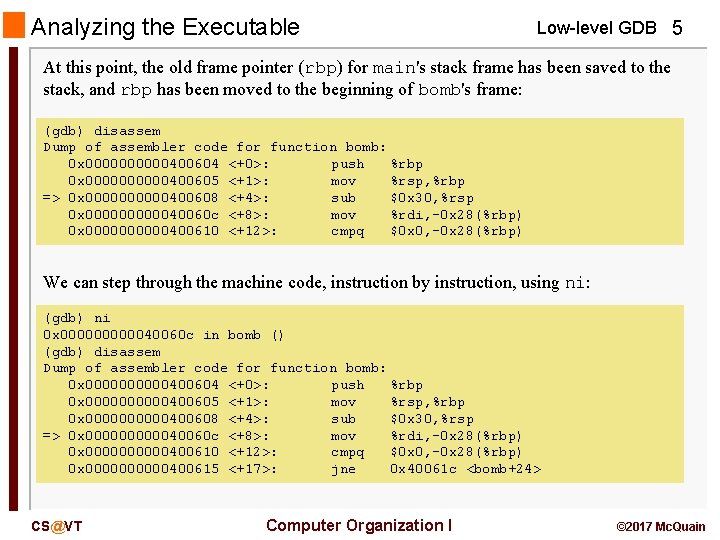
Analyzing the Executable Low-level GDB 5 At this point, the old frame pointer (rbp) for main's stack frame has been saved to the stack, and rbp has been moved to the beginning of bomb's frame: (gdb) disassem Dump of assembler code for function bomb: 0 x 00000400604 <+0>: push %rbp 0 x 00000400605 <+1>: mov %rsp, %rbp => 0 x 00000400608 <+4>: sub $0 x 30, %rsp 0 x 0000040060 c <+8>: mov %rdi, -0 x 28(%rbp) 0 x 00000400610 <+12>: cmpq $0 x 0, -0 x 28(%rbp) We can step through the machine code, instruction by instruction, using ni: (gdb) ni 0 x 0000040060 c in bomb () (gdb) disassem Dump of assembler code for function bomb: 0 x 00000400604 <+0>: push %rbp 0 x 00000400605 <+1>: mov %rsp, %rbp 0 x 00000400608 <+4>: sub $0 x 30, %rsp => 0 x 0000040060 c <+8>: mov %rdi, -0 x 28(%rbp) 0 x 00000400610 <+12>: cmpq $0 x 0, -0 x 28(%rbp) 0 x 00000400615 <+17>: jne 0 x 40061 c <bomb+24> CS@VT Computer Organization I © 2017 Mc. Quain
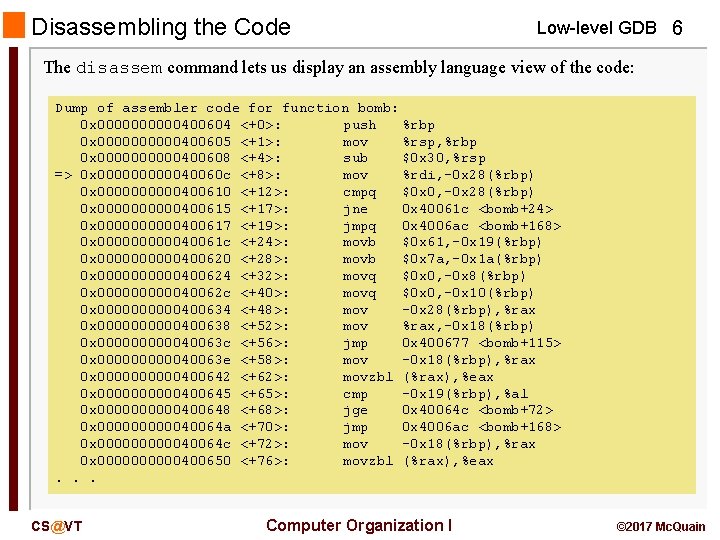
Disassembling the Code Low-level GDB 6 The disassem command lets us display an assembly language view of the code: Dump of assembler code for function bomb: 0 x 00000400604 <+0>: push %rbp 0 x 00000400605 <+1>: mov %rsp, %rbp 0 x 00000400608 <+4>: sub $0 x 30, %rsp => 0 x 0000040060 c <+8>: mov %rdi, -0 x 28(%rbp) 0 x 00000400610 <+12>: cmpq $0 x 0, -0 x 28(%rbp) 0 x 00000400615 <+17>: jne 0 x 40061 c <bomb+24> 0 x 00000400617 <+19>: jmpq 0 x 4006 ac <bomb+168> 0 x 0000040061 c <+24>: movb $0 x 61, -0 x 19(%rbp) 0 x 00000400620 <+28>: movb $0 x 7 a, -0 x 1 a(%rbp) 0 x 00000400624 <+32>: movq $0 x 0, -0 x 8(%rbp) 0 x 0000040062 c <+40>: movq $0 x 0, -0 x 10(%rbp) 0 x 00000400634 <+48>: mov -0 x 28(%rbp), %rax 0 x 00000400638 <+52>: mov %rax, -0 x 18(%rbp) 0 x 0000040063 c <+56>: jmp 0 x 400677 <bomb+115> 0 x 0000040063 e <+58>: mov -0 x 18(%rbp), %rax 0 x 00000400642 <+62>: movzbl (%rax), %eax 0 x 00000400645 <+65>: cmp -0 x 19(%rbp), %al 0 x 00000400648 <+68>: jge 0 x 40064 c <bomb+72> 0 x 0000040064 a <+70>: jmp 0 x 4006 ac <bomb+168> 0 x 0000040064 c <+72>: mov -0 x 18(%rbp), %rax 0 x 00000400650 <+76>: movzbl (%rax), %eax. . . CS@VT Computer Organization I © 2017 Mc. Quain
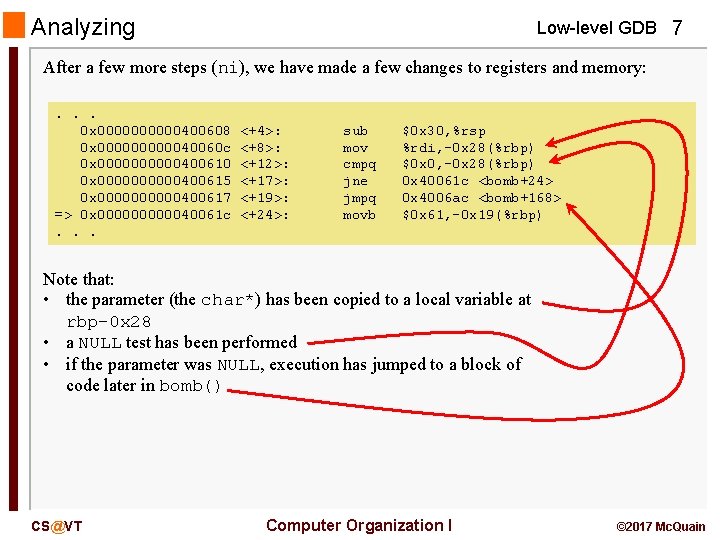
Analyzing Low-level GDB 7 After a few more steps (ni), we have made a few changes to registers and memory: . . . 0 x 00000400608 0 x 0000040060 c 0 x 00000400610 0 x 00000400615 0 x 00000400617 => 0 x 0000040061 c. . . <+4>: <+8>: <+12>: <+17>: <+19>: <+24>: sub mov cmpq jne jmpq movb $0 x 30, %rsp %rdi, -0 x 28(%rbp) $0 x 0, -0 x 28(%rbp) 0 x 40061 c <bomb+24> 0 x 4006 ac <bomb+168> $0 x 61, -0 x 19(%rbp) Note that: • the parameter (the char*) has been copied to a local variable at rbp-0 x 28 • a NULL test has been performed • if the parameter was NULL, execution has jumped to a block of code later in bomb() CS@VT Computer Organization I © 2017 Mc. Quain
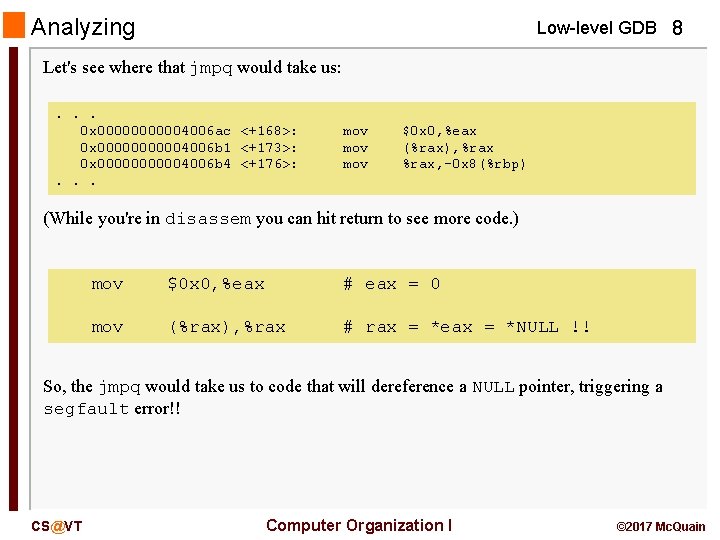
Analyzing Low-level GDB 8 Let's see where that jmpq would take us: . . . 0 x 000004006 ac <+168>: 0 x 000004006 b 1 <+173>: 0 x 000004006 b 4 <+176>: . . . mov mov $0 x 0, %eax (%rax), %rax, -0 x 8(%rbp) (While you're in disassem you can hit return to see more code. ) mov $0 x 0, %eax # eax = 0 mov (%rax), %rax # rax = *eax = *NULL !! So, the jmpq would take us to code that will dereference a NULL pointer, triggering a segfault error!! CS@VT Computer Organization I © 2017 Mc. Quain
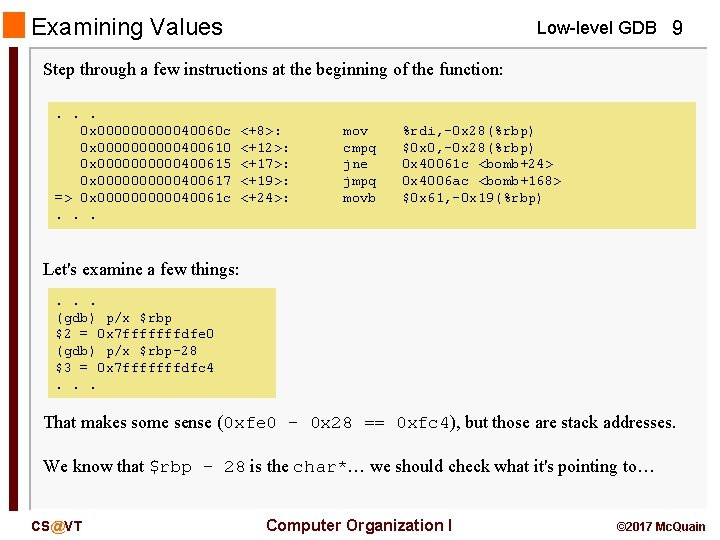
Examining Values Low-level GDB 9 Step through a few instructions at the beginning of the function: . . . 0 x 0000040060 c 0 x 00000400610 0 x 00000400615 0 x 00000400617 => 0 x 0000040061 c. . . <+8>: <+12>: <+17>: <+19>: <+24>: mov cmpq jne jmpq movb %rdi, -0 x 28(%rbp) $0 x 0, -0 x 28(%rbp) 0 x 40061 c <bomb+24> 0 x 4006 ac <bomb+168> $0 x 61, -0 x 19(%rbp) Let's examine a few things: . . . (gdb) p/x $rbp $2 = 0 x 7 fffffffdfe 0 (gdb) p/x $rbp-28 $3 = 0 x 7 fffffffdfc 4. . . That makes some sense (0 xfe 0 – 0 x 28 == 0 xfc 4), but those are stack addresses. We know that $rbp – 28 is the char*… we should check what it's pointing to… CS@VT Computer Organization I © 2017 Mc. Quain
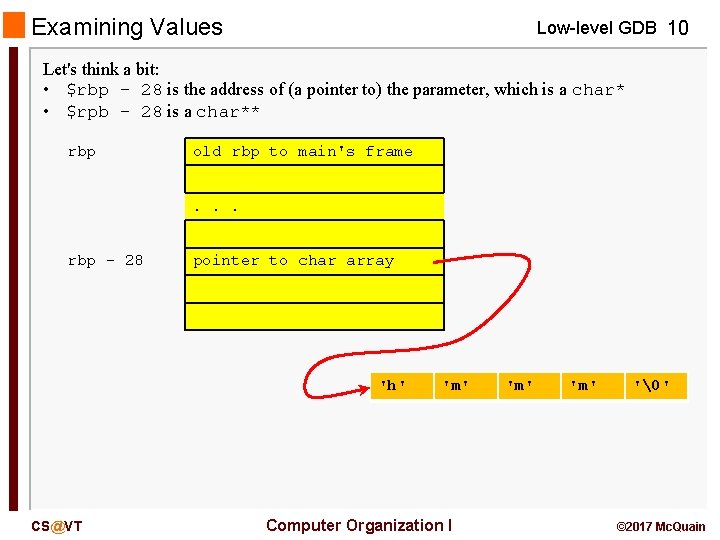
Examining Values Low-level GDB 10 Let's think a bit: • $rbp – 28 is the address of (a pointer to) the parameter, which is a char* • $rpb – 28 is a char** rbp old rbp to main's frame. . . rbp - 28 pointer to char array 'h' CS@VT 'm' Computer Organization I 'm' '�' © 2017 Mc. Quain
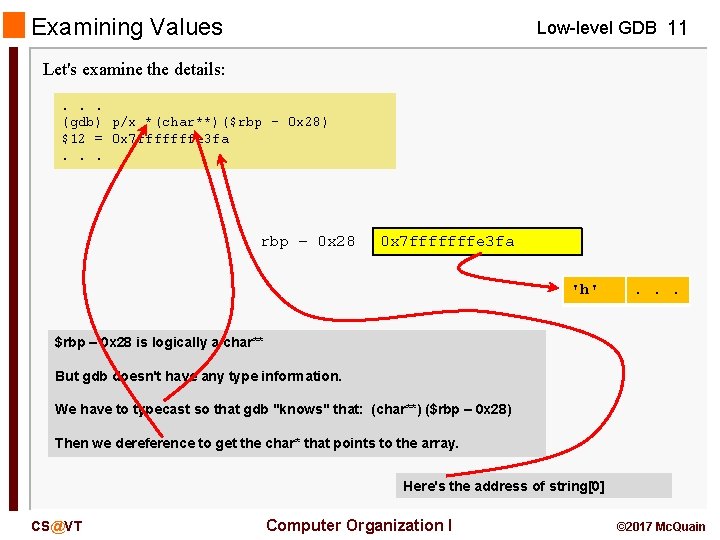
Examining Values Low-level GDB 11 Let's examine the details: . . . (gdb) p/x *(char**)($rbp - 0 x 28) $12 = 0 x 7 fffffffe 3 fa. . . rbp – 0 x 28 0 x 7 fffffffe 3 fa 'h' . . . $rbp – 0 x 28 is logically a char** But gdb doesn't have any type information. We have to typecast so that gdb "knows" that: (char**) ($rbp – 0 x 28) Then we dereference to get the char* that points to the array. Here's the address of string[0] CS@VT Computer Organization I © 2017 Mc. Quain
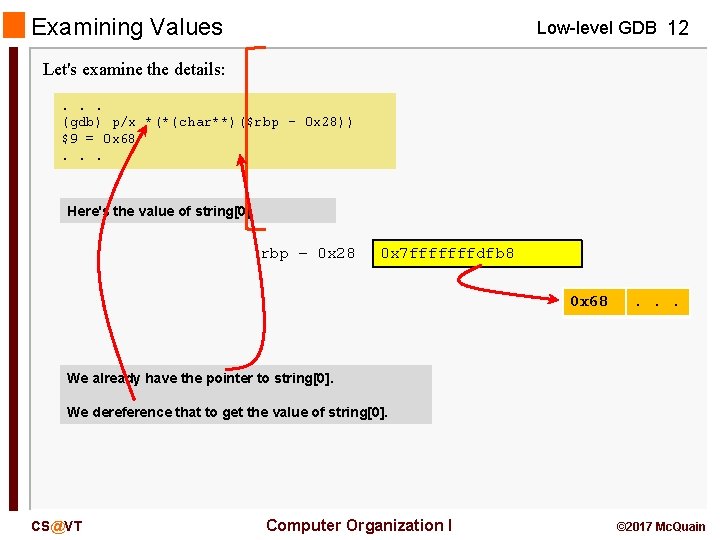
Examining Values Low-level GDB 12 Let's examine the details: . . . (gdb) p/x *(*(char**)($rbp - 0 x 28)) $9 = 0 x 68. . . Here's the value of string[0] rbp – 0 x 28 0 x 7 fffffffdfb 8 0 x 68 . . . We already have the pointer to string[0]. We dereference that to get the value of string[0]. CS@VT Computer Organization I © 2017 Mc. Quain
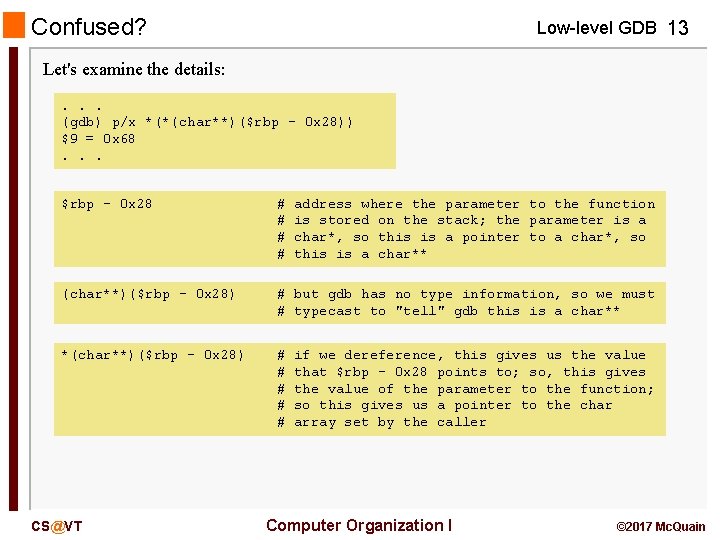
Confused? Low-level GDB 13 Let's examine the details: . . . (gdb) p/x *(*(char**)($rbp - 0 x 28)) $9 = 0 x 68. . . $rbp - 0 x 28 # # (char**)($rbp - 0 x 28) # but gdb has no type information, so we must # typecast to "tell" gdb this is a char** *(char**)($rbp - 0 x 28) # # # CS@VT address where the parameter to the function is stored on the stack; the parameter is a char*, so this is a pointer to a char*, so this is a char** if we dereference, this gives us the value that $rbp – 0 x 28 points to; so, this gives the value of the parameter to the function; so this gives us a pointer to the char array set by the caller Computer Organization I © 2017 Mc. Quain
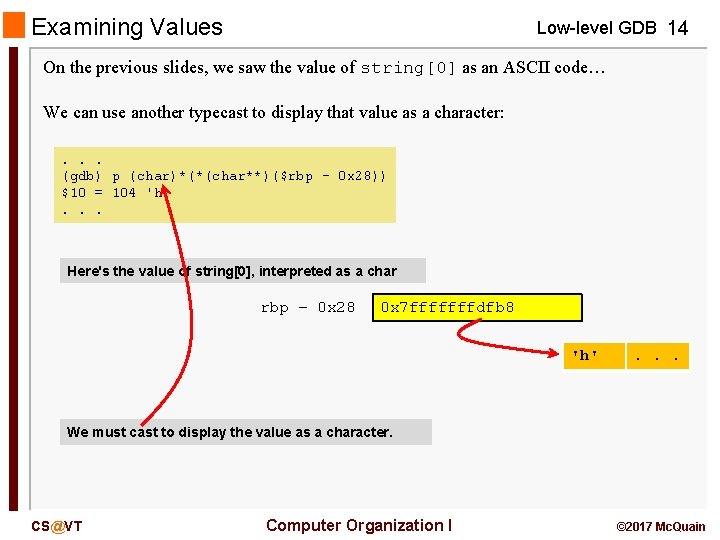
Examining Values Low-level GDB 14 On the previous slides, we saw the value of string[0] as an ASCII code… We can use another typecast to display that value as a character: . . . (gdb) p (char)*(*(char**)($rbp - 0 x 28)) $10 = 104 'h'. . . Here's the value of string[0], interpreted as a char rbp – 0 x 28 0 x 7 fffffffdfb 8 'h' . . . We must cast to display the value as a character. CS@VT Computer Organization I © 2017 Mc. Quain
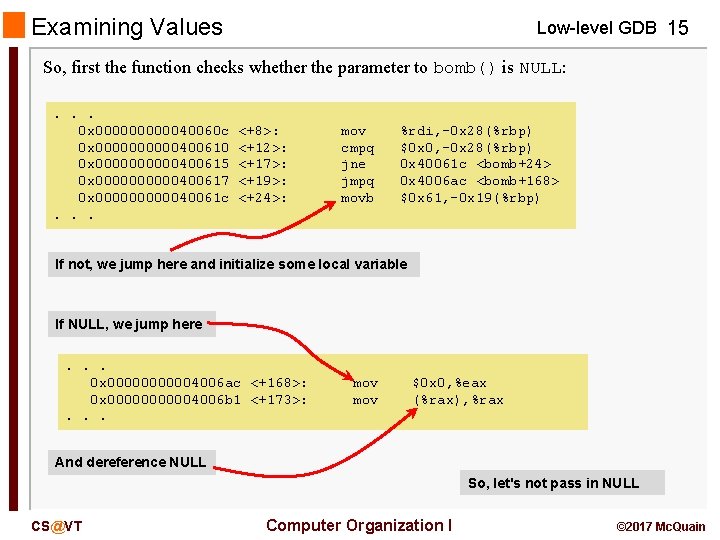
Examining Values Low-level GDB 15 So, first the function checks whether the parameter to bomb() is NULL: . . . 0 x 0000040060 c 0 x 00000400610 0 x 00000400615 0 x 00000400617 0 x 0000040061 c. . . <+8>: <+12>: <+17>: <+19>: <+24>: mov cmpq jne jmpq movb %rdi, -0 x 28(%rbp) $0 x 0, -0 x 28(%rbp) 0 x 40061 c <bomb+24> 0 x 4006 ac <bomb+168> $0 x 61, -0 x 19(%rbp) If not, we jump here and initialize some local variable If NULL, we jump here. . . 0 x 000004006 ac <+168>: 0 x 000004006 b 1 <+173>: . . . mov $0 x 0, %eax (%rax), %rax And dereference NULL So, let's not pass in NULL CS@VT Computer Organization I © 2017 Mc. Quain
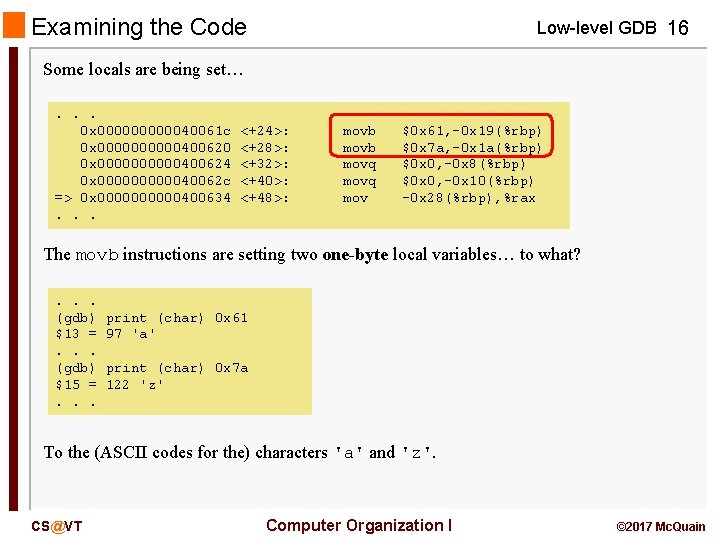
Examining the Code Low-level GDB 16 Some locals are being set…. . . 0 x 0000040061 c 0 x 00000400620 0 x 00000400624 0 x 0000040062 c => 0 x 00000400634. . . <+24>: <+28>: <+32>: <+40>: <+48>: movb movq mov $0 x 61, -0 x 19(%rbp) $0 x 7 a, -0 x 1 a(%rbp) $0 x 0, -0 x 8(%rbp) $0 x 0, -0 x 10(%rbp) -0 x 28(%rbp), %rax The movb instructions are setting two one-byte local variables… to what? . . . (gdb) $13 =. . . (gdb) $15 =. . . print (char) 0 x 61 97 'a' print (char) 0 x 7 a 122 'z' To the (ASCII codes for the) characters 'a' and 'z'. CS@VT Computer Organization I © 2017 Mc. Quain
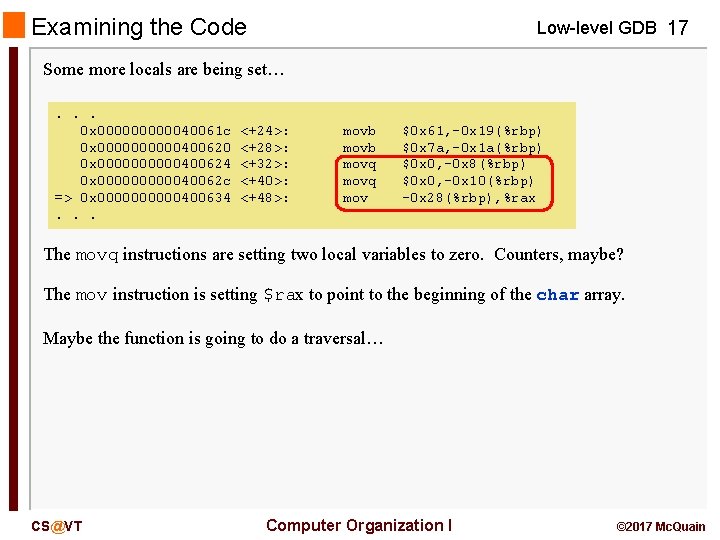
Examining the Code Low-level GDB 17 Some more locals are being set…. . . 0 x 0000040061 c 0 x 00000400620 0 x 00000400624 0 x 0000040062 c => 0 x 00000400634. . . <+24>: <+28>: <+32>: <+40>: <+48>: movb movq mov $0 x 61, -0 x 19(%rbp) $0 x 7 a, -0 x 1 a(%rbp) $0 x 0, -0 x 8(%rbp) $0 x 0, -0 x 10(%rbp) -0 x 28(%rbp), %rax The movq instructions are setting two local variables to zero. Counters, maybe? The mov instruction is setting $rax to point to the beginning of the char array. Maybe the function is going to do a traversal… CS@VT Computer Organization I © 2017 Mc. Quain
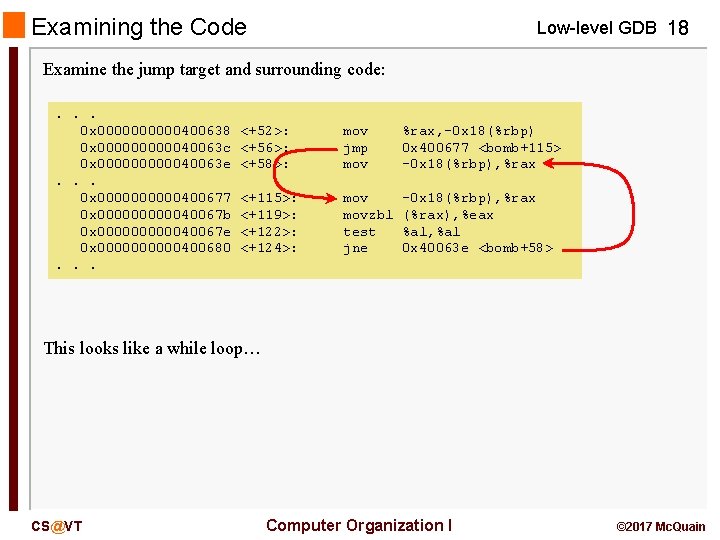
Examining the Code Low-level GDB 18 Examine the jump target and surrounding code: . . . 0 x 00000400638 0 x 0000040063 c 0 x 0000040063 e. . . 0 x 00000400677 0 x 0000040067 b 0 x 0000040067 e 0 x 00000400680. . . <+52>: <+56>: <+58>: mov jmp mov %rax, -0 x 18(%rbp) 0 x 400677 <bomb+115> -0 x 18(%rbp), %rax <+115>: <+119>: <+122>: <+124>: movzbl test jne -0 x 18(%rbp), %rax (%rax), %eax %al, %al 0 x 40063 e <bomb+58> This looks like a while loop… CS@VT Computer Organization I © 2017 Mc. Quain
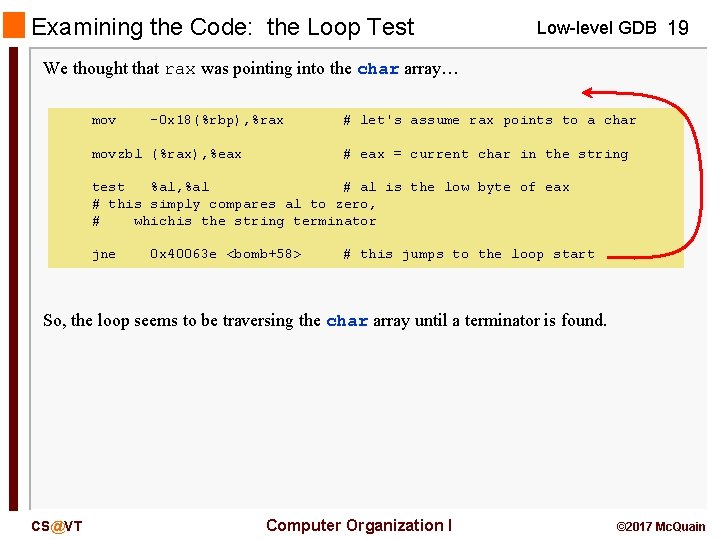
Examining the Code: the Loop Test Low-level GDB 19 We thought that rax was pointing into the char array… mov -0 x 18(%rbp), %rax movzbl (%rax), %eax # let's assume rax points to a char # eax = current char in the string test %al, %al # al is the low byte of eax # this simply compares al to zero, # whichis the string terminator jne 0 x 40063 e <bomb+58> # this jumps to the loop start So, the loop seems to be traversing the char array until a terminator is found. CS@VT Computer Organization I © 2017 Mc. Quain
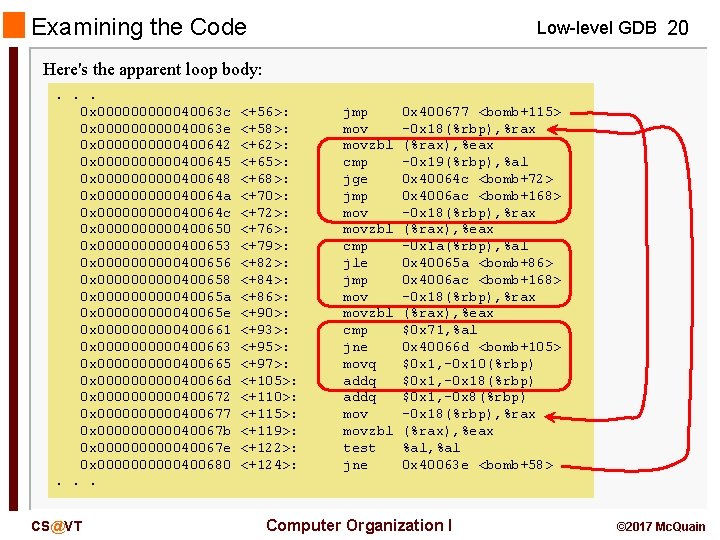
Examining the Code Low-level GDB 20 Here's the apparent loop body: . . . 0 x 0000040063 c 0 x 0000040063 e 0 x 00000400642 0 x 00000400645 0 x 00000400648 0 x 0000040064 a 0 x 0000040064 c 0 x 00000400650 0 x 00000400653 0 x 00000400656 0 x 00000400658 0 x 0000040065 a 0 x 0000040065 e 0 x 00000400661 0 x 00000400663 0 x 00000400665 0 x 0000040066 d 0 x 00000400672 0 x 00000400677 0 x 0000040067 b 0 x 0000040067 e 0 x 00000400680. . . CS@VT <+56>: <+58>: <+62>: <+65>: <+68>: <+70>: <+72>: <+76>: <+79>: <+82>: <+84>: <+86>: <+90>: <+93>: <+95>: <+97>: <+105>: <+110>: <+115>: <+119>: <+122>: <+124>: jmp movzbl cmp jge jmp movzbl cmp jle jmp movzbl cmp jne movq addq movzbl test jne 0 x 400677 <bomb+115> -0 x 18(%rbp), %rax (%rax), %eax -0 x 19(%rbp), %al 0 x 40064 c <bomb+72> 0 x 4006 ac <bomb+168> -0 x 18(%rbp), %rax (%rax), %eax -0 x 1 a(%rbp), %al 0 x 40065 a <bomb+86> 0 x 4006 ac <bomb+168> -0 x 18(%rbp), %rax (%rax), %eax $0 x 71, %al 0 x 40066 d <bomb+105> $0 x 1, -0 x 10(%rbp) $0 x 1, -0 x 18(%rbp) $0 x 1, -0 x 8(%rbp) -0 x 18(%rbp), %rax (%rax), %eax %al, %al 0 x 40063 e <bomb+58> Computer Organization I © 2017 Mc. Quain
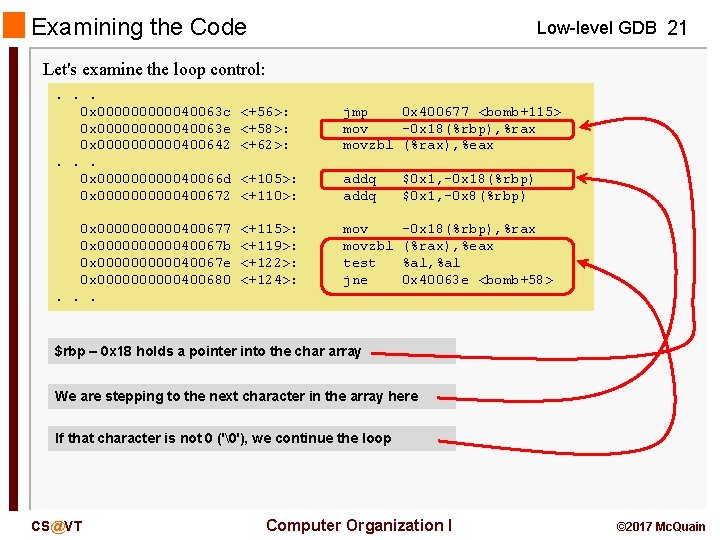
Examining the Code Low-level GDB 21 Let's examine the loop control: . . . 0 x 0000040063 c 0 x 0000040063 e 0 x 00000400642. . . 0 x 0000040066 d 0 x 00000400672 0 x 00000400677 0 x 0000040067 b 0 x 0000040067 e 0 x 00000400680. . . <+56>: <+58>: <+62>: jmp 0 x 400677 <bomb+115> mov -0 x 18(%rbp), %rax movzbl (%rax), %eax <+105>: <+110>: addq $0 x 1, -0 x 18(%rbp) $0 x 1, -0 x 8(%rbp) <+115>: <+119>: <+122>: <+124>: movzbl test jne -0 x 18(%rbp), %rax (%rax), %eax %al, %al 0 x 40063 e <bomb+58> $rbp – 0 x 18 holds a pointer into the char array We are stepping to the next character in the array here If that character is not 0 ('�'), we continue the loop CS@VT Computer Organization I © 2017 Mc. Quain
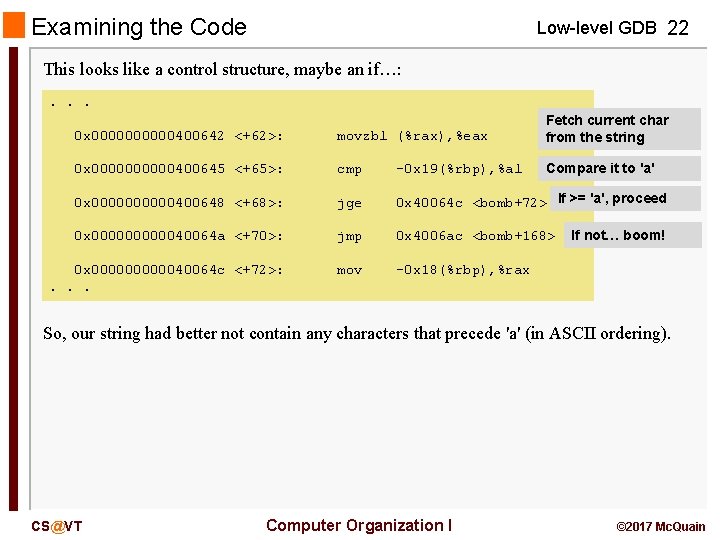
Examining the Code Low-level GDB 22 This looks like a control structure, maybe an if…: . . . 0 x 00000400642 <+62>: movzbl (%rax), %eax Fetch current char from the string 0 x 00000400645 <+65>: cmp -0 x 19(%rbp), %al Compare it to 'a' 0 x 00000400648 <+68>: jge 0 x 40064 c <bomb+72> If >= 'a', proceed 0 x 0000040064 a <+70>: jmp 0 x 4006 ac <bomb+168> 0 x 0000040064 c <+72>: . . . mov -0 x 18(%rbp), %rax If not… boom! So, our string had better not contain any characters that precede 'a' (in ASCII ordering). CS@VT Computer Organization I © 2017 Mc. Quain
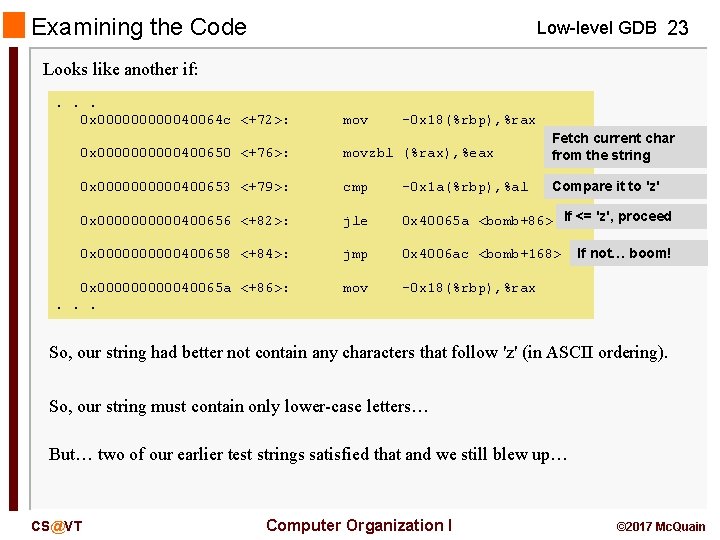
Examining the Code Low-level GDB 23 Looks like another if: . . . 0 x 0000040064 c <+72>: mov -0 x 18(%rbp), %rax 0 x 00000400650 <+76>: movzbl (%rax), %eax Fetch current char from the string 0 x 00000400653 <+79>: cmp -0 x 1 a(%rbp), %al Compare it to 'z' 0 x 00000400656 <+82>: jle 0 x 40065 a <bomb+86> If <= 'z', proceed 0 x 00000400658 <+84>: jmp 0 x 4006 ac <bomb+168> 0 x 0000040065 a <+86>: . . . mov -0 x 18(%rbp), %rax If not… boom! So, our string had better not contain any characters that follow 'z' (in ASCII ordering). So, our string must contain only lower-case letters… But… two of our earlier test strings satisfied that and we still blew up… CS@VT Computer Organization I © 2017 Mc. Quain
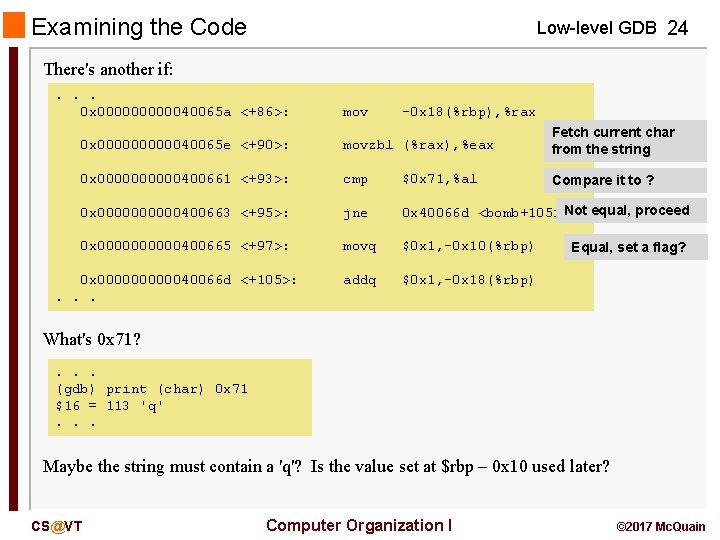
Examining the Code Low-level GDB 24 There's another if: . . . 0 x 0000040065 a <+86>: mov -0 x 18(%rbp), %rax 0 x 0000040065 e <+90>: movzbl (%rax), %eax Fetch current char from the string 0 x 00000400661 <+93>: cmp $0 x 71, %al Compare it to ? 0 x 00000400663 <+95>: jne 0 x 40066 d <bomb+105> Not equal, proceed 0 x 00000400665 <+97>: movq $0 x 1, -0 x 10(%rbp) addq $0 x 1, -0 x 18(%rbp) 0 x 0000040066 d <+105>: . . . Equal, set a flag? What's 0 x 71? . . . (gdb) print (char) 0 x 71 $16 = 113 'q'. . . Maybe the string must contain a 'q'? Is the value set at $rbp – 0 x 10 used later? CS@VT Computer Organization I © 2017 Mc. Quain
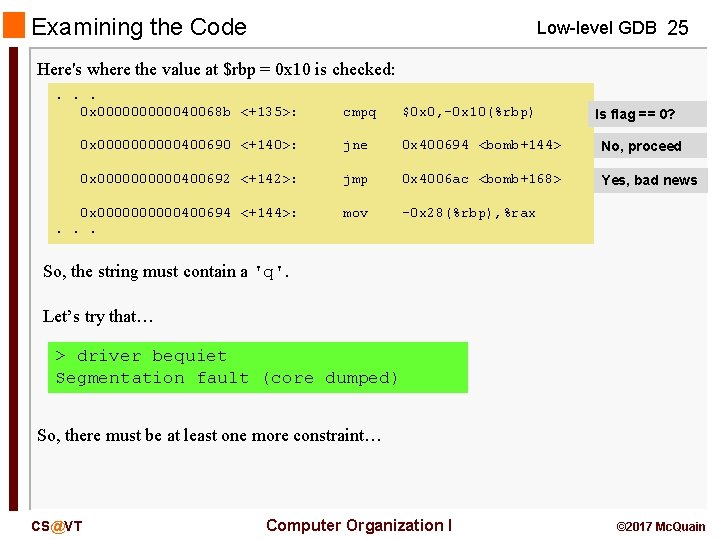
Examining the Code Low-level GDB 25 Here's where the value at $rbp = 0 x 10 is checked: . . . 0 x 0000040068 b <+135>: cmpq $0 x 0, -0 x 10(%rbp) 0 x 00000400690 <+140>: jne 0 x 400694 <bomb+144> No, proceed 0 x 00000400692 <+142>: jmp 0 x 4006 ac <bomb+168> Yes, bad news 0 x 00000400694 <+144>: . . . mov -0 x 28(%rbp), %rax Is flag == 0? So, the string must contain a 'q'. Let’s try that… > driver bequiet Segmentation fault (core dumped) So, there must be at least one more constraint… CS@VT Computer Organization I © 2017 Mc. Quain
- Slides: 25