
Geriatric syndromes Treviso Italy 2019 Shane OHanlon Giuseppe


- Slides: 83
Geriatric syndromes Treviso, Italy, 2019 Shane O’Hanlon & Giuseppe Colloca
Disclosure Nothing to disclose
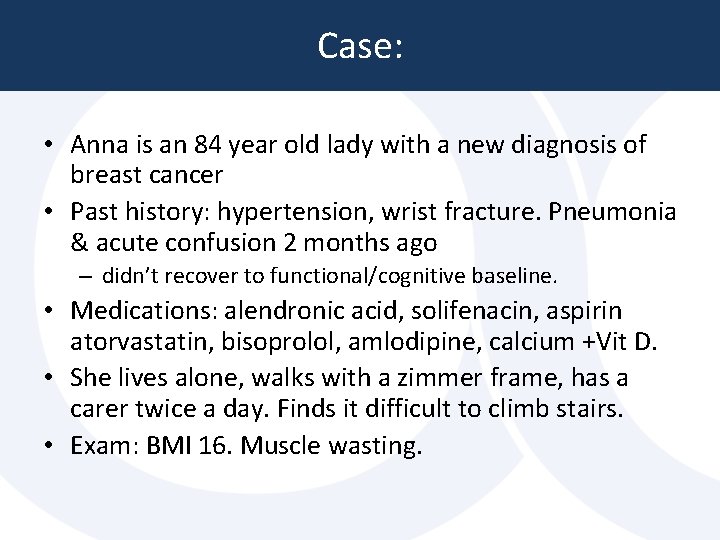
Case: • Anna is an 84 year old lady with a new diagnosis of breast cancer • Past history: hypertension, wrist fracture. Pneumonia & acute confusion 2 months ago – didn’t recover to functional/cognitive baseline. • Medications: alendronic acid, solifenacin, aspirin atorvastatin, bisoprolol, amlodipine, calcium +Vit D. • She lives alone, walks with a zimmer frame, has a carer twice a day. Finds it difficult to climb stairs. • Exam: BMI 16. Muscle wasting.
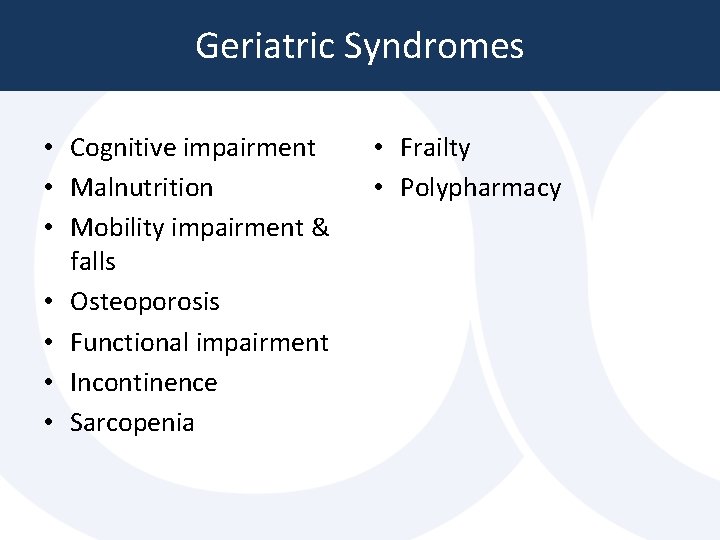
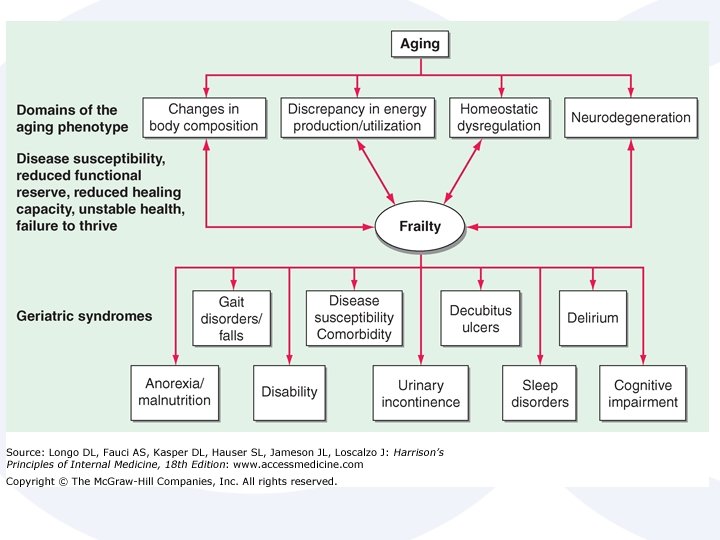
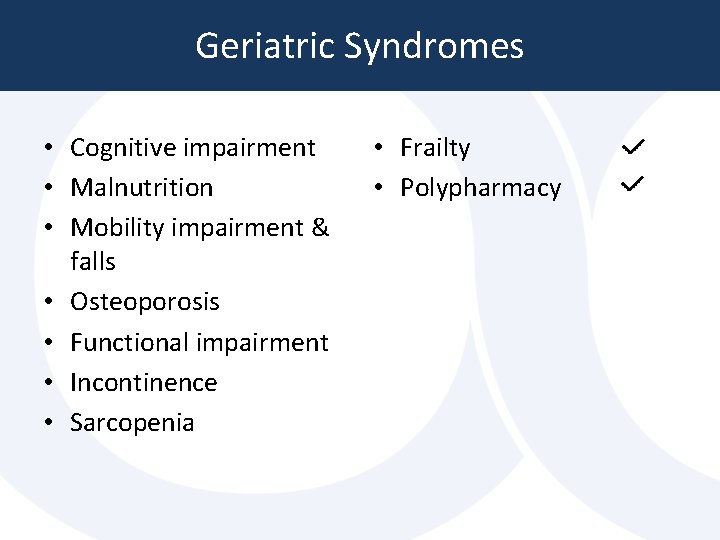
Geriatric Syndromes • Cognitive impairment • Malnutrition • Mobility impairment & falls • Osteoporosis • Functional impairment • Incontinence • Sarcopenia • Frailty • Polypharmacy
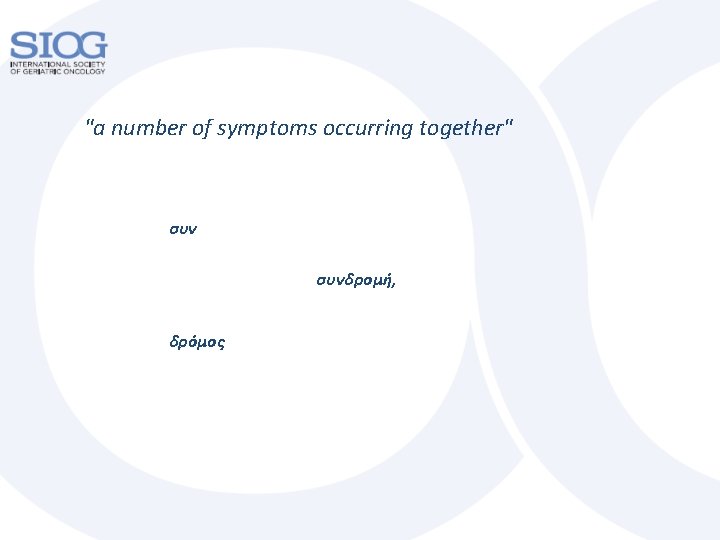
"a number of symptoms occurring together" συνδρομή, δρόμος
Using the term syndrome is somewhat misleading since this term is normally used to describe a pattern of symptoms and signs that have a single underlying cause. Geriatric syndromes, by contrast, refer to "multifactorial health conditions that occur when the accumulated effects of impairments in multiple systems render an older person vulnerable to situational challenges. ”
The term geriatric syndrome is used to capture clinical conditions that are - frequently encountered in older persons, - have a deleterious effect on function and quality of life, - have multifactorial pathophysiology, - often involving systems unrelated to the apparent chief complaint, and - are manifested by stereotypical clinical presentations.
Geriatric syndromes reflect the complex interactions between an individual's vulnerabilities and exposure to stressors or challenges.
Geriatric Syndromes • Cognitive impairment • Malnutrition • Mobility impairment & falls • Osteoporosis • Functional impairment • Incontinence • Sarcopenia • Frailty • Polypharmacy
Geriatric Syndromes • Older adults with cancer have more geriatric syndromes than older adults without cancer – Association of Cancer With Geriatric Syndromes in Older Medicare Beneficiaries. Mohile et al (2011) JCO.
Cognitive impairment • Mild Cognitive Impairment • Dementia • Delirium
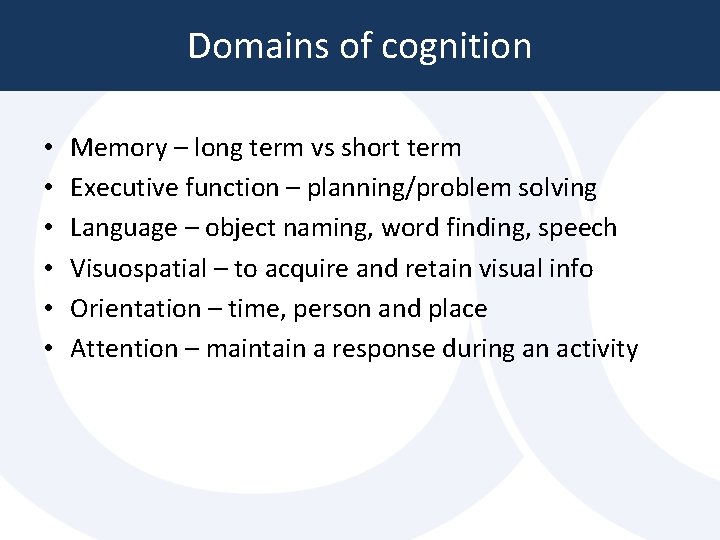
Domains of cognition • • • Memory – long term vs short term Executive function – planning/problem solving Language – object naming, word finding, speech Visuospatial – to acquire and retain visual info Orientation – time, person and place Attention – maintain a response during an activity
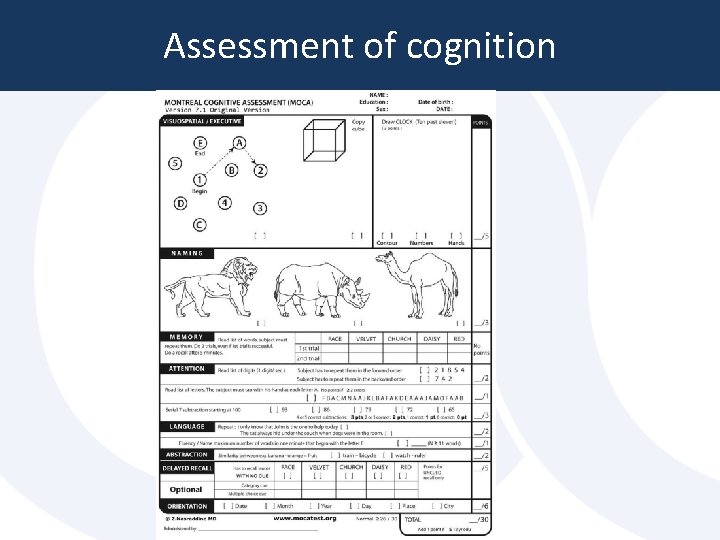
Assessment of cognition
Mild Cognitive Impairment • A slight but noticeable and measurable decline in cognitive abilities, including memory and thinking skills. • Not severe enough to interfere with daily function • A person with MCI is at an increased risk of developing Alzheimer's or another dementia.
Memory work-up • Thorough history AND collateral history • Assessment of function • Neuro exam • Evaluation of mood • Lab tests and brain imaging (CT or MRI) • Most of these are to rule out other causes
Dementia • Not one specific disease – a group term for many • Decline in memory or other thinking skills – At least two of these • Severe enough to reduce a person’s ability to perform everyday activities • Usually progressive – starts slowly, gets worse • Often ignored, or thought part of ageing, by family • Patients sometimes not aware
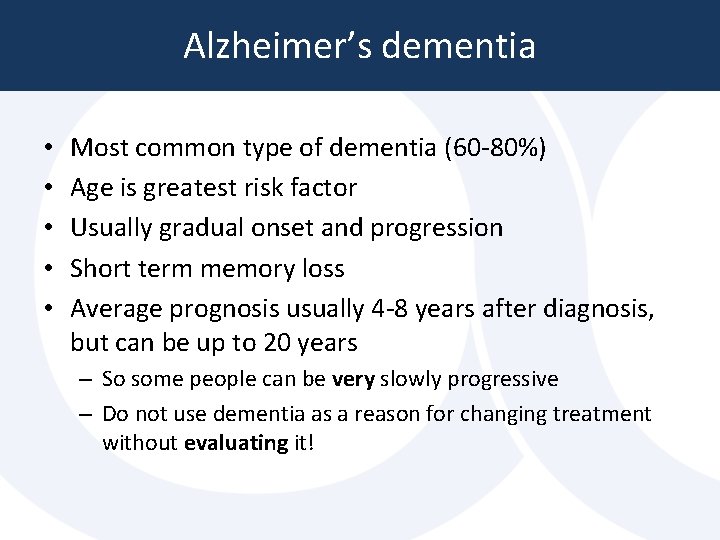
Alzheimer’s dementia • • • Most common type of dementia (60 -80%) Age is greatest risk factor Usually gradual onset and progression Short term memory loss Average prognosis usually 4 -8 years after diagnosis, but can be up to 20 years – So some people can be very slowly progressive – Do not use dementia as a reason for changing treatment without evaluating it!
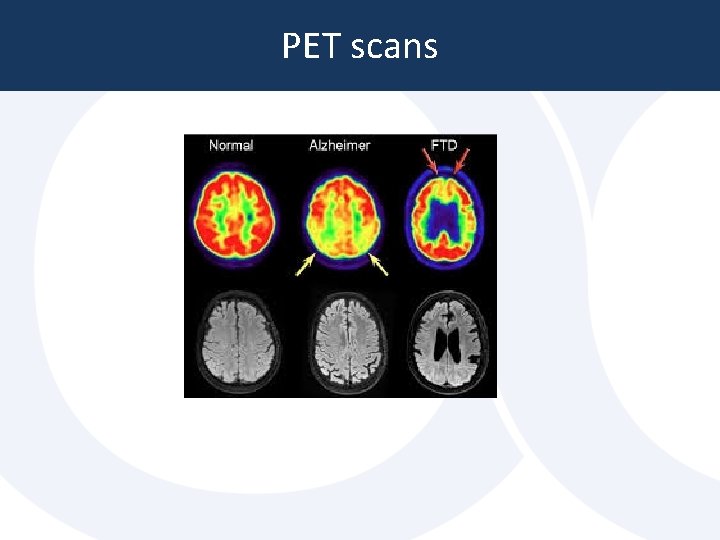
PET scans
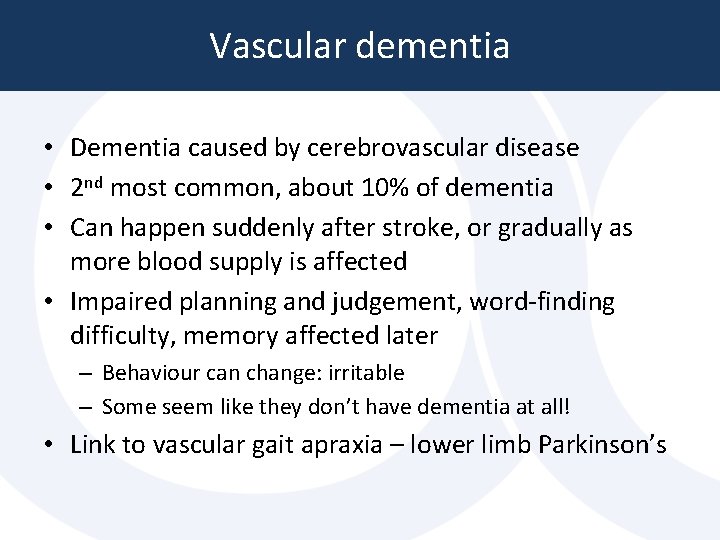
Vascular dementia • Dementia caused by cerebrovascular disease • 2 nd most common, about 10% of dementia • Can happen suddenly after stroke, or gradually as more blood supply is affected • Impaired planning and judgement, word-finding difficulty, memory affected later – Behaviour can change: irritable – Some seem like they don’t have dementia at all! • Link to vascular gait apraxia – lower limb Parkinson’s
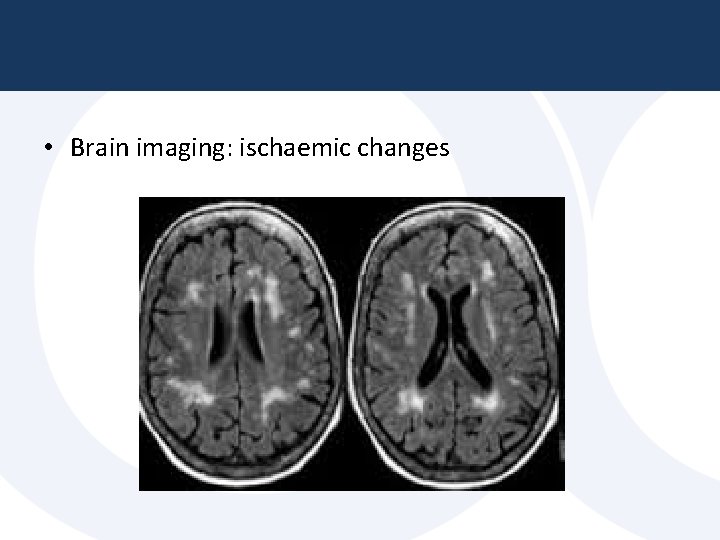
• Brain imaging: ischaemic changes
Signs of late dementia • Deepening confusion • Not recognising family members • Behaviour changes • Paranoid suspicions • Difficulty speaking, swallowing and walking
Can you treat it? • Some causes of memory loss are treatable – Hypothyroidism, depression, thiamine deficiency. . • Dementia itself – no cure or treatment • Medications that can temporarily improve symptoms – Acetylcholinesterase inhibitors (e. g. donepezil) – NMDA receptor agonist (e. g. memantine) • Also memory rehabilitation
Why diagnose it? • Trial of medication • Identification of risk factors that might be modified • Support • Advance care planning / prognosis
Modifying risk factors • Cardiovascular risk factors: blood pressure, cholesterol, diabetes, smoking, weight • Exercise: regular exercise lower the risk • Diet: Mediterranean diet – Little meat – Whole grains, fish, fruit and vegetables, nuts, olive oil
Decision-making capacity • Important to think about this in anyone with cognitive changes of any sort • Can they – – Understand… Analyse… Remember… Communicate the information about the decision • Remember it can fluctuate!
Delirium • Sudden onset confusion (or worsening) • Fluctuating course • Poor attention • Most common in people who have some type of cognitive impairment • A medical emergency!
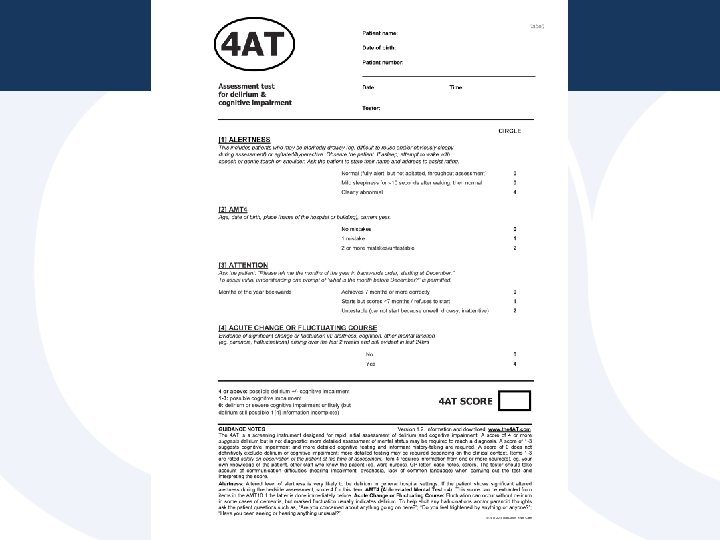
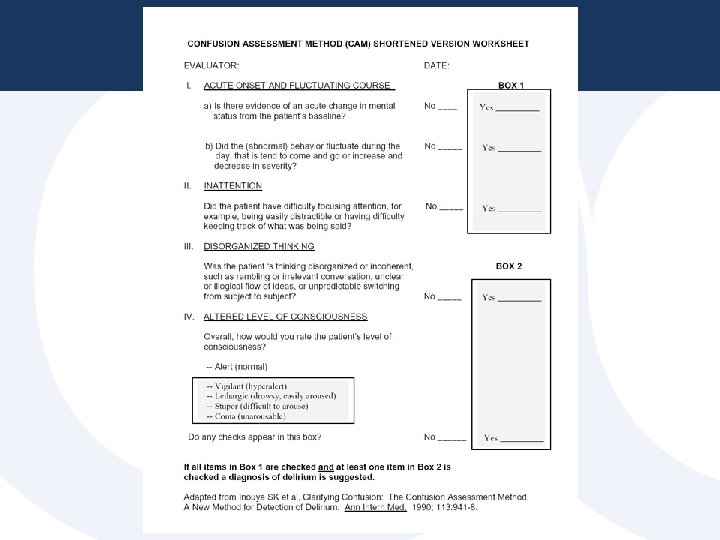
Screening or diagnosis • We miss up to 70% of delirium • So routine screening recommended, e. g. 4 AT • Diagnostic tool: CAM
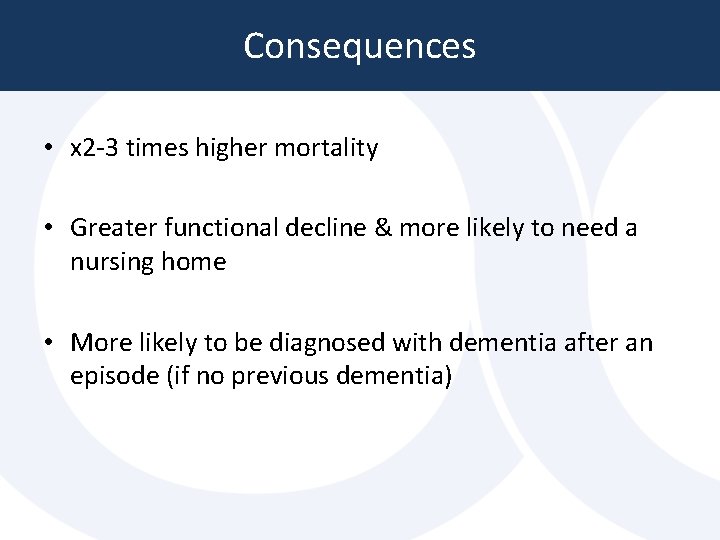
Consequences • x 2 -3 times higher mortality • Greater functional decline & more likely to need a nursing home • More likely to be diagnosed with dementia after an episode (if no previous dementia)
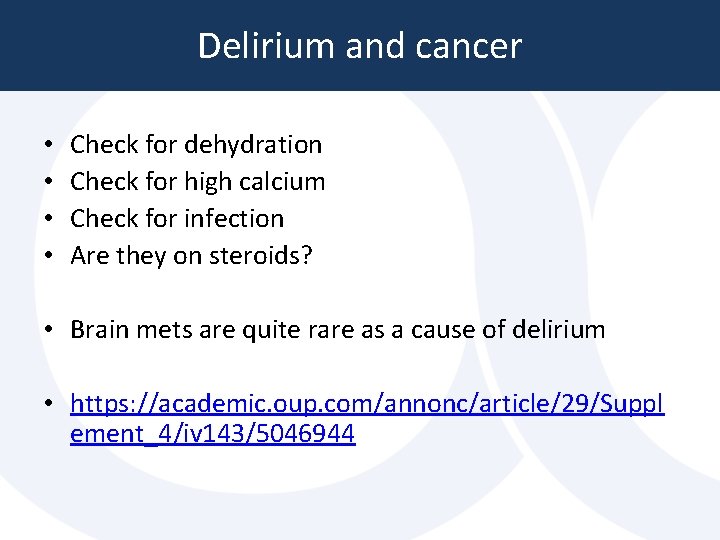
Delirium and cancer • • Check for dehydration Check for high calcium Check for infection Are they on steroids? • Brain mets are quite rare as a cause of delirium • https: //academic. oup. com/annonc/article/29/Suppl ement_4/iv 143/5046944
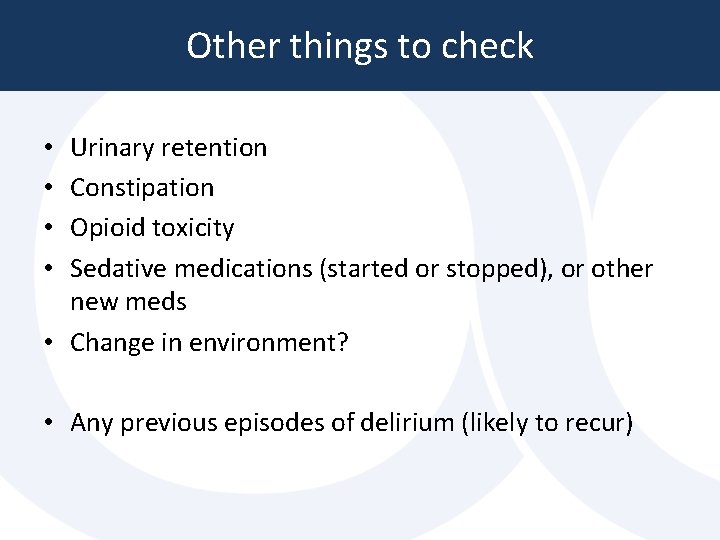
Other things to check Urinary retention Constipation Opioid toxicity Sedative medications (started or stopped), or other new meds • Change in environment? • • • Any previous episodes of delirium (likely to recur)
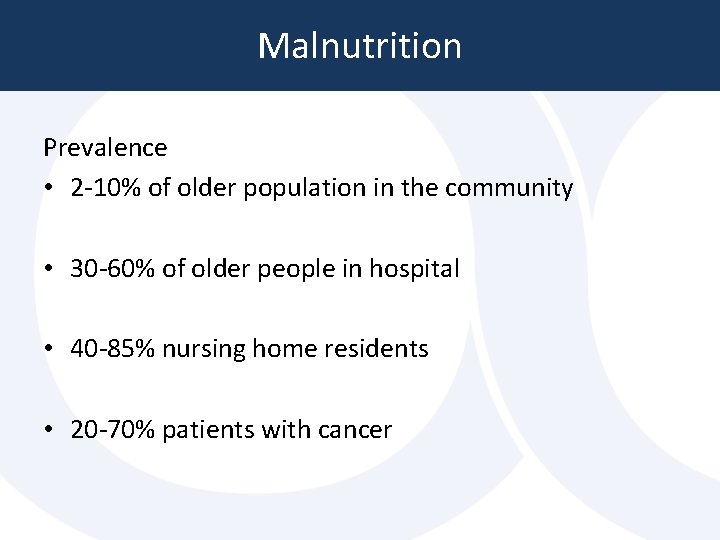
Malnutrition Prevalence • 2 -10% of older population in the community • 30 -60% of older people in hospital • 40 -85% nursing home residents • 20 -70% patients with cancer
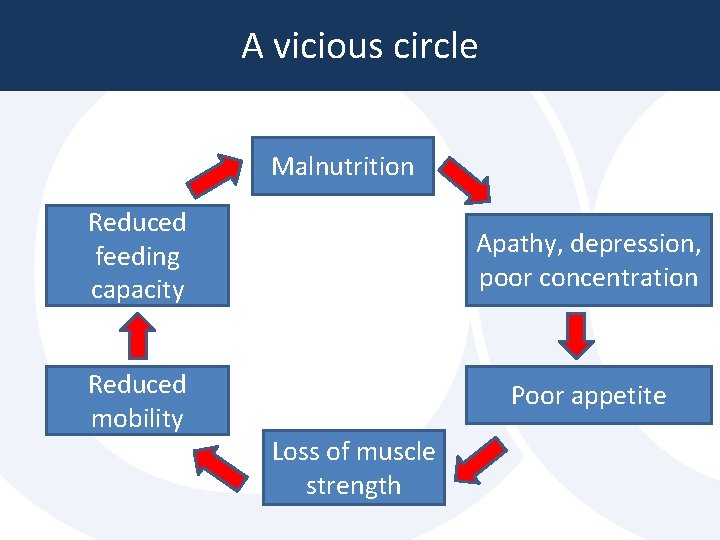
A vicious circle Malnutrition Reduced feeding capacity Apathy, depression, poor concentration Reduced mobility Poor appetite Loss of muscle strength
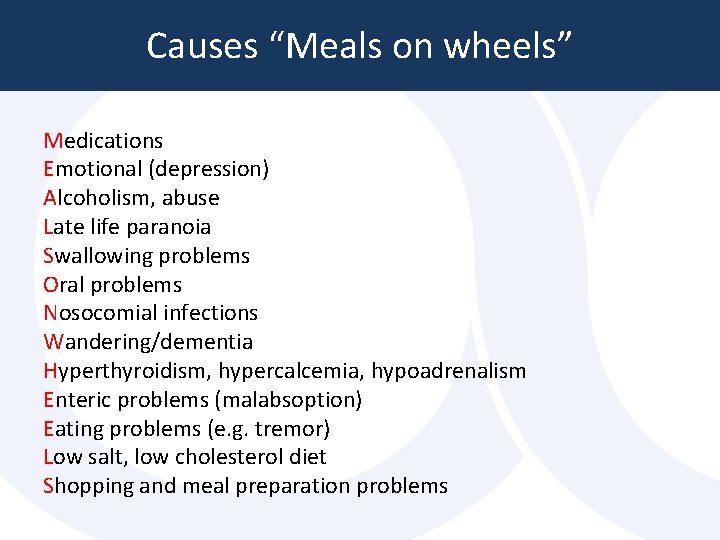
Causes “Meals on wheels” Medications Emotional (depression) Alcoholism, abuse Late life paranoia Swallowing problems Oral problems Nosocomial infections Wandering/dementia Hyperthyroidism, hypercalcemia, hypoadrenalism Enteric problems (malabsoption) Eating problems (e. g. tremor) Low salt, low cholesterol diet Shopping and meal preparation problems
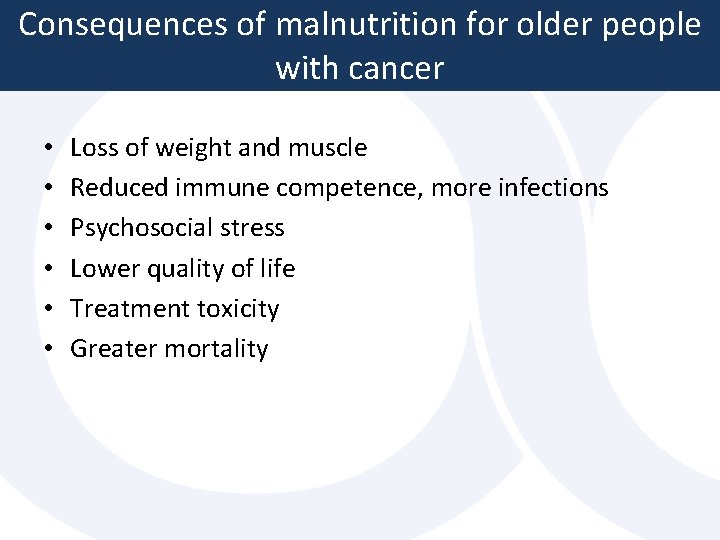
Consequences of malnutrition for older people with cancer • • • Loss of weight and muscle Reduced immune competence, more infections Psychosocial stress Lower quality of life Treatment toxicity Greater mortality
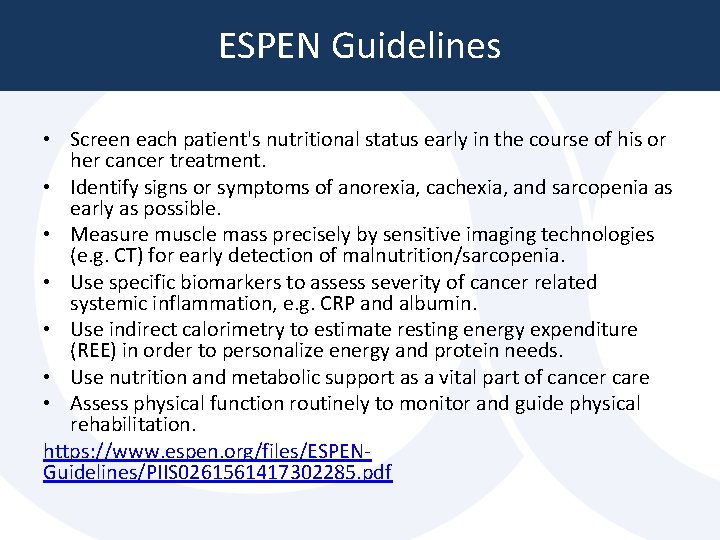
ESPEN Guidelines • Screen each patient's nutritional status early in the course of his or her cancer treatment. • Identify signs or symptoms of anorexia, cachexia, and sarcopenia as early as possible. • Measure muscle mass precisely by sensitive imaging technologies (e. g. CT) for early detection of malnutrition/sarcopenia. • Use specific biomarkers to assess severity of cancer related systemic inflammation, e. g. CRP and albumin. • Use indirect calorimetry to estimate resting energy expenditure (REE) in order to personalize energy and protein needs. • Use nutrition and metabolic support as a vital part of cancer care • Assess physical function routinely to monitor and guide physical rehabilitation. https: //www. espen. org/files/ESPENGuidelines/PIIS 0261561417302285. pdf
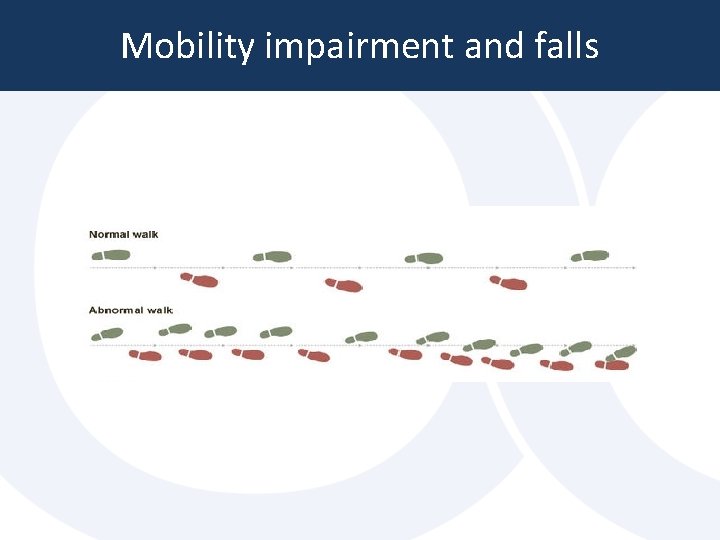
Mobility impairment and falls
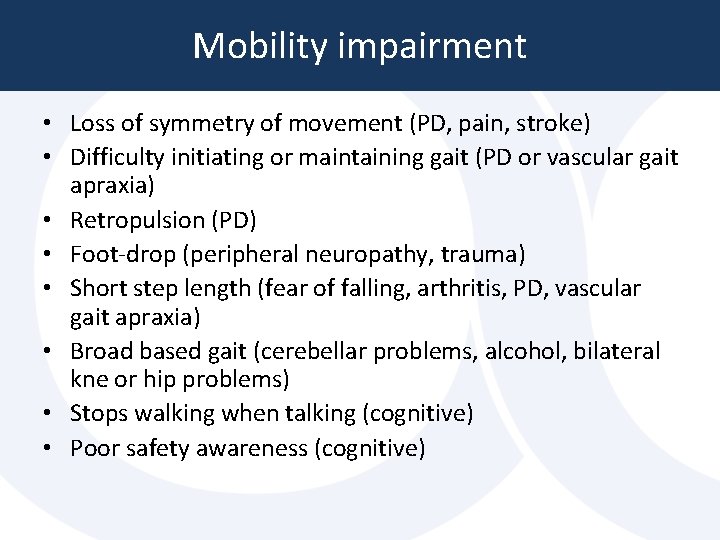
Mobility impairment • Loss of symmetry of movement (PD, pain, stroke) • Difficulty initiating or maintaining gait (PD or vascular gait apraxia) • Retropulsion (PD) • Foot-drop (peripheral neuropathy, trauma) • Short step length (fear of falling, arthritis, PD, vascular gait apraxia) • Broad based gait (cerebellar problems, alcohol, bilateral kne or hip problems) • Stops walking when talking (cognitive) • Poor safety awareness (cognitive)
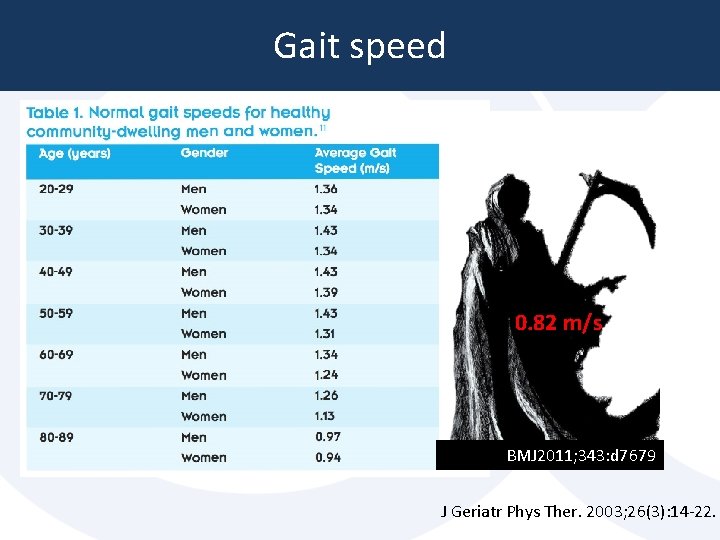
Gait speed 0. 82 m/s BMJ 2011; 343: d 7679 J Geriatr Phys Ther. 2003; 26(3): 14 -22.
Falls • Yearly, 1 in 3 adults over 65 years falls • In nursing homes, 1 in 2 • In 40% to 60% of older people, a fall results in physical damage, of which 10 -15% serious damage
Medical risk factors • Impaired musculoskeletal function, osteoporosis, gait abnormality • Cardiac arrythmias, blood pressure fluctuation • Depression, dementia • Arthritis, hip weakness and imbalance • Neurologic disorders • Vision or hearing loss • Side effect of medications
Other risk factors • • Lack of activity Intoxication Dehydration Malnutrition • Shoes and walking aids • Risk factors at home
How to assess falls • History gives diagnosis in most cases • Was there a prodrome (dizziness, chest pain)? • Did you lose consciousness? • Were there any injuries? • Can you get up by yourself? • Have you fallen before?
Common causes in older people • Orthostatic hypotension (too many blood pressure meds? Dehydration? Recent illness? Parkinson’s? ) – Also check for aortic stenosis • Osteoarthritis – stiffness, pain in joints affecting mobility • Medications – almost every one increases risk! • Cognition – poor safety awareness • Less common: arrhythmia, seizure, Parkinson’s, stroke
How to reduce falls • Multicomponent intervention • Otago exercise programme (reduces risk of falls & fall -related injuries and death, improves QOL – but not bone mineral density)
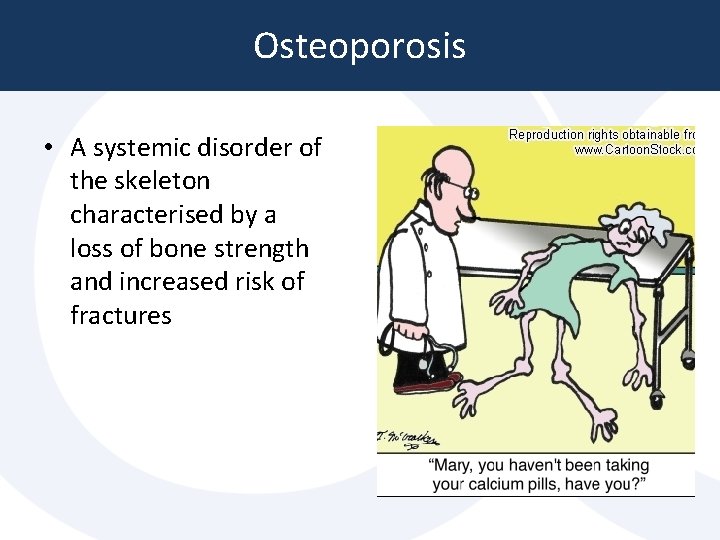
Osteoporosis • A systemic disorder of the skeleton characterised by a loss of bone strength and increased risk of fractures
Epidemiology • Worldwide: 200 million people • European Union: 22 million women and 5. 5 million men • United States: 8 million women and 2 million men • Effect: 1: 3 women and 1: 5 over the age of 50 years will have one or more osteoporotic fractures in their lifetime
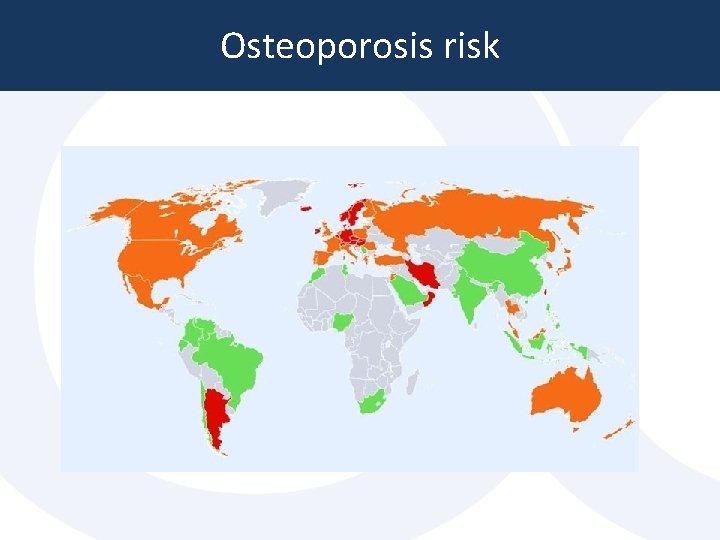
Osteoporosis risk
Diagnosis of osteoporosis • DEXA scan • But if fragility fracture in older adult, treat as osteoporosis • Can also use FRAX score as a risk assessment tool – gives estimated risk of osteoporosis related fracture in the next 10 years
Causes of osteoporosis • • • Decreased mechanical stress Weight loss Catabolic state Chronic inflammation Medication
Cancer related causes • • • Steroid therapy Aromatase inhibitors Androgen deprivation therapy Chemotherapy – impact on ovaries Oophorectomy • Primary bone cancer or mets increase fracture risk
Sequelae of a hip fracture • 25 -33% mortality after 1 year • In those >75 years: 50% mortality • 25% permanent immobility • Only 14 -21% full recover of ADL capacity
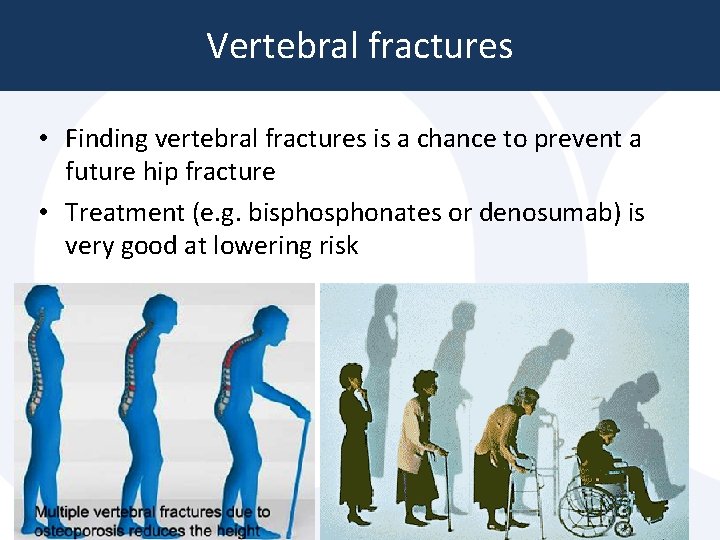
Vertebral fractures • Finding vertebral fractures is a chance to prevent a future hip fracture • Treatment (e. g. bisphonates or denosumab) is very good at lowering risk
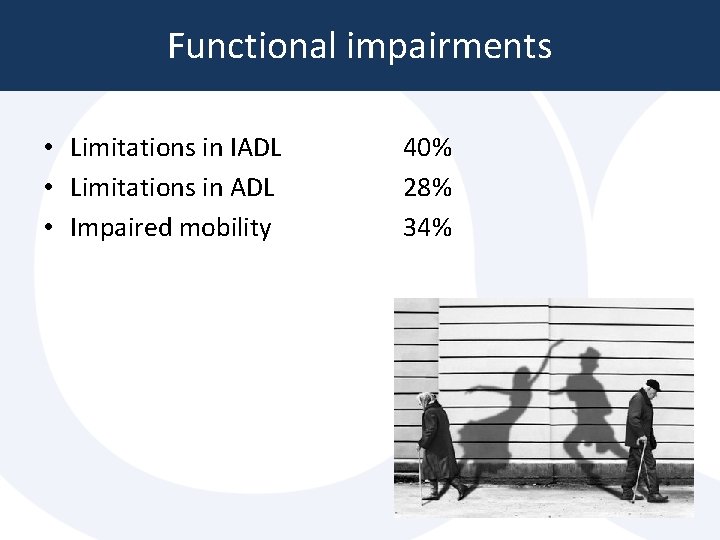
Functional impairments • Limitations in IADL • Limitations in ADL • Impaired mobility 40% 28% 34%
Functional impairment + cancer • Very little research • Huge variation across cancer types, whether treated, whether during treatment or after • Many treatments will affect function, and it may be a reason to stop treatment • Functional impairment may be worse than shorter survival with good QOL
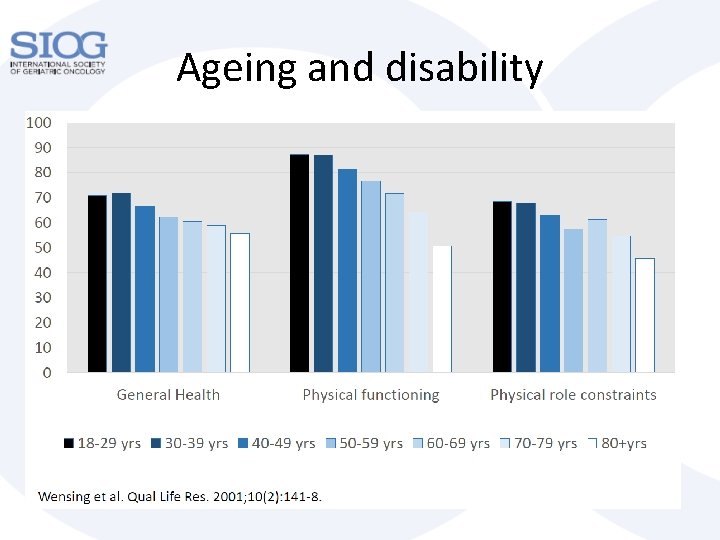
Ageing and disability
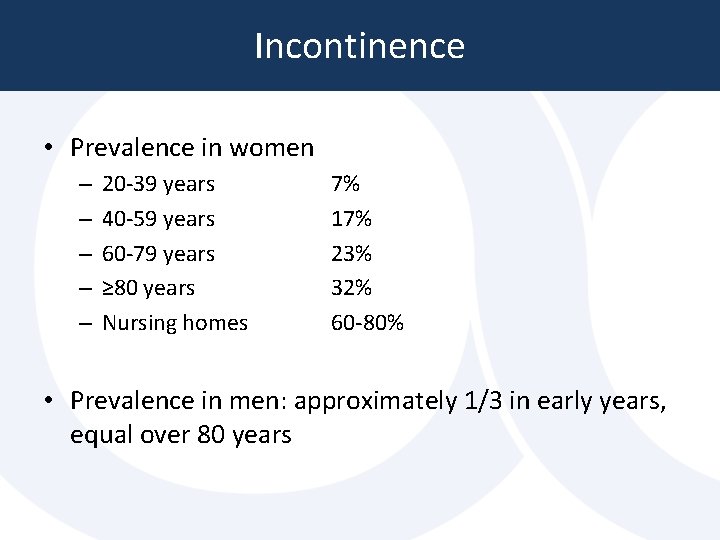
Incontinence • Prevalence in women – – – 20 -39 years 40 -59 years 60 -79 years ≥ 80 years Nursing homes 7% 17% 23% 32% 60 -80% • Prevalence in men: approximately 1/3 in early years, equal over 80 years
Aetiology • Changes in the lower urinary tract and innervation • Patient level – Comorbidities – Medication: diuretics, antihypertensives – Functional and mobility impairments • NOBODY ever asks patients about this! • But it has a huge impact on Qo. L
Management Find out the cause: stress vs urge Reduce caffeine, regular toileting Ensure no constipation Medications: anticholinergics (but can cause confusion, dry mouth, constipation…) • Incontinence-wear if necessary • Sometimes a catheter • Surgery • •
Consequences • • Impact on self-esteem Social withdrawal Falls risk Caregiver burden
Care giver burden • 44% care givers for older cancer patients say that the burden of care is too great • In many cases, the caregiver is required to make oncologic treatment feasible!
Musculoskeletal Aging, Sarcopenia
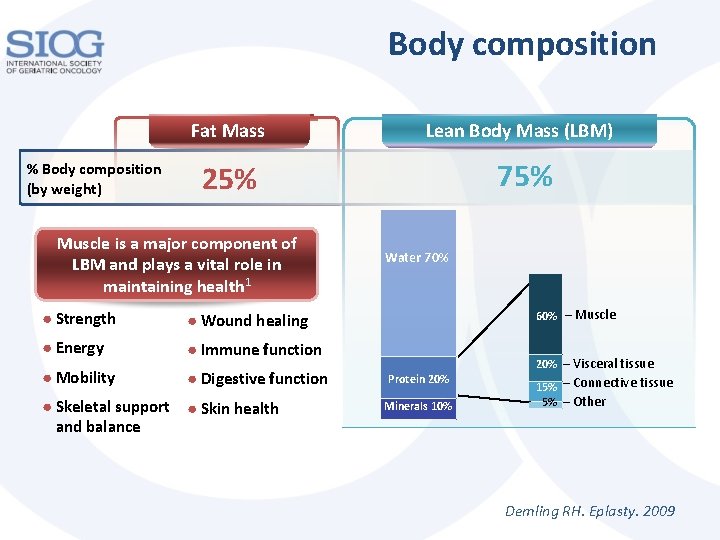
Body composition % Body composition (by weight) Fat Mass Lean Body Mass (LBM) 25% 75% Muscle is a major component of LBM and plays a vital role in maintaining health 1 ● Strength ● Wound healing ● Energy ● Immune function ● Mobility ● Digestive function ● Skeletal support ● Skin health and balance Water 70% 60% – Muscle Protein 20% Minerals 10% 20% – Visceral tissue 15% – Connective tissue 5% – Other Demling RH. Eplasty. 2009
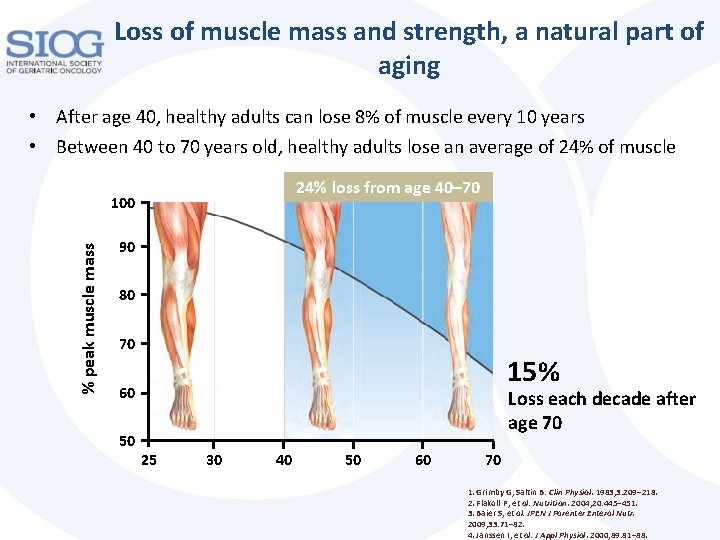
Loss of muscle mass and strength, a natural part of aging • After age 40, healthy adults can lose 8% of muscle every 10 years • Between 40 to 70 years old, healthy adults lose an average of 24% of muscle 24% loss from age 40– 70 % peak muscle mass 100 90 80 70 15% 60 50 Loss each decade after age 70 25 30 40 50 60 70 1. Grimby G, Saltin B. Clin Physiol. 1983; 3: 209– 218. 2. Flakoll P, et al. Nutrition. 2004; 20: 445– 451. 3. Baier S, et al. JPEN J Parenter Enteral Nutr. 2009; 33: 71– 82. 4. Janssen I, et al. J Appl Physiol. 2000; 89: 81– 88.
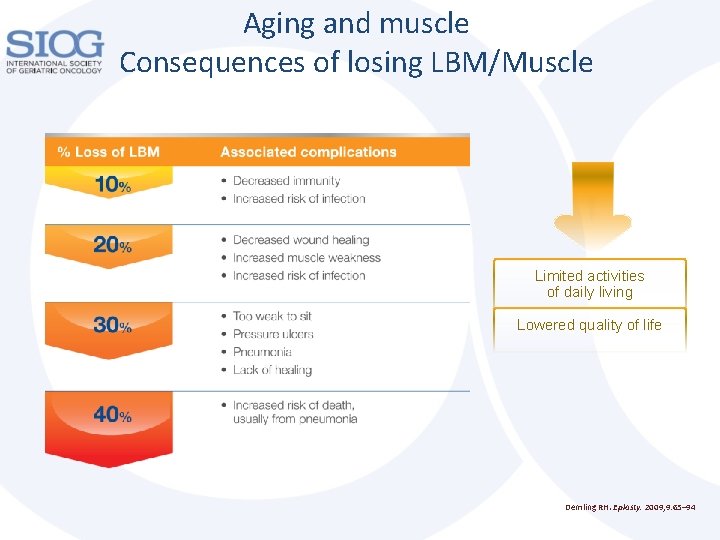
Aging and muscle Consequences of losing LBM/Muscle Limited activities of daily living Lowered quality of life Demling RH. Eplasty. 2009; 9: 65– 94
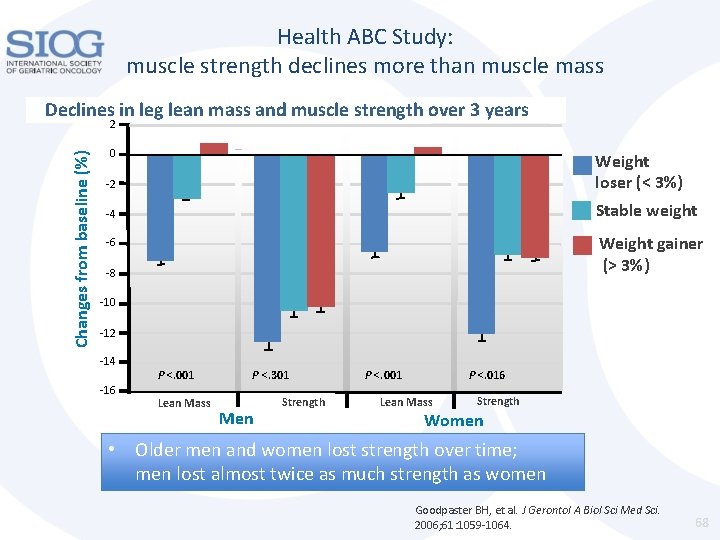
Health ABC Study: muscle strength declines more than muscle mass Declines in leg lean mass and muscle strength over 3 years Changes from baseline (%) 2 0 -2 Weight loser (< 3%) -4 Stable weight Weight gainer (> 3%) -6 -8 -10 -12 -14 -16 P <. 001 Lean Mass P <. 301 Men Strength P <. 001 P <. 016 Lean Mass Strength Women • Older men and women lost strength over time; men lost almost twice as much strength as women Goodpaster BH, et al. J Gerontol A Biol Sci Med Sci. 2006; 61: 1059 -1064. 68
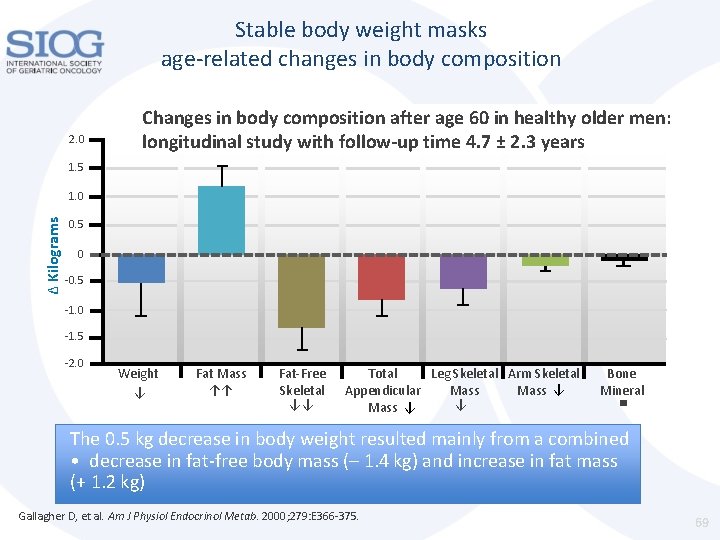
Stable body weight masks age-related changes in body composition 2. 0 Changes in body composition after age 60 in healthy older men: longitudinal study with follow-up time 4. 7 ± 2. 3 years 1. 5 ∆ Kilograms 1. 0 0. 5 0 -0. 5 -1. 0 -1. 5 -2. 0 Weight ↓ Fat Mass ↑↑ Fat-Free Skeletal ↓↓ Total Leg Skeletal Arm Skeletal Bone Mass ↓ Appendicular Mass Mineral ↓ Mass ↓ The 0. 5 kg decrease in body weight resulted mainly from a combined • decrease in fat-free body mass (– 1. 4 kg) and increase in fat mass (+ 1. 2 kg) Gallagher D, et al. Am J Physiol Endocrinol Metab. 2000; 279: E 366 -375. 69
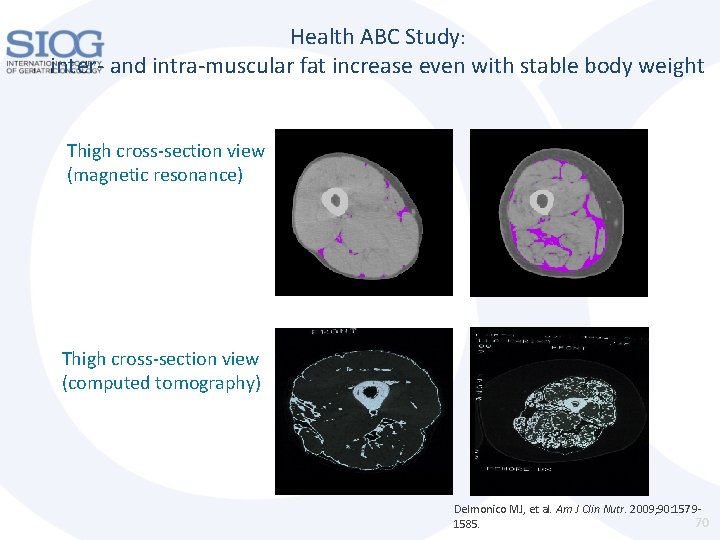
Health ABC Study: inter- and intra-muscular fat increase even with stable body weight Thigh cross-section view (magnetic resonance) Thigh cross-section view (computed tomography) Delmonico MJ, et al. Am J Clin Nutr. 2009; 90: 157970 1585.
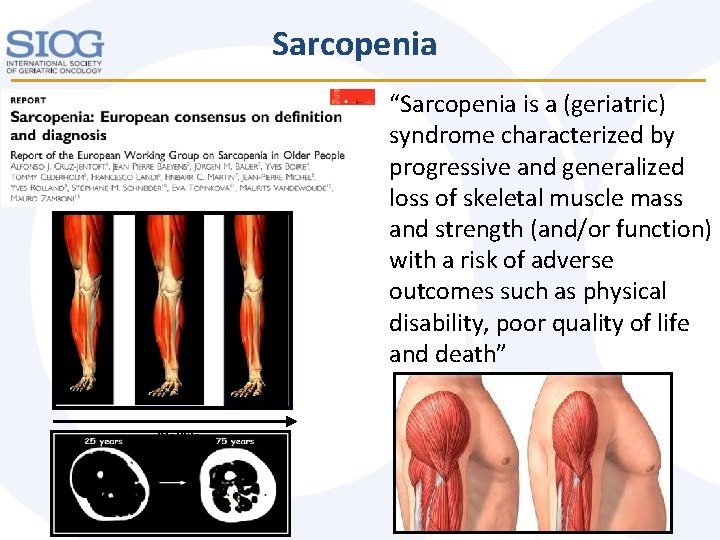
Sarcopenia “Sarcopenia is a (geriatric) syndrome characterized by progressive and generalized loss of skeletal muscle mass and strength (and/or function) with a risk of adverse outcomes such as physical disability, poor quality of life and death” AGING
European consensus definition of sarcopenia (EWGSOP*) Criteria for the diagnosis of sarcopenia 1. LOW MUSCLE MASS 2. LOW MUSCLE STRENGTH SARCOPENIA OR 3. LOW PHYSICAL PERFORMANCE • A syndrome characterized by progressive and generalized loss of skeletal muscle mass and function with a risk of adverse outcomes, such as physical disability, poor quality of life, and death *European Working Group on Sarcopenia in Older Persons Ageing. 72 2010; 39: 412 -423.
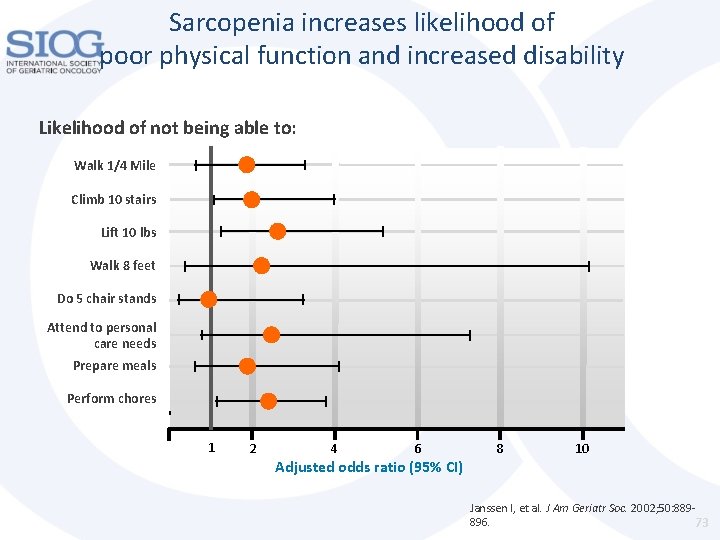
Sarcopenia increases likelihood of poor physical function and increased disability Likelihood of not being able to: Walk 1/4 Mile Climb 10 stairs Lift 10 lbs Walk 8 feet Do 5 chair stands Attend to personal care needs Prepare meals Perform chores 1 2 4 6 Adjusted odds ratio (95% CI) 8 10 Janssen I, et al. J Am Geriatr Soc. 2002; 50: 889896. 73
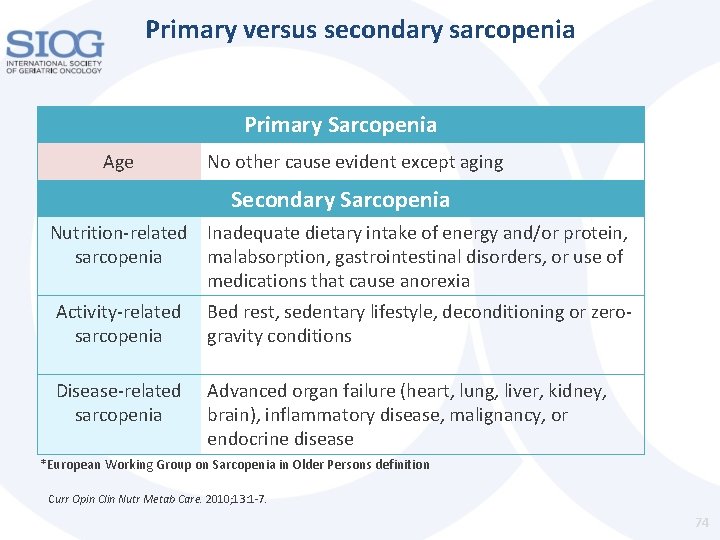
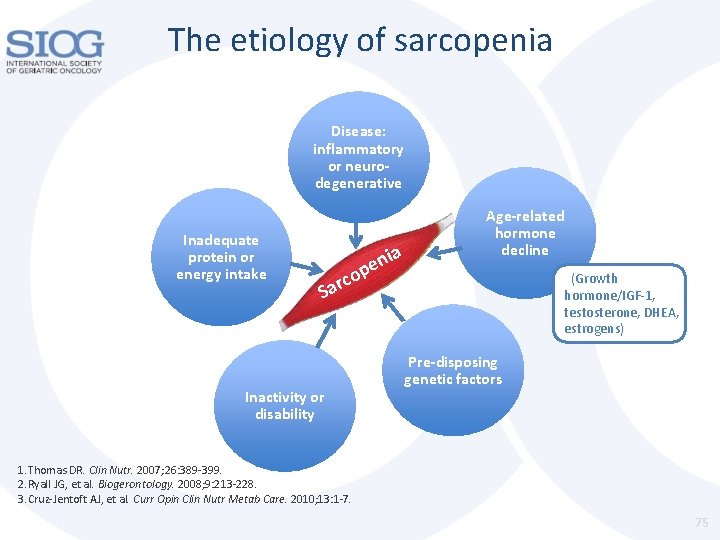
Primary versus secondary sarcopenia Primary Sarcopenia Age No other cause evident except aging Secondary Sarcopenia Nutrition-related Inadequate dietary intake of energy and/or protein, sarcopenia malabsorption, gastrointestinal disorders, or use of medications that cause anorexia Activity-related sarcopenia Bed rest, sedentary lifestyle, deconditioning or zerogravity conditions Disease-related sarcopenia Advanced organ failure (heart, lung, liver, kidney, brain), inflammatory disease, malignancy, or endocrine disease *European Working Group on Sarcopenia in Older Persons definition Curr Opin Clin Nutr Metab Care. 2010; 13: 1 -7. 74
The etiology of sarcopenia Disease: inflammatory or neurodegenerative Inadequate protein or energy intake op c r Sa ia n e Inactivity or disability Age-related hormone decline (Growth hormone/IGF-1, testosterone, DHEA, estrogens) Pre-disposing genetic factors 1. Thomas DR. Clin Nutr. 2007; 26: 389 -399. 2. Ryall JG, et al. Biogerontology. 2008; 9: 213 -228. 3. Cruz-Jentoft AJ, et al. Curr Opin Clin Nutr Metab Care. 2010; 13: 1 -7. 75
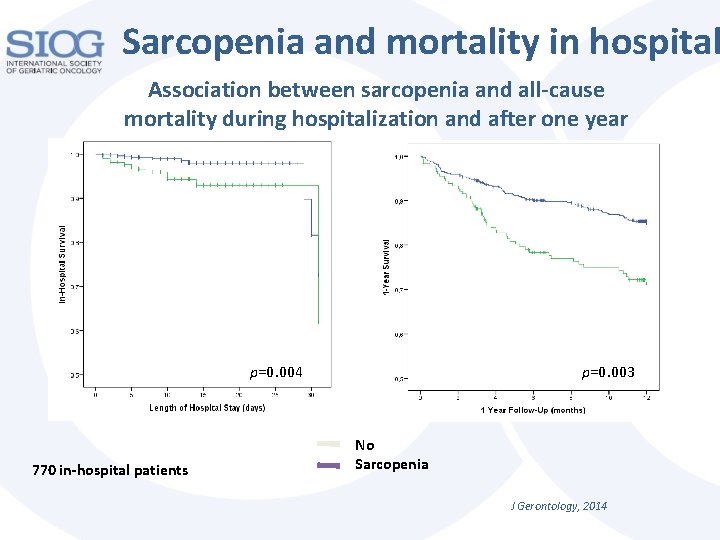
Sarcopenia and mortality in hospital Association between sarcopenia and all-cause mortality during hospitalization and after one year p=0. 004 770 in-hospital patients p=0. 003 No Sarcopenia J Gerontology, 2014
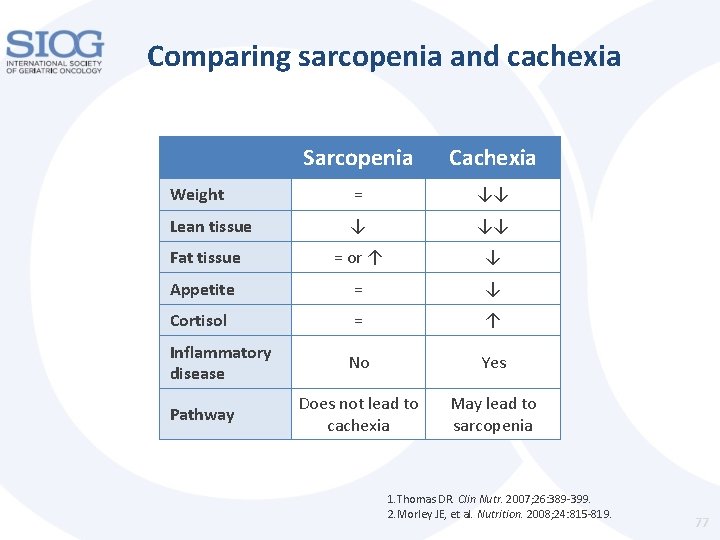
Comparing sarcopenia and cachexia Sarcopenia Cachexia Weight = ↓↓ Lean tissue ↓ ↓↓ Fat tissue = or ↑ ↓ Appetite = ↓ Cortisol = ↑ No Yes Does not lead to cachexia May lead to sarcopenia Inflammatory disease Pathway 1. Thomas DR. Clin Nutr. 2007; 26: 389 -399. 2. Morley JE, et al. Nutrition. 2008; 24: 815 -819. 77
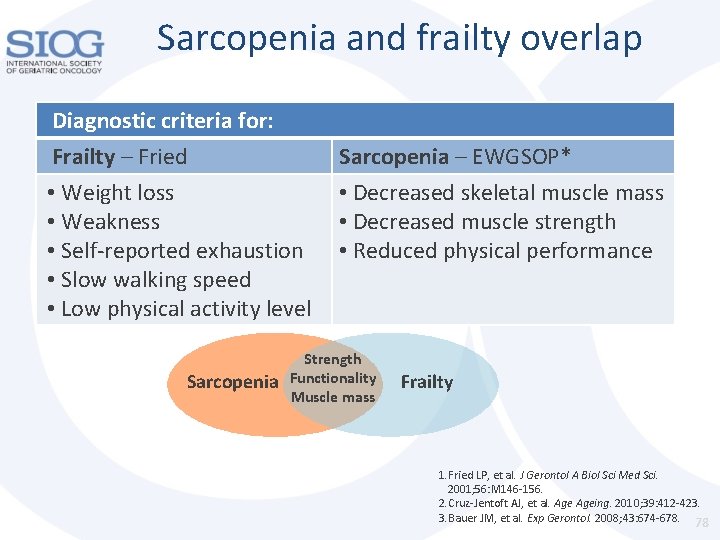
Sarcopenia and frailty overlap Diagnostic criteria for: Frailty – Fried • Weight loss • Weakness • Self-reported exhaustion • Slow walking speed • Low physical activity level Sarcopenia – EWGSOP* • Decreased skeletal muscle mass • Decreased muscle strength • Reduced physical performance Strength Functionality Muscle mass Frailty 1. Fried LP, et al. J Gerontol A Biol Sci Med Sci. 2001; 56: M 146 -156. 2. Cruz-Jentoft AJ, et al. Ageing. 2010; 39: 412 -423. 3. Bauer JM, et al. Exp Gerontol. 2008; 43: 674 -678. 78
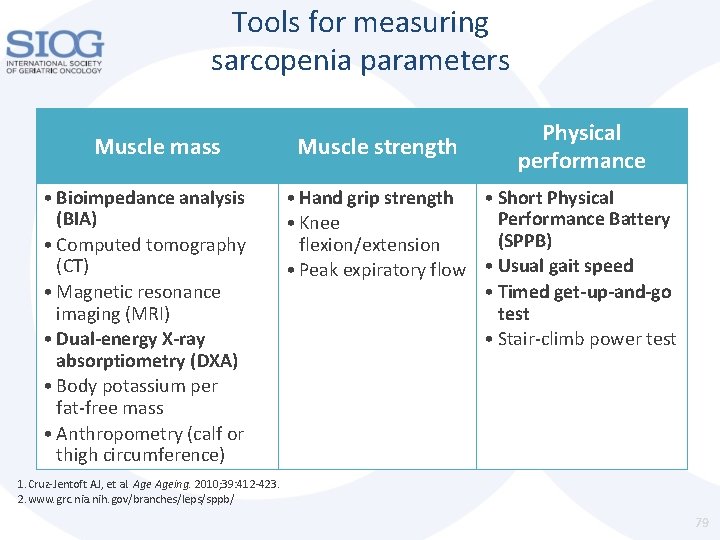
Tools for measuring sarcopenia parameters Muscle mass • Bioimpedance analysis (BIA) • Computed tomography (CT) • Magnetic resonance imaging (MRI) • Dual-energy X-ray absorptiometry (DXA) • Body potassium per fat-free mass • Anthropometry (calf or thigh circumference) Muscle strength Physical performance • Hand grip strength • Short Physical Performance Battery • Knee (SPPB) flexion/extension • Peak expiratory flow • Usual gait speed • Timed get-up-and-go test • Stair-climb power test 1. Cruz-Jentoft AJ, et al. Ageing. 2010; 39: 412 -423. 2. www. grc. nia. nih. gov/branches/leps/sppb/ 79
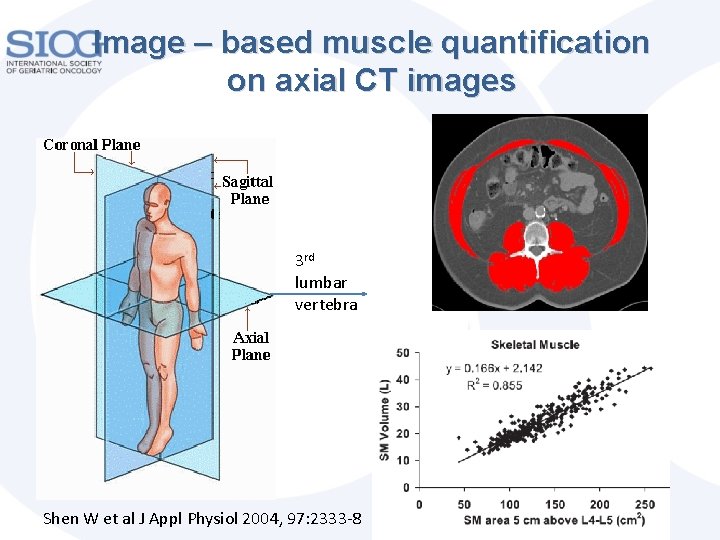
Image – based muscle quantification on axial CT images 3 rd lumbar vertebra Shen W et al J Appl Physiol 2004, 97: 2333 -8
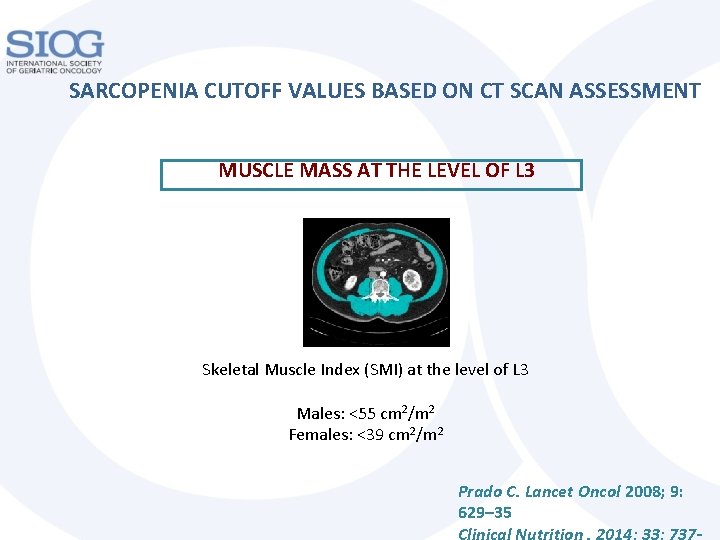
SARCOPENIA CUTOFF VALUES BASED ON CT SCAN ASSESSMENT MUSCLE MASS AT THE LEVEL OF L 3 Skeletal Muscle Index (SMI) at the level of L 3 Males: <55 cm 2/m 2 Females: <39 cm 2/m 2 Prado C. Lancet Oncol 2008; 9: 629– 35 Clinical Nutrition. 2014; 33: 737 -
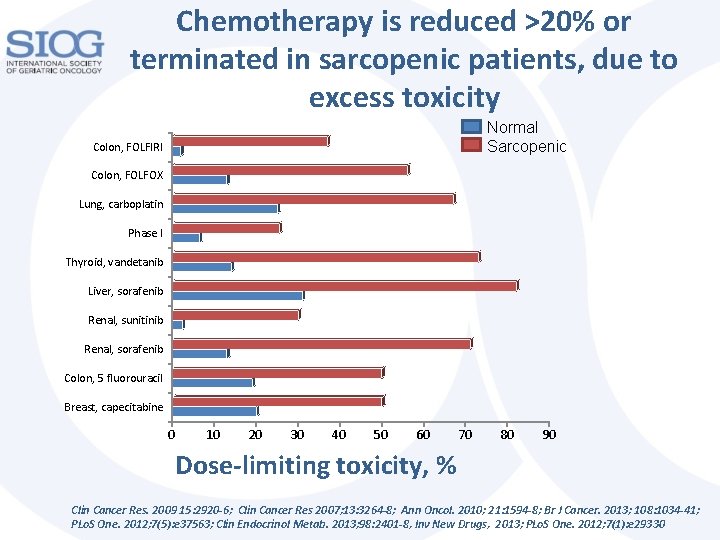
Chemotherapy is reduced >20% or terminated in sarcopenic patients, due to excess toxicity Normal Sarcopenic Colon, FOLFIRI Colon, FOLFOX Lung, carboplatin Phase I Thyroid, vandetanib Liver, sorafenib Renal, sunitinib Renal, sorafenib Colon, 5 fluorouracil Breast, capecitabine 0 10 20 30 40 50 60 70 80 90 Dose-limiting toxicity, % Clin Cancer Res. 2009 15: 2920 -6; Clin Cancer Res 2007; 13: 3264 -8; Ann Oncol. 2010; 21: 1594 -8; Br J Cancer. 2013; 108: 1034 -41; PLo. S One. 2012; 7(5): e 37563; Clin Endocrinol Metab. 2013; 98: 2401 -8, Inv New Drugs, 2013; PLo. S One. 2012; 7(1): e 29330
Take home message • Many geriatric syndromes interact and amplify each other • Geriatric syndromes and functional impairments are highly prevalent and easily missed if not specifically looked for • The presence of geriatric syndromes reflects a patient’s fitness/vulnerability which has significant consequences for oncologic treatment