
GEOTHERMAL DISTRICT HEATING COUPLED WITH AN ORC PLANT




- Slides: 42
GEOTHERMAL DISTRICT HEATING COUPLED WITH AN ORC PLANT Prof Dr Pall Valdimarsson Atlas Copco Geothermal Competence Center and Reykjavik University
COMMITTED TO SUSTAINABLE PRODUCTIVITY We stand by our responsibilities towards our customers, towards the environment and the people around us. We make performance stand the test of time. This is what we call – Sustainable Productivity.
1. ATLAS COPCO Facts in Brief Established 1873 in Stockholm, Sweden Four focused business areas § § Global presence Customers in more than 180 countries Employees 40 200 in 90 countries Annual revenues 2013 BSEK 84 (BEUR 9. 7) Compressor Technique Industrial Technique Mining and Rock Excavation Technique Construction Technique
CONCLUSION § Geothermal district heating is different from fuel heated district heating § Geothermal power production is base load (maximum power all the time) § District heating has an outdoor temperature governed duration curve § District heating has always preference to generation of electricity (blood vs money) § The exergy available from the wells is finite and constant § The exergy used by the district heating system cannot be converted to electrical power § => the exergy consumption of the district heating has to be minimized § => it is important that the connection between power plant and district heating does not waste exergy § Home sweet home – a few words on the Icelandic experience
DON’T FORGET § Iceland was a poor third world country 60 years ago § Direct use of geothermal heat is one of the major factors in our transition to the 20 th century!
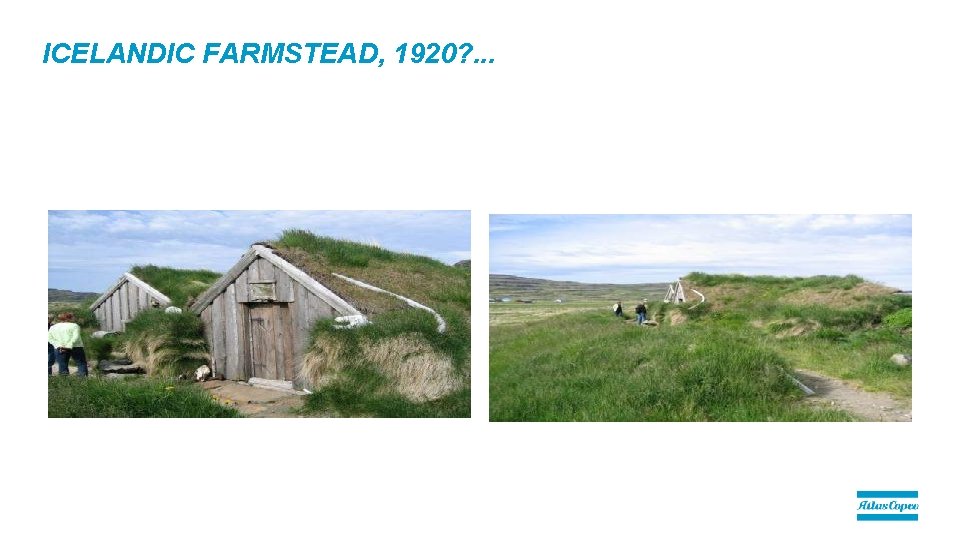
ICELANDIC FARMSTEAD, 1920? . . .
GEOTHERMAL UTILIZATION § Production of electrical power – Steam cycles – Binary cycles § Direct use – District heating – Agriculture – Aquaculture § A chain from well to the final product – – – Process Component Value Energy Exergy § All elements in this chain are equally important, from the geothermal well over to the building radiators, and they all have to be designed with utmost care – -- and that includes the building system and its radiators!!
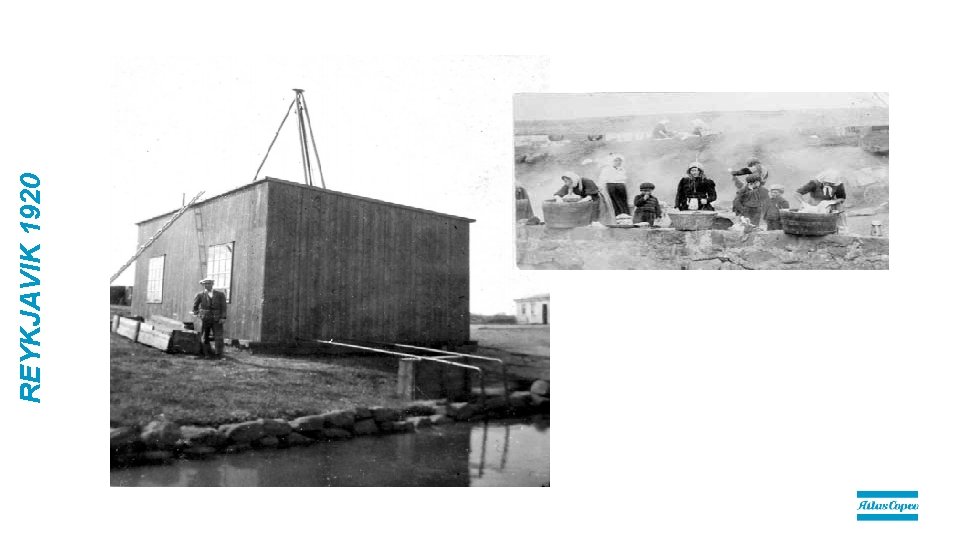
REYKJAVIK 1920
DISTRICT HEATING § Heat extracted in order to supply heat to a district heating system from a power plant will reduce its power generation ability § Geothermal district heating is heating around 90% of all buildings in Iceland § These systems are efficient, and over 80 years of operating experience have given a large knowledge base on the operation and economics on such systems § Most of the Icelandic geothermal fields used for district heating have a temperature around 80°C § Standard system supply temperature is 80°C, constant regardless of the load § Load variations are accounted for by variation in the system flow § Rather generous pipe diameters, resulting in high temperature loss during low load.
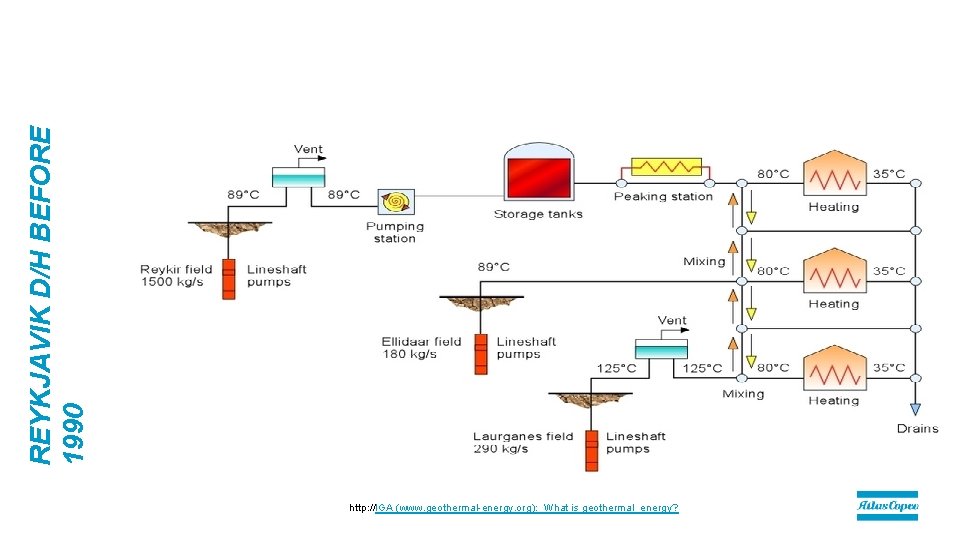
REYKJAVIK D/H BEFORE 1990 http: //IGA (www. geothermal-energy. org): What is geothermal_energy?
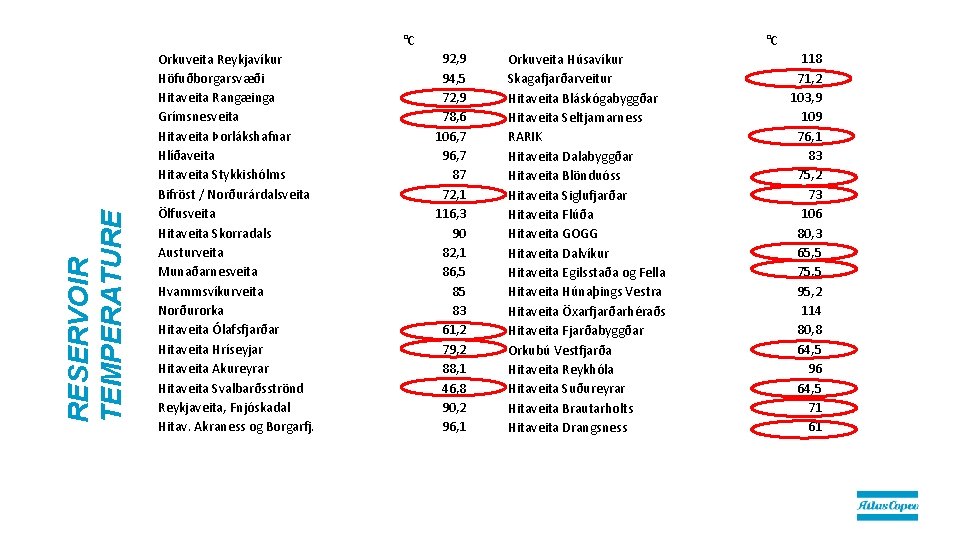
RESERVOIR TEMPERATURE °C Orkuveita Reykjavíkur Höfuðborgarsvæði Hitaveita Rangæinga Grímsnesveita Hitaveita Þorlákshafnar Hlíðaveita Hitaveita Stykkishólms Bifröst / Norðurárdalsveita Ölfusveita Hitaveita Skorradals Austurveita Munaðarnesveita Hvammsvíkurveita Norðurorka Hitaveita Ólafsfjarðar Hitaveita Hríseyjar Hitaveita Akureyrar Hitaveita Svalbarðsströnd Reykjaveita, Fnjóskadal Hitav. Akraness og Borgarfj. °C 92, 9 94, 5 72, 9 78, 6 106, 7 96, 7 87 72, 1 116, 3 90 82, 1 86, 5 85 83 61, 2 79, 2 88, 1 46, 8 90, 2 96, 1 Orkuveita Húsavíkur Skagafjarðarveitur Hitaveita Bláskógabyggðar Hitaveita Seltjarnarness RARIK Hitaveita Dalabyggðar Hitaveita Blönduóss Hitaveita Siglufjarðar Hitaveita Flúða Hitaveita GOGG Hitaveita Dalvíkur Hitaveita Egilsstaða og Fella Hitaveita Húnaþings Vestra Hitaveita Öxarfjarðarhéraðs Hitaveita Fjarðabyggðar Orkubú Vestfjarða Hitaveita Reykhóla Hitaveita Suðureyrar Hitaveita Brautarholts Hitaveita Drangsness 118 71, 2 103, 9 109 76, 1 83 75, 2 73 106 80, 3 65, 5 75, 5 95, 2 114 80, 8 64, 5 96 64, 5 71 61
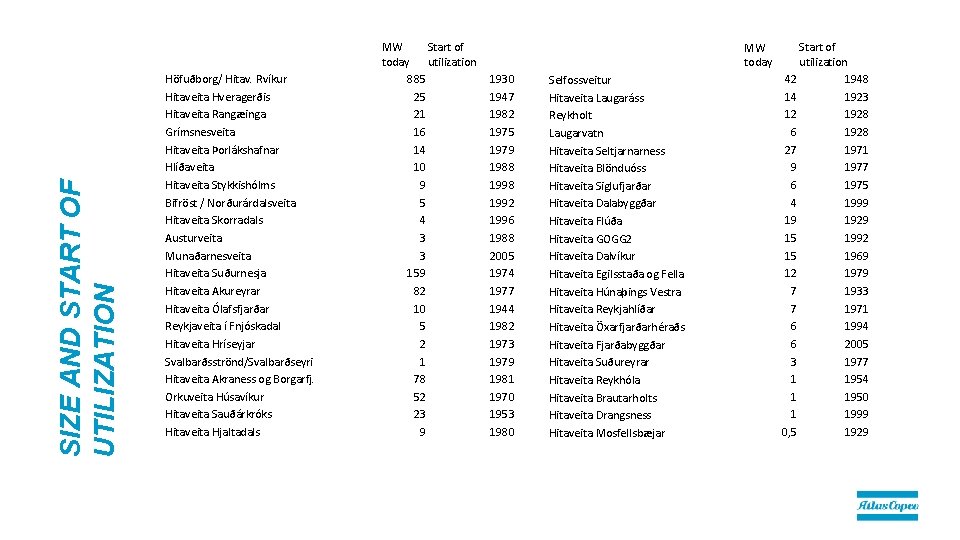
SIZE AND START OF UTILIZATION Höfuðborg/ Hitav. Rvíkur Hitaveita Hveragerðis Hitaveita Rangæinga Grímsnesveita Hitaveita Þorlákshafnar Hlíðaveita Hitaveita Stykkishólms Bifröst / Norðurárdalsveita Hitaveita Skorradals Austurveita Munaðarnesveita Hitaveita Suðurnesja Hitaveita Akureyrar Hitaveita Ólafsfjarðar Reykjaveita í Fnjóskadal Hitaveita Hríseyjar Svalbarðsströnd/Svalbarðseyri Hitaveita Akraness og Borgarfj. Orkuveita Húsavíkur Hitaveita Sauðárkróks Hitaveita Hjaltadals MW Start of today utilization 885 25 21 16 14 10 9 5 4 3 3 159 82 10 5 2 1 78 52 23 9 MW today 1930 1947 1982 1975 1979 1988 1992 1996 1988 2005 1974 1977 1944 1982 1973 1979 1981 1970 1953 1980 Selfossveitur Hitaveita Laugaráss Reykholt Laugarvatn Hitaveita Seltjarnarness Hitaveita Blönduóss Hitaveita Siglufjarðar Hitaveita Dalabyggðar Hitaveita Flúða Hitaveita GOGG 2 Hitaveita Dalvíkur Hitaveita Egilsstaða og Fella Hitaveita Húnaþings Vestra Hitaveita Reykjahlíðar Hitaveita Öxarfjarðarhéraðs Hitaveita Fjarðabyggðar Hitaveita Suðureyrar Hitaveita Reykhóla Hitaveita Brautarholts Hitaveita Drangsness Hitaveita Mosfellsbæjar Start of utilization 42 1948 14 1923 12 1928 6 1928 27 1971 9 1977 6 1975 4 1999 19 1929 15 1992 15 1969 12 1979 7 1933 7 1971 6 1994 6 2005 3 1977 1 1954 1 1950 1 1999 0, 5 1929
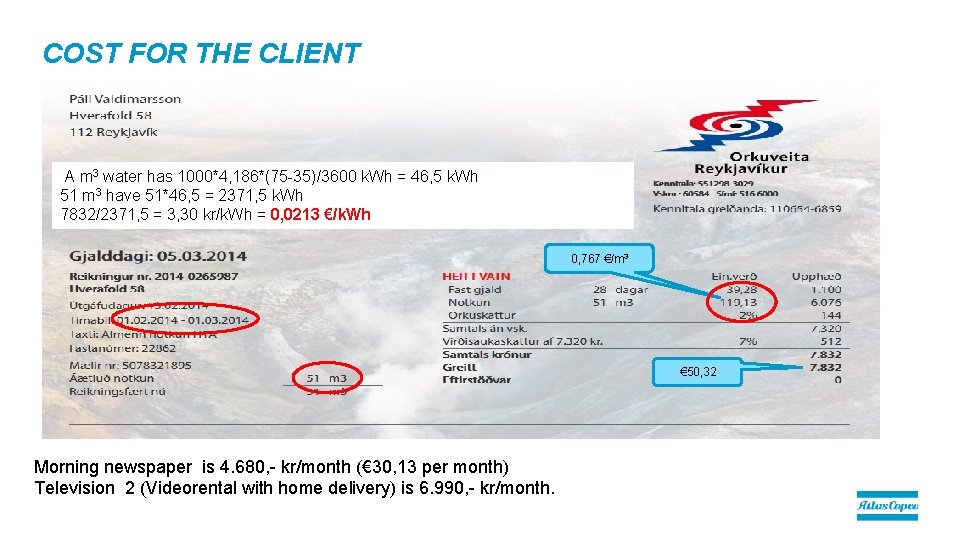
COST FOR THE CLIENT A m 3 water has 1000*4, 186*(75 -35)/3600 k. Wh = 46, 5 k. Wh 51 m 3 have 51*46, 5 = 2371, 5 k. Wh 7832/2371, 5 = 3, 30 kr/k. Wh = 0, 0213 €/k. Wh 0, 767 €/m 3 € 50, 32 Morning newspaper is 4. 680, - kr/month (€ 30, 13 per month) Television 2 (Videorental with home delivery) is 6. 990, - kr/month.
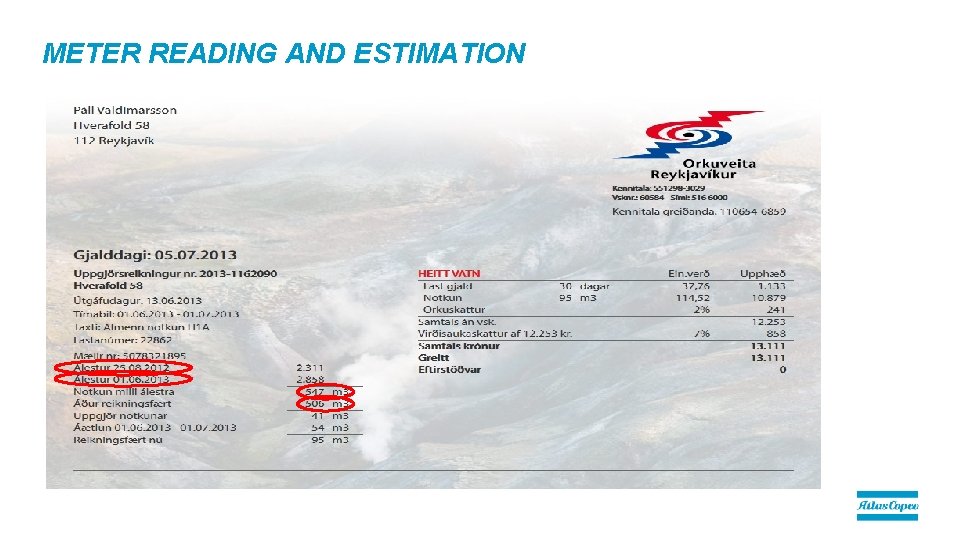
METER READING AND ESTIMATION
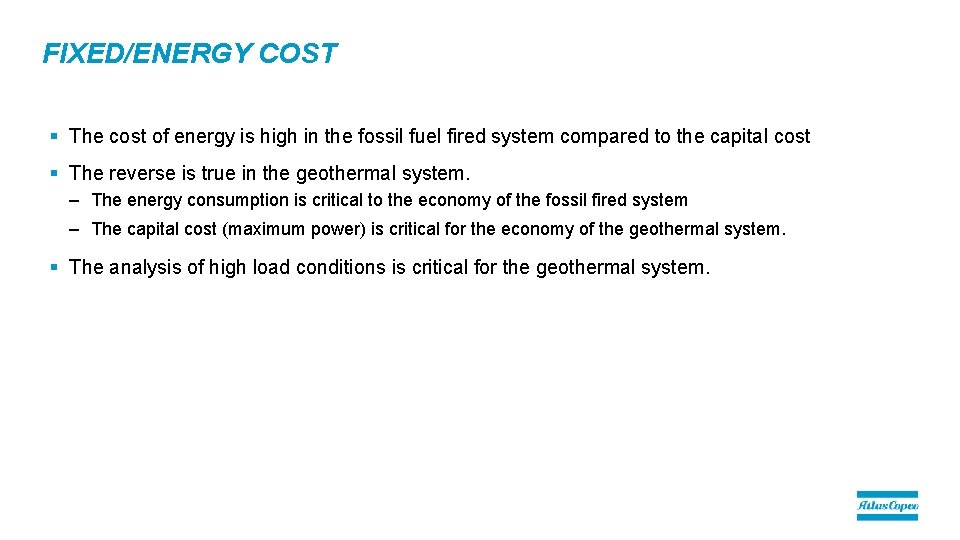
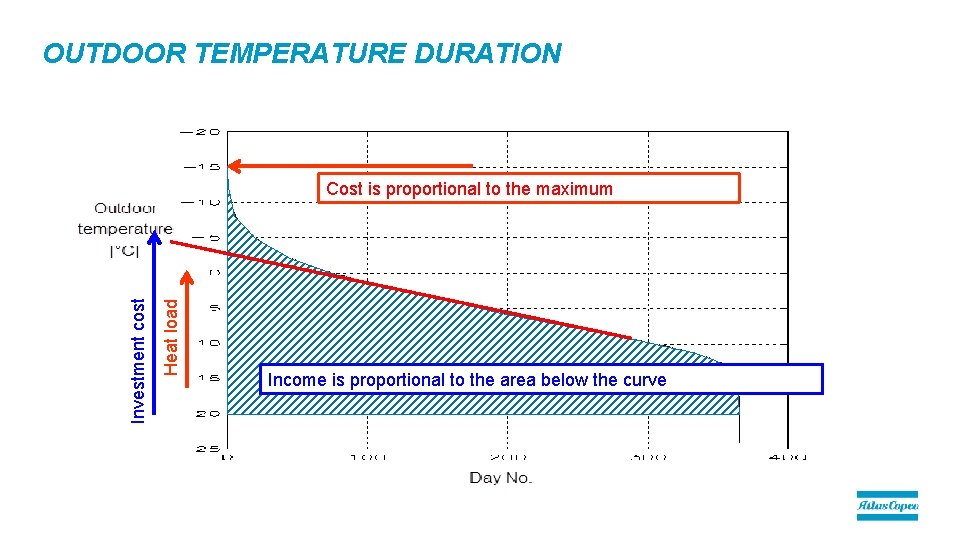
FIXED/ENERGY COST § The cost of energy is high in the fossil fuel fired system compared to the capital cost § The reverse is true in the geothermal system. – The energy consumption is critical to the economy of the fossil fired system – The capital cost (maximum power) is critical for the economy of the geothermal system. § The analysis of high load conditions is critical for the geothermal system.
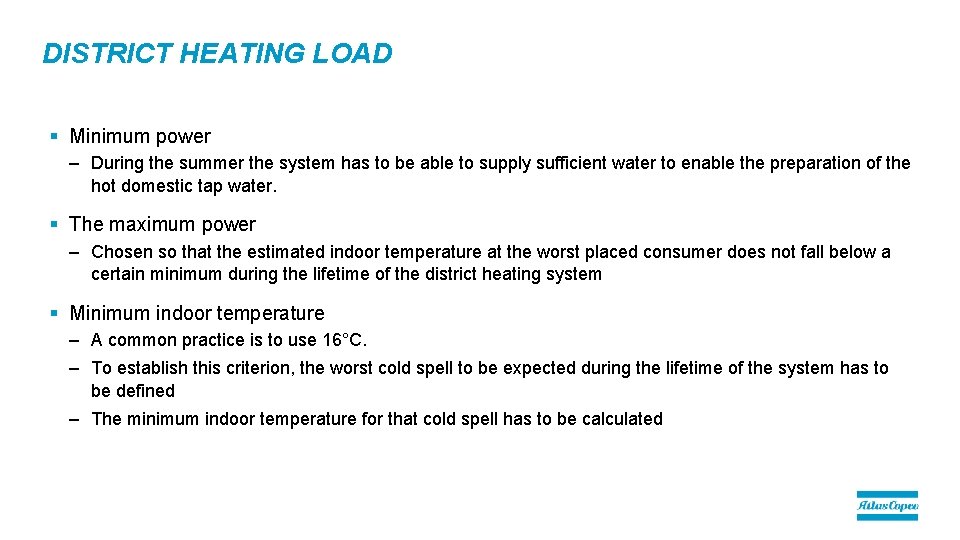
DISTRICT HEATING LOAD § Minimum power – During the summer the system has to be able to supply sufficient water to enable the preparation of the hot domestic tap water. § The maximum power – Chosen so that the estimated indoor temperature at the worst placed consumer does not fall below a certain minimum during the lifetime of the district heating system § Minimum indoor temperature – A common practice is to use 16°C. – To establish this criterion, the worst cold spell to be expected during the lifetime of the system has to be defined – The minimum indoor temperature for that cold spell has to be calculated
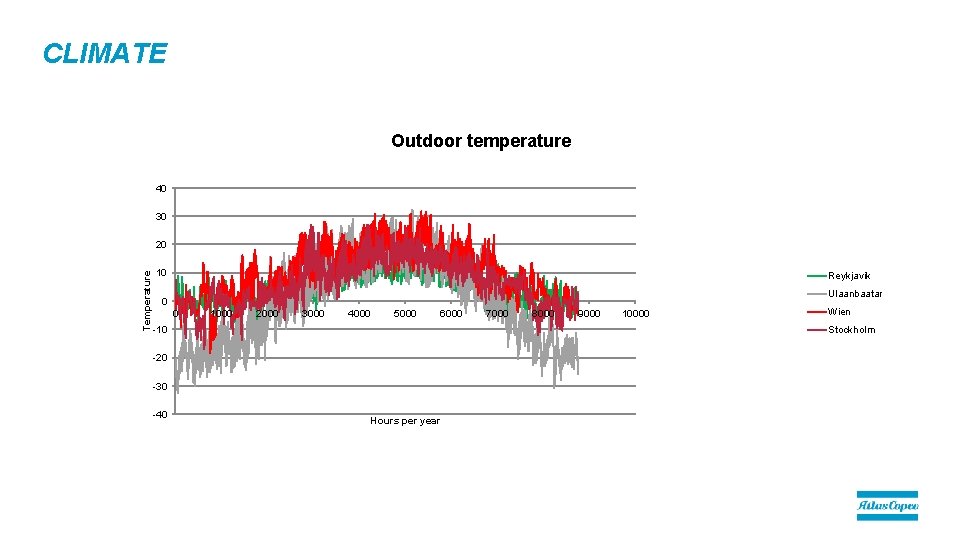
CLIMATE Outdoor temperature 40 30 Temperature 20 10 Reykjavik Ulaanbaatar 0 0 1000 2000 3000 4000 5000 6000 -10 8000 9000 10000 Wien Stockholm -20 -30 -40 7000 Hours per year
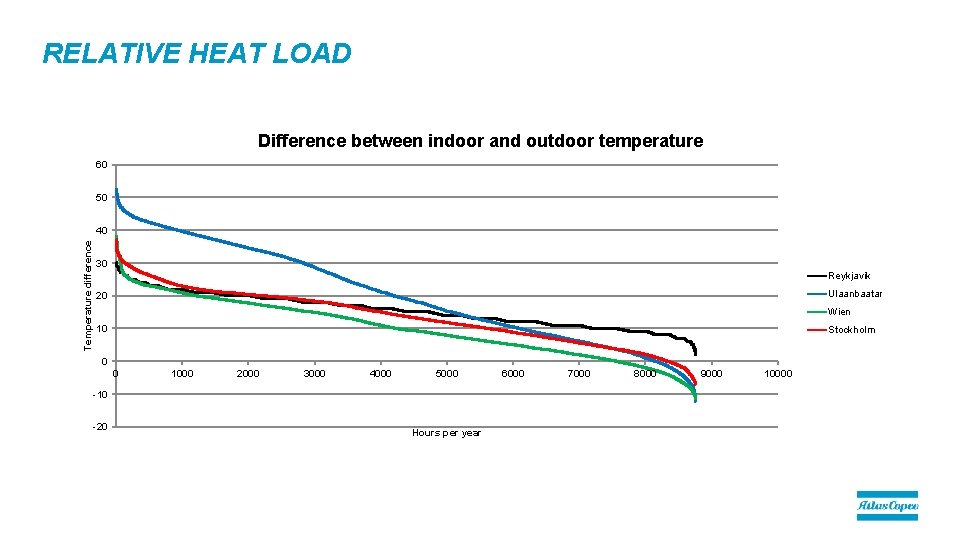
RELATIVE HEAT LOAD Difference between indoor and outdoor temperature 60 50 Temperature difference 40 30 Reykjavik Ulaanbaatar 20 Wien 10 Stockholm 0 0 1000 2000 3000 4000 5000 -10 -20 Hours per year 6000 7000 8000 9000 10000
OUTDOOR TEMPERATURE DURATION Heat load Investment cost Cost is proportional to the maximum Income is proportional to the area below the curve
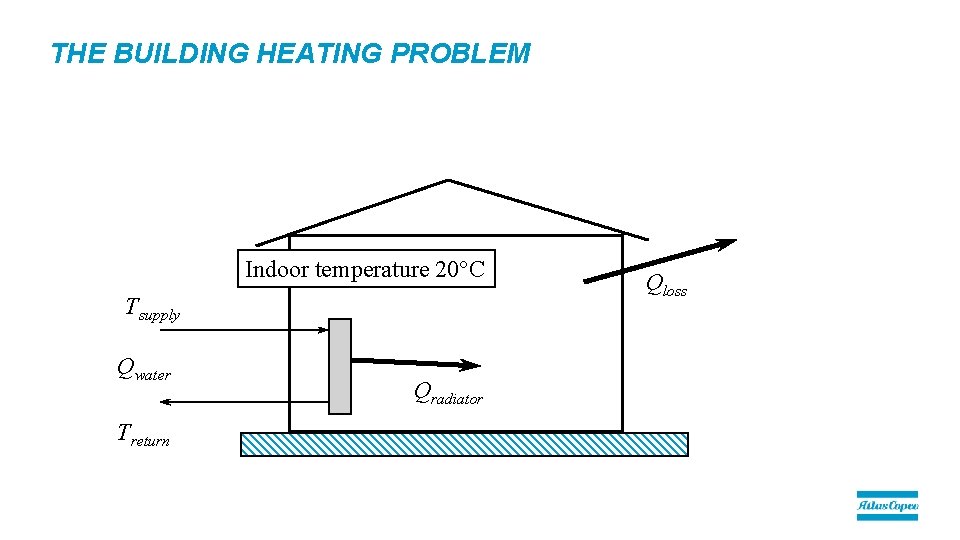
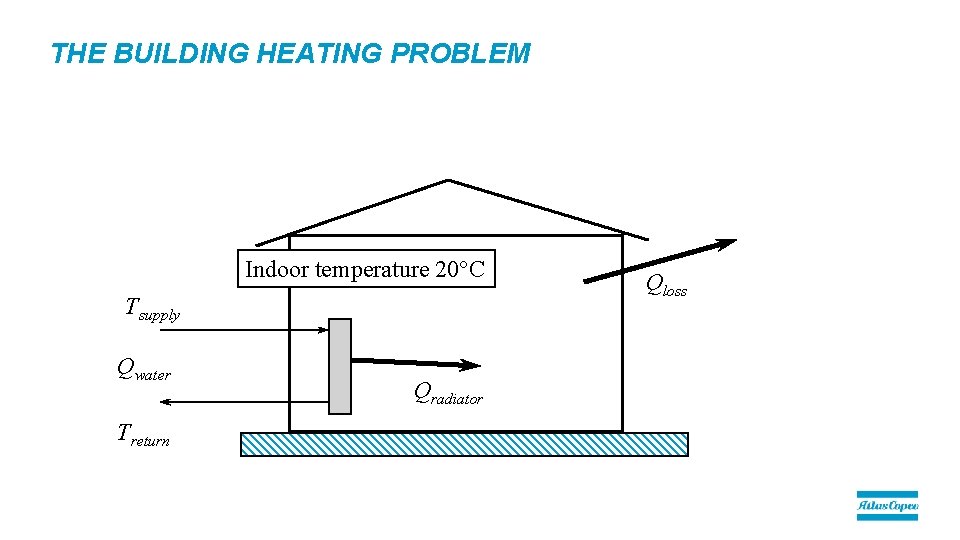
THE BUILDING HEATING PROBLEM Indoor temperature 20°C Tsupply Qwater Treturn Qradiator Qloss
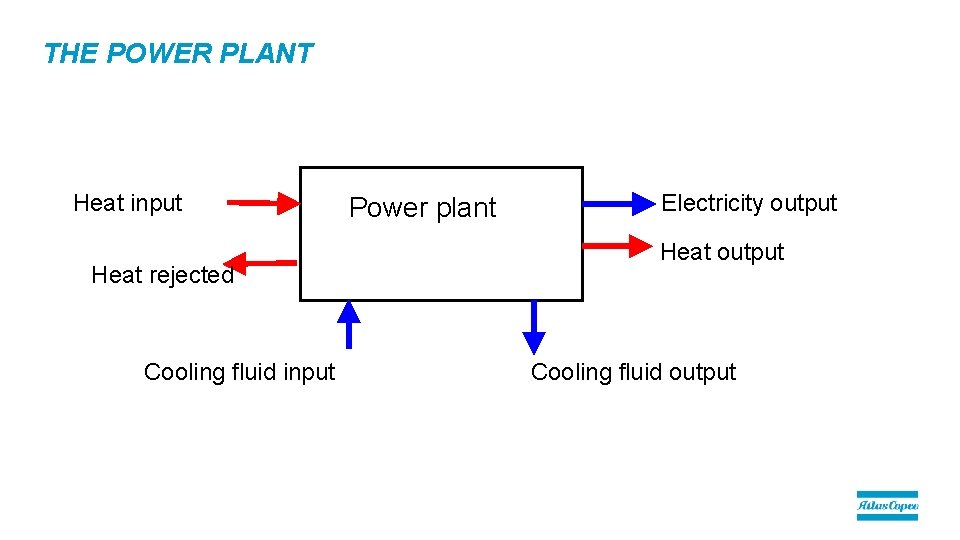
THE POWER PLANT Heat input Heat rejected Cooling fluid input Power plant Electricity output Heat output Cooling fluid output
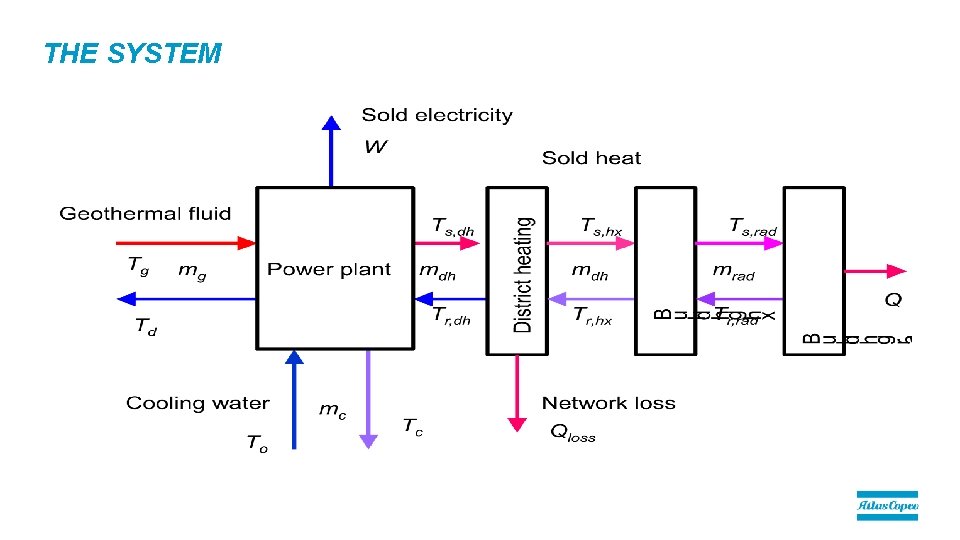
THE SYSTEM
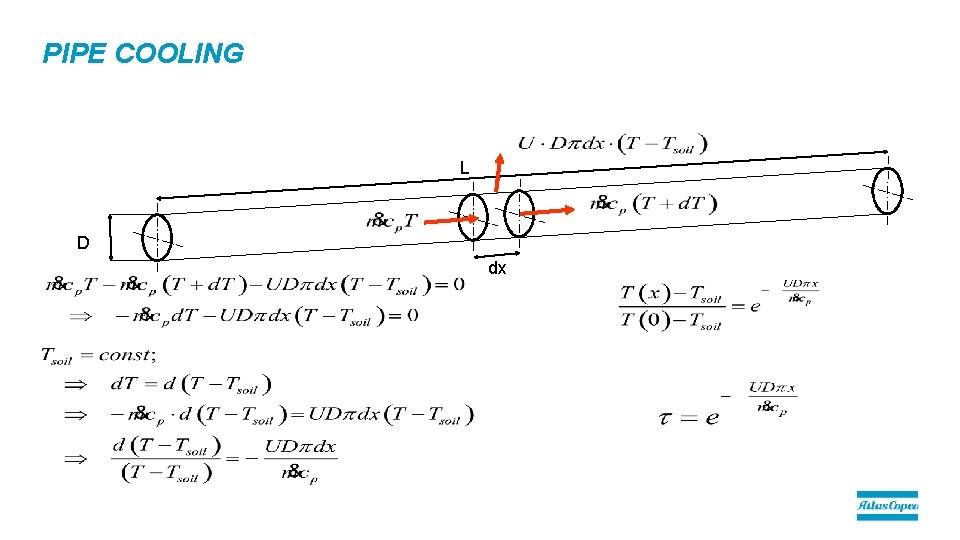
PIPE COOLING L D dx
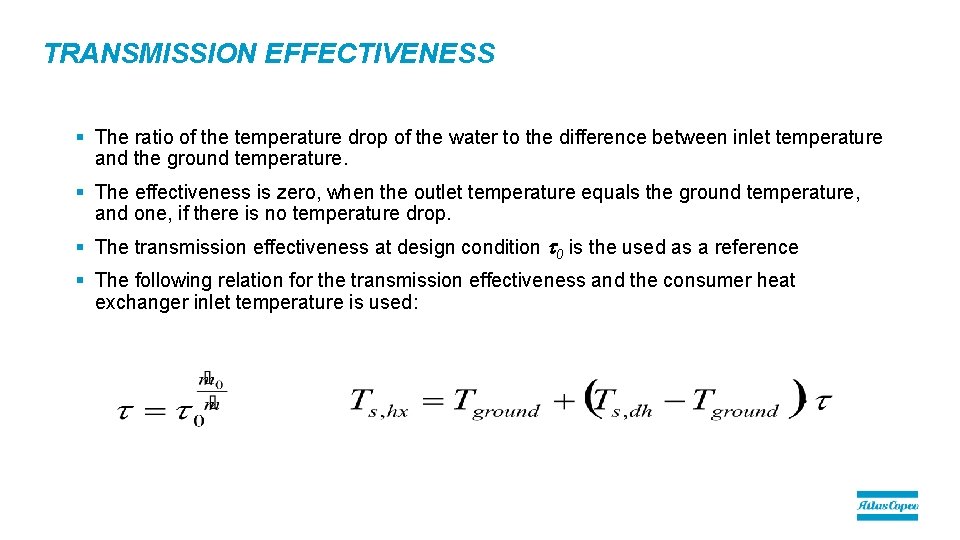
TRANSMISSION EFFECTIVENESS § The ratio of the temperature drop of the water to the difference between inlet temperature and the ground temperature. § The effectiveness is zero, when the outlet temperature equals the ground temperature, and one, if there is no temperature drop. § The transmission effectiveness at design condition t 0 is the used as a reference § The following relation for the transmission effectiveness and the consumer heat exchanger inlet temperature is used:
THE BUILDING HEATING PROBLEM Indoor temperature 20°C Tsupply Qwater Treturn Qradiator Qloss
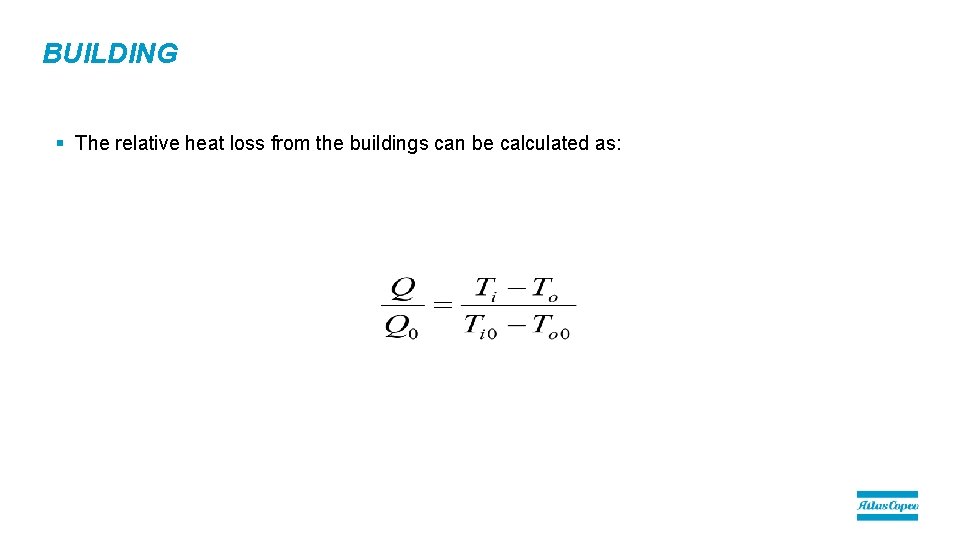
BUILDING § The relative heat loss from the buildings can be calculated as:
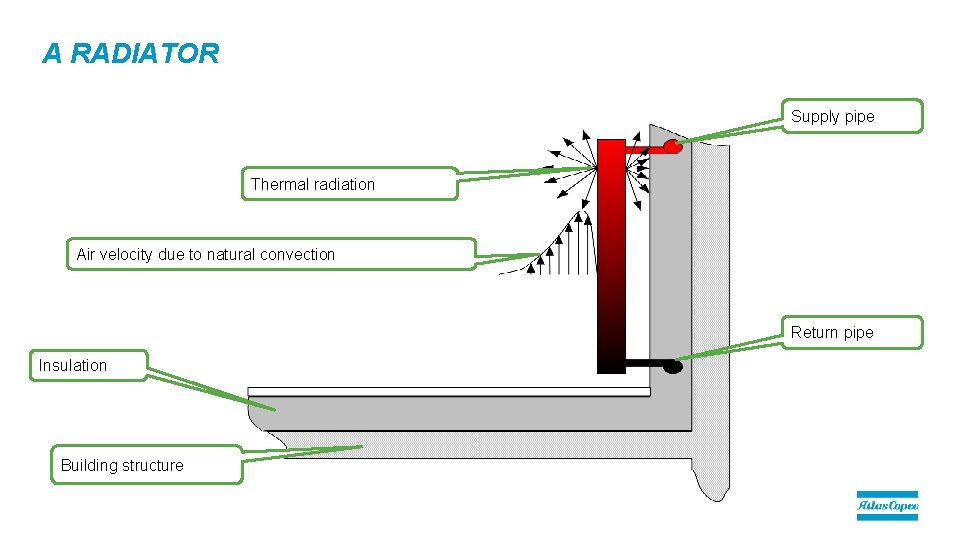
A RADIATOR Supply pipe Thermal radiation Air velocity due to natural convection Return pipe Insulation Building structure
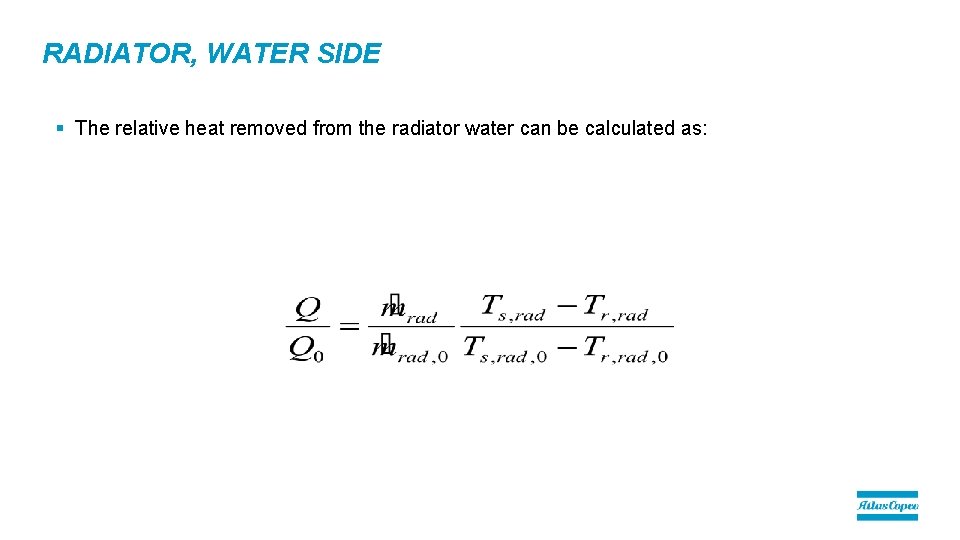
RADIATOR, WATER SIDE § The relative heat removed from the radiator water can be calculated as:
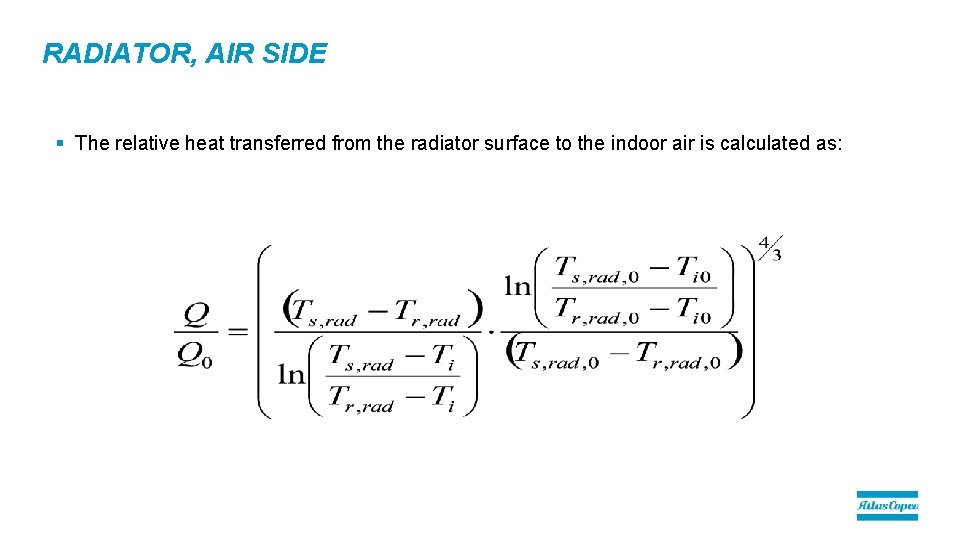
RADIATOR, AIR SIDE § The relative heat transferred from the radiator surface to the indoor air is calculated as:
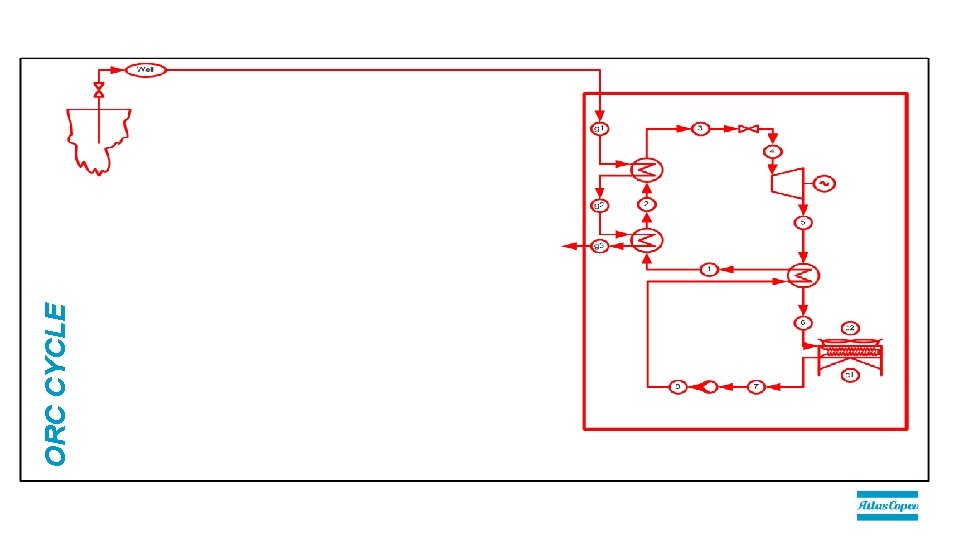
ORC CYCLE
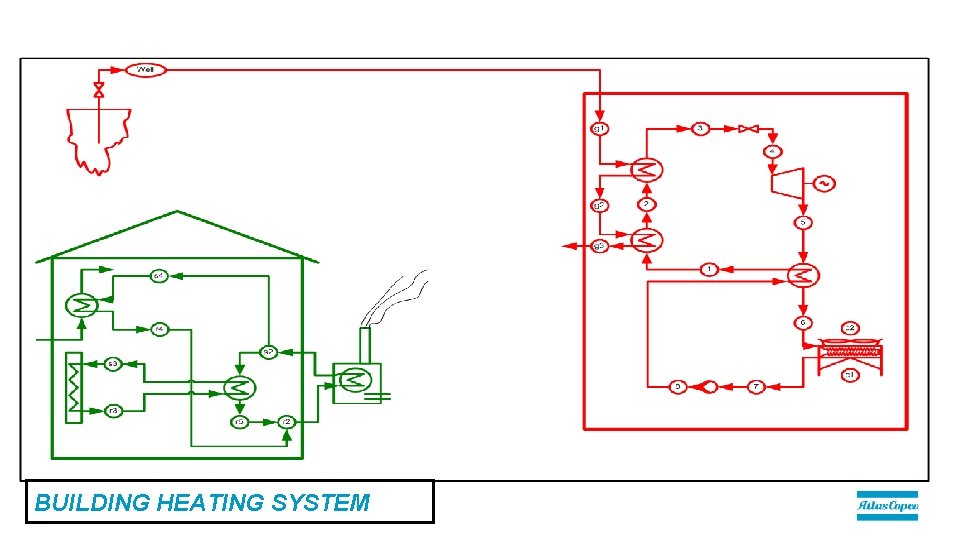
BUILDING HEATING SYSTEM
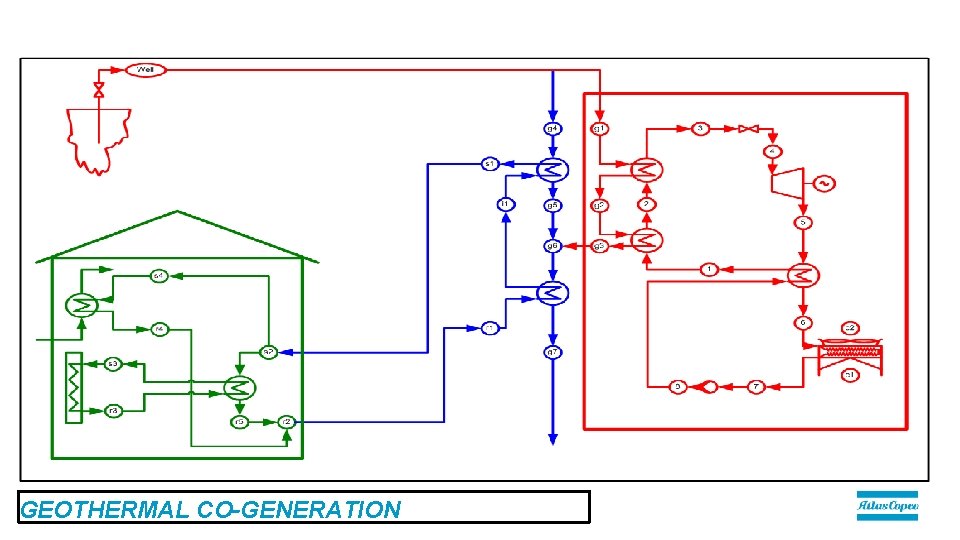
GEOTHERMAL CO-GENERATION
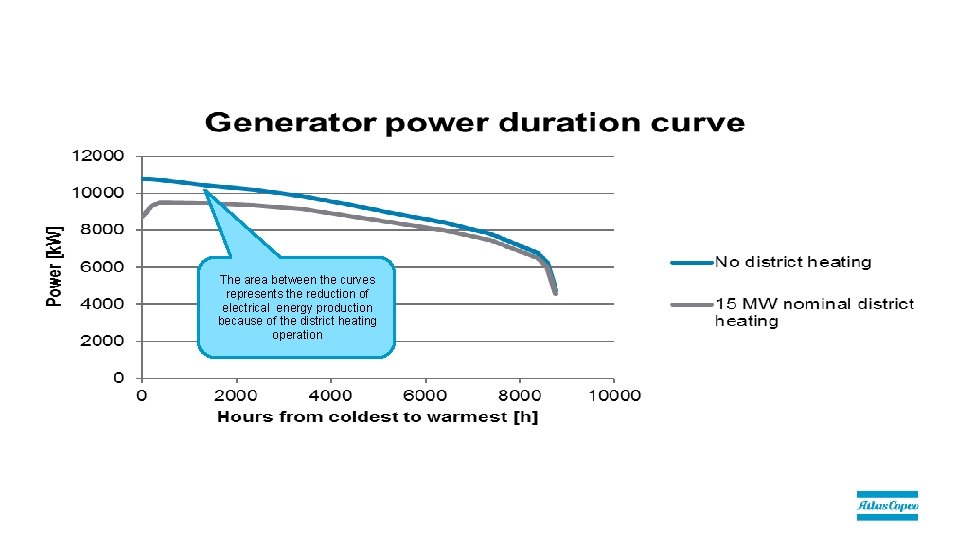
The area between the curves represents the reduction of electrical energy production because of the district heating operation
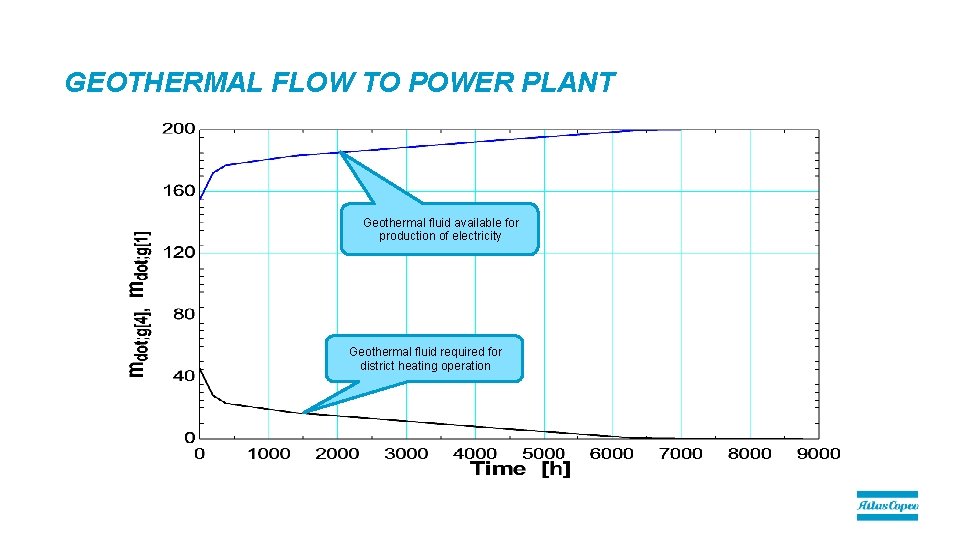
GEOTHERMAL FLOW TO POWER PLANT Geothermal fluid available for production of electricity Geothermal fluid required for district heating operation
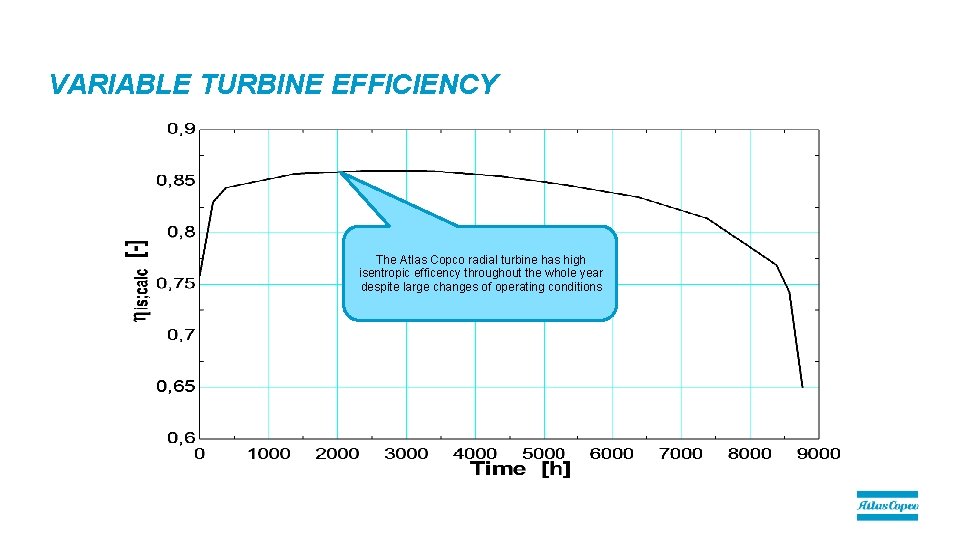
VARIABLE TURBINE EFFICIENCY The Atlas Copco radial turbine has high isentropic efficency throughout the whole year despite large changes of operating conditions
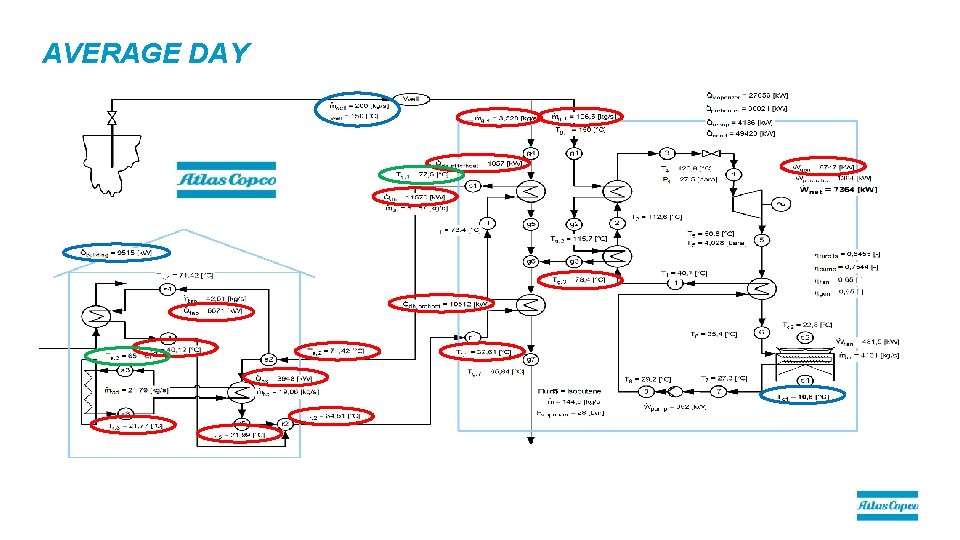
AVERAGE DAY
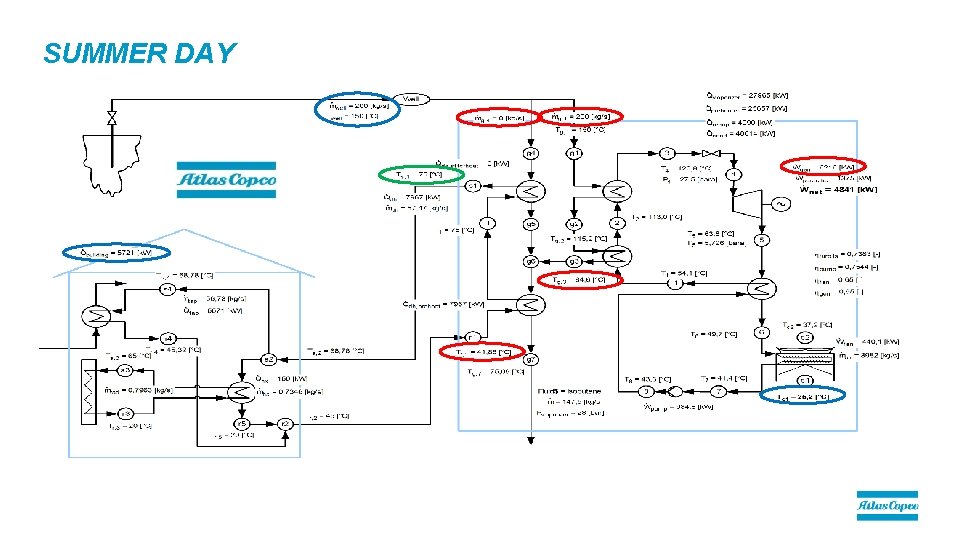
SUMMER DAY
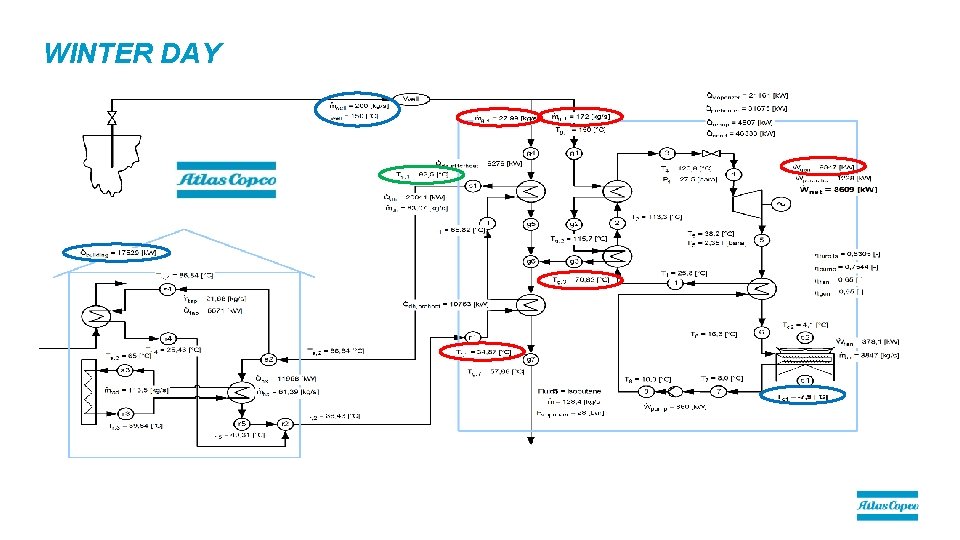
WINTER DAY
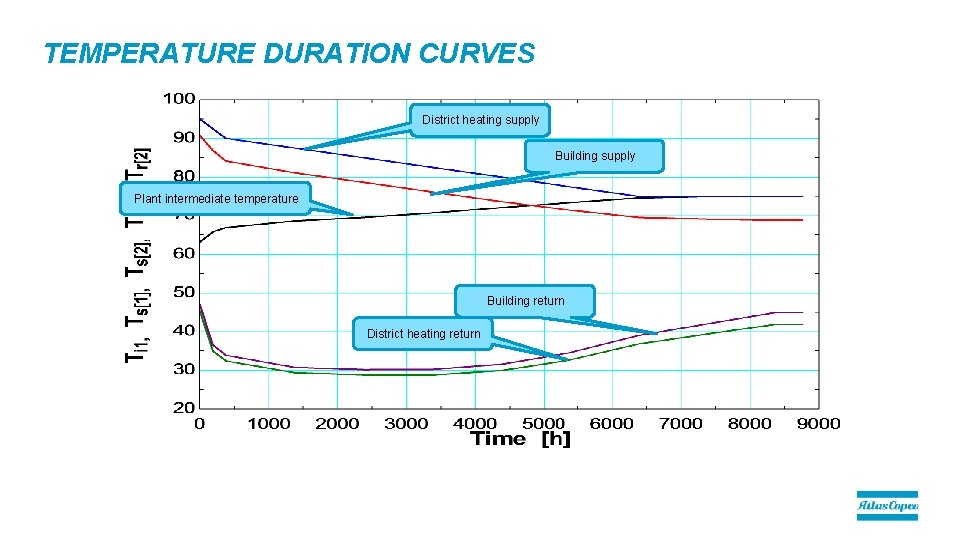
TEMPERATURE DURATION CURVES District heating supply Building supply Plant intermediate temperature Building return District heating return
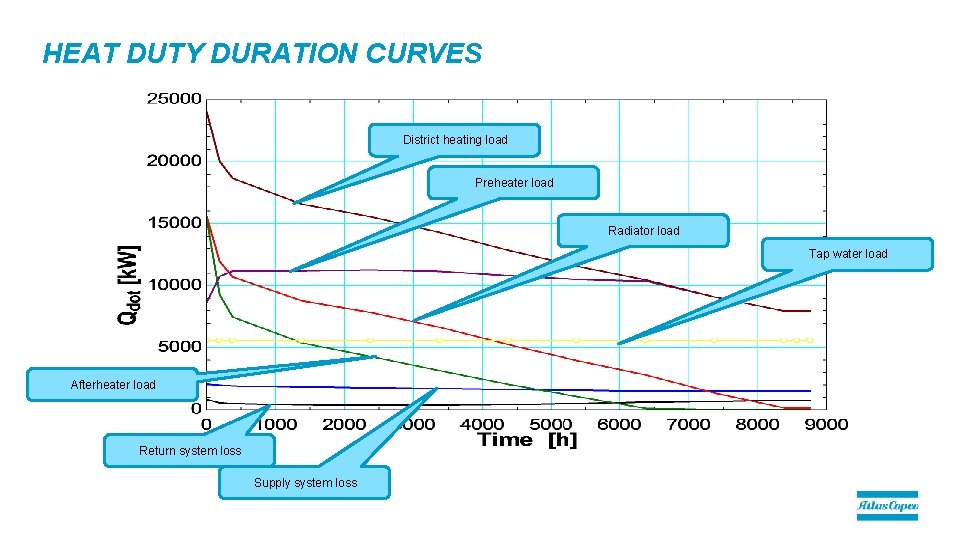
HEAT DUTY DURATION CURVES District heating load Preheater load Radiator load Tap water load Afterheater load Return system loss Supply system loss
COMMITTED TO SUSTAINABLE PRODUCTIVITY.