Geospatial Electrification Planning for Myanmar Sustainable Engineering Lab

Geo-spatial Electrification Planning for Myanmar Sustainable Engineering Lab Director: Vijay Modi Department of Mechanical Engineering (SEAS) and Earth Institute, Columbia University Nay Pyi Taw, Myanmar, November 22, 2013 1

Outline • Rationale • Our Approach: analysis platform for decision making: where what technology, prioritization, nearterm decisions guided by long-term, least-cost • Not engineering designs, but rapid planning • Examples: village, region and national scales • Combine International Experience + Local Expertise • Our Project Plan and Starting Work in Myanmar

Rationale • Organize information in a systematic digital form • Useful for – Quickly budgeting – Responding to internal and donor needs – Transmission upgrades/generation – Communication bet township/state/national • Co-ordination between grid and off-grid projects

Benefits of National Geospatial Planning • Accelerate national access at scale: – access and service standards can be applied consistently – important for remote, under-served populations • Improve allocation of investments: – ensure on-grid generation benefits from economies of scale – efficient targeting of off-grid systems for smaller communities – enable rapid design and bulk procurement in roll-out • Provide a coordinated investment framework: – help donors & government prioritize according to local development goals – reduce risk for private sector investors and entrepreneurs • NOTE: The difference between design vs. planning 4
 • Acquire detailed geo-spatial, cost and technical information: – Demand points (settlements)")
Approach (1) • Acquire detailed geo-spatial, cost and technical information: – Demand points (settlements) – Electricity Infrastructure (MV distribution lines) – Demand level – Growth rates (population, economic) – Cost Factors (grid and off-grid, initial & recurring) (with off-grid) 5
 • Project demand cost for a defined time-horizon: – Apply growth rates,")
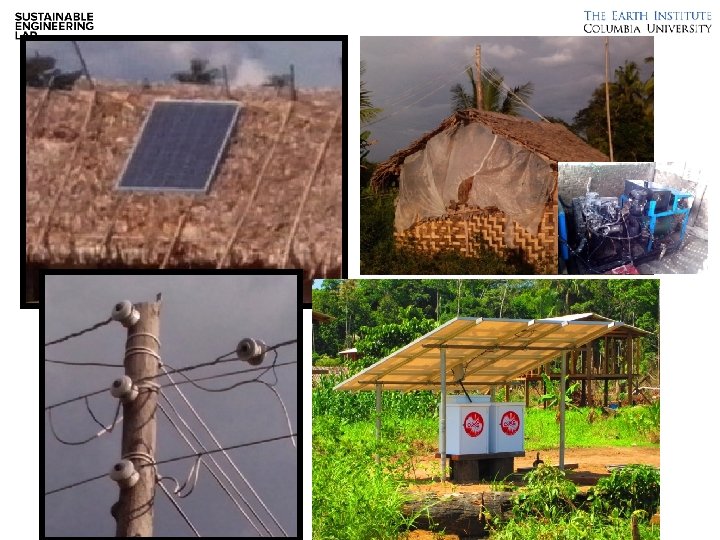
Approach (2) • Project demand cost for a defined time-horizon: – Apply growth rates, wealth / income mapping • Algorithmic computation of least-cost electricity system: – Grid extension – Mini- or Micro-grids (renewable, hybrid) – Household Systems (solar) • Generate phased Roll-Out plan for grid and distributed systems (with off-grid) 6

Network. Planner: An Algorithmic Planning System
 Designed")
Network. Planner How it Works • A free, web-based tool (no license fees) Designed by our lab at the Earth Institute • Accepts essential local inputs of geospatial demand points, costs for electricity technologies, growth rates and other key parameters. • Algorithmically plans least-cost electricity systems in these steps: 1. Computes the lifetime costs (initial and recurring) for meeting projected electricity demand at every point for all electricity options 2. Chooses the lowest-cost electricity technology for each point 3. Creates detailed map outputs for the least-cost grid and all standalone systems. 4. Creates detailed tabular outputs describing investment needs, recurring costs, additional generation required, and many other planning outputs.

Kenya – The First Major Use of Geospatial Planning Kenya / EI Electricity Planning Project: • Results highlighted the need to electrify western, under-served areas • Region specific generation req. and transmission upgrades • Ultimately led to major loan 1. 3 B from World Bank 9

Example: Electrification Planning at the Regional scale Flores, Indonesia: 6, 300 settlements in Eastern Indonesia 10

Inputs that went into access planning • Location of each settlements • Population of each settlement • Where is the existing medium-voltage network? • Unit costs of utility infrastructure, off-grid • New customer demand

Essential Local Contribution: Technical and Cost Parameters Grid Extension Initial Costs $30/m MV line (with poles) $600 Total HH connection Costs (incl: service drop/LV line) $200/ k. VA Transformer (≥ 15 k. VA) Recurring Costs $0. 35 / k. Wh "bus bar" cost Annual O&M: 1% of line costs 3% of transformer costs $1. 00/W panels (5 peak sun hours / day) $267/k. Wh battery replacement $267/k. Wh batteries, 5 k. Wh/k. W (every 3. 3 years) Village Solar $100/HH for LV wire to home Annual O&M: $1/W BOS (electronics) 1% of panel cost $267/k. Wh battery replacement $2. 15/W panels (5 peak sun hours/day) (every 2. 5 years) Off-Grid / $267/k. Wh batteries Annual O&M: HH Solar 5 k. Wh/k. W battery capacity 2% of panel cost 13
")
Example of Grid-Rollout over 20 Years (Flores Island, Eastern Indonesia)

15

16

17

18

19

A complete electricity plan specifies locations with grid access, mini-grids, and off-grid (solar home systems)

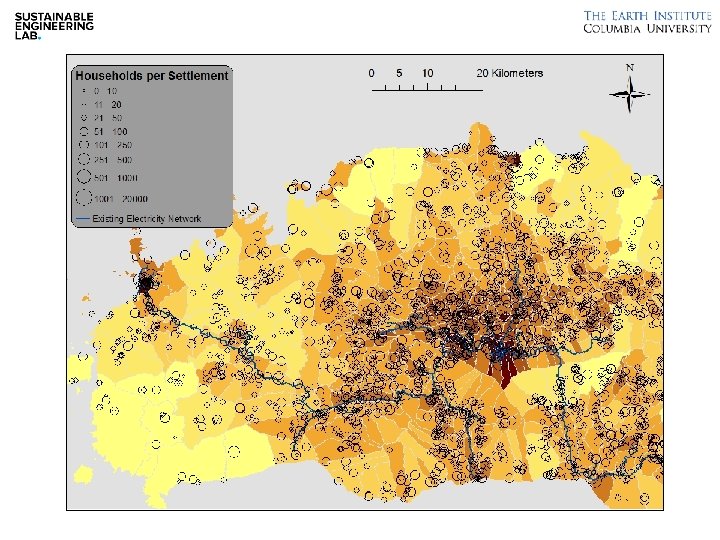
140, 000 120, 000 100, 000 Household Solar 80, 000 Village Solar Mini-Grid 60, 000 Proposed Grid 40, 000 Grid Connected 20, 000 -5 51 0 -1 10 00 12 25 50 150 50 1 - 0 10 00 >1 00 0 0 21 11 -2 10 0 0 - Total Number of Households by Tech Type Model results provide quantitative outputs for locations served by all system types, with capacities and costs. Proposed Grid: 166, 000 HHs Village Solar Mini-Grid: 84, 000 HHs Bins: Number of Households per Settlement 21
 170, 130 Investments (250, 000 new")
Pre-Existing Grid: Pre-existing household grid connections (2010 Census) 170, 130 Investments (250, 000 new HH with elec) Proposed New Grid Conn Total Initial cost for grid network (MV+LV) 165, 000 $165 Million Village Solar Mini-Grids Conn Total Initial cost for all Mini-Grid systems 84, 000 $94 Million Household Solar (model output) 3000 $5 M Generation Costs for Grid Connected HH Coal + Solar + Geothermal + Wind 22

Grid: Metrics Pre-Existing Grid: Pre-Existing MV line length Units kilometers 1, 505 Pre-existing connections (2010 Census) Households 170, 130 meters 8. 8 Existing MV Line Length per HH Scenario Results Proposed MV line length Units kilometers 480 k. Wh/yr 1, 934 240 k. Wh 94 Proposed new grid connections Proposed MV line per new HH Proposed Total New Capacity Proposed New Capacity per HH Households meters MW k. W 166, 141 11. 6 21. 8 0. 130 19, 400 4. 8 1. 3 0. 065 Scenario Results Grid Costs Total Initial cost for grid network (MV+LV) for MV grid network for LV, Svc Drop, HH wiring Total levelized cost for Grid power 480 k. Wh/yr per new Total HH conn. $163, 479, 151 $984 $53, 638, 088 $323 $109, 841, 063 $661 $0. 63 / k. Wh 240 k. Wh/yr per new Total HH conn. $14, 337, 188 $736 $1, 904, 402 $98 $12, 432, 786 $638 $0. 72 / k. Wh 23

Solar Mini-Grid: Metrics Scenario Results Proposed Total Capacity of Mini-Grids Proposed new mini-grid connections Proposed Capacity per HH 480 k. Wh/yr 240 k. Wh/yr 35 49 84, 430 215, 840 416 225 Unit MW Households W/HH Solar Mini-Grid: Costs Scenario Results 480 k. Wh/yr 240 k. Wh/yr per new Total HH conn. $149, 769, 300 $694 Total Initial cost for system $94, 032, 500 $1, 114 System discounted cost $366, 324, 716 $4, 339 $509, 826, 782 $2, 362 Total demand met by mini-grid (in k. Wh) 502, 893, 767 5, 956 642, 808, 188 2, 978 $0. 83 /k. Wh Total levelized cost per k. WH for Grid power $0. 76 /k. Wh 10% of the k. Wh from diesel backup for solar mini-grids brings reliability from 80% to 90% 24

Solar Home Systems: Metrics and Costs Scenario Results Proposed Total watts of SHS Proposed new SHS connections Proposed Size for each SHS 480 k. Wh/yr 946 2, 649 356 k. W Households W/HH 240 k. Wh/yr 3, 197 k. W 17, 907 Households 179 W/HH Solar Home Systems Solar: Costs 480 k. Wh/yr Scenario Results Total Initial cost for system System discounted cost Total demand met by Grid (in k. Wh) Total levelized cost for SHS power 240 k. Wh/yr per new HH Total conn. $5, 321, 274 $2, 009 $17, 992, 857 $1, 005 $18, 141, 961 $6, 849 $61, 343, 525 $3, 426 642, 808, 188 35, 897 15, 778, 344 5, 956 $1. 16 /k. Wh 25

Background Population Modeling GIS Platform Model Results Solar Micro. Grids Talking Points Marginal costs of grid connections can increase with roll-out Mini-grid 26

Mini-Grid Rollout: An example prioritizing higher demand villages

Planning at Township Level Mini-grid Solar home System Hig h Vo lta ge Grid?

Solar Mini Grid Algorithm Results Technology Options

Grid Rollout: An example prioritizing most cost-effective branches Investment in MV line per connection (meters shown) Phase 1 < 20 Phase 2 20 – 25 Phase 3 > 25

Incremental Infrastructure • one could start local and where/when demand grows and grid comes closer connect to the grid • Keeps initial investments small and modular • Does not strain utility immediately • Allows demand grows and entrepreneurship to emerge organically

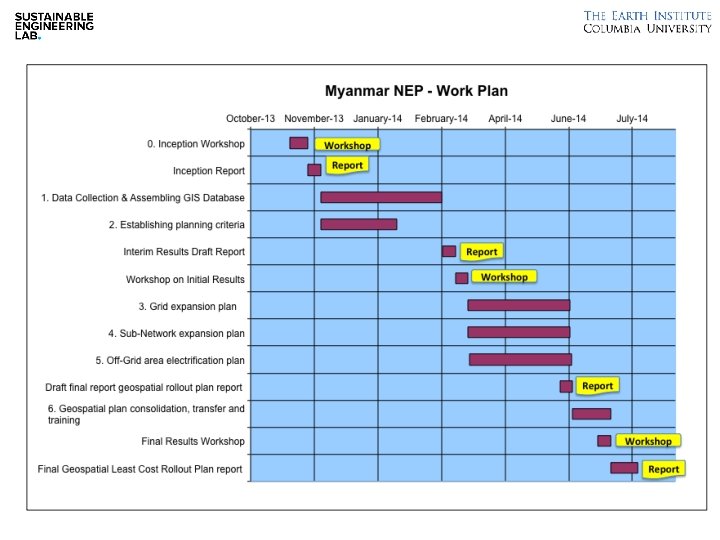
Our Project Plan • The Earth Institute’s approach to Electrification Planning in Myanmar will include three phases with an in-country workshop roughly marking each phase, as outlined below.

Our Project Plan 1. Data Gathering – Milestone 1: Inception Workshop – Deliverable 1: Inception Report – Milestone 2: Formation of a GIS dataset with acceptable resolution of population and MV network representation – Deliverable 2: Interim Report

Our Project Plan 2. Demand Analysis & Quantify Supply Needed – Milestone 3: Workshop on Initial Results – Deliverable 3: Draft Final Geospatial Rollout Plan 3. Final Scaled-Analysis and Knowledge Transfer – Milestone 4: Final Results Workshop – Milestone 5: GOM feedback on Draft Report – Deliverable 4: Final Geospatial Rollout Plan & accompanying datasets developed

Starting Work For Myanmar: Data Sets Needed for Electricity Modeling • Settlement Data from Village or Village Tracts – Locations – Populations • Existing Grid Distribution Data – map or digital file for medium-voltage lines • Other drivers – Supply options, current/future – Demand/hh, population and demand growth, – unit costs of options
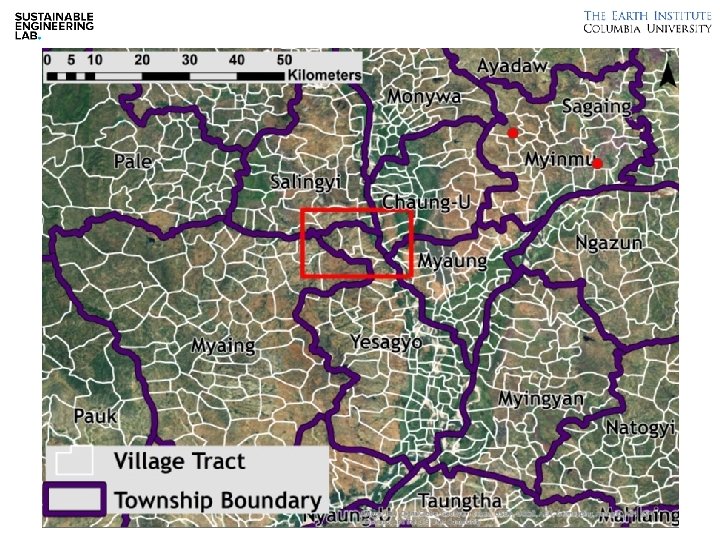

Village locations within Village Tracts Village Tract data may be supplemented in some cases Electrification Planning benefits from village level data.

Settlement Data • From MOLFRD, DRD • Village location and population, 2001 • In absence of more recent data, an excellent starting point • Project to future • Can we updated as new figures become available

EXAMPLE: State: Magway Township: Pakoku

Existing distribution grid • Transmission Lines – Available through MEPE, up to 66 k. V • Medium Voltage lines, ESE, YESB – 33 k. V and 11 k. V lines – Currently not available in digital geo-spatial form – ESE is compiling paper/scan images from all states/regions, estimated avai: 1 month • Smaller off-grid systems – Expect to report later
, DHP (planning) • Cost")
Other drivers • Large generation Sources – Hydropower, HGPE (generation), DHP (planning) • Cost of Grid Generation in the future – Some uncertainty due to variable international fuel supply, scale of demand growth – JICA study – Hydro potentials, thru MOPE • Hydro <5 MW, from ESE • Unit costs, demand
 GIS product: shapefile with digitized MV lines")
Original: jpeg with hand-drawn MV lines (red) GIS product: shapefile with digitized MV lines (blue)

Training and Capacity Building : Example: Data collection with smartphones Training and detailed work with local electricity technicians and managers resulted in completion of a detailed local medium-voltage distribution grid map for a region in Eastern Indonesia Training & mapping of MV grid lines (IDN) West Timor (IDN) MV grid initial estimate West Timor (IDN), MV grid lines following EI training & mapping 44

Approach to data • Settlement Data valuable for electricity, gas, roads, water, and other services • Tools to gather and “maintain” data. • How to rapidly capture planning grade data for existing lines • Work closely with Government/Utility to embed tools/processes in their systems

Working with Ministries, Utilities, Enterprises • We would like to begin here in Nay Pyi Taw, possibly following up in other regions or offices. We ask your permission and support • Our plan and approach is to work side-by-side with local experts and practitioners to ensure the relevance, completeness and accuracy of all data and outputs. • Workshop tomorrow
- Slides: 48