
Geology 56606660 Applied Geophysics 20 Feb 2018 Last
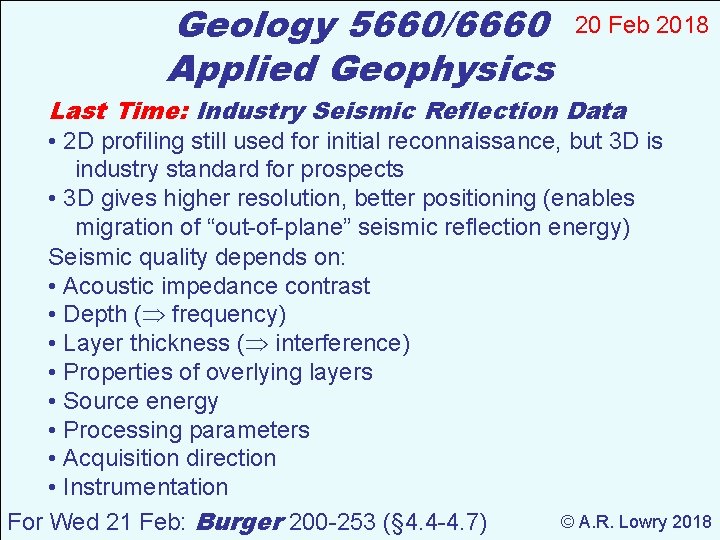
Geology 5660/6660 Applied Geophysics 20 Feb 2018 Last Time: Industry Seismic Reflection Data • 2 D profiling still used for initial reconnaissance, but 3 D is industry standard for prospects • 3 D gives higher resolution, better positioning (enables migration of “out-of-plane” seismic reflection energy) Seismic quality depends on: • Acoustic impedance contrast • Depth ( frequency) • Layer thickness ( interference) • Properties of overlying layers • Source energy • Processing parameters • Acquisition direction • Instrumentation © A. R. Lowry 2018 For Wed 21 Feb: Burger 200 -253 (§ 4. 4 -4. 7)
Haakon Fossen 2010
Haakon Fossen 2010
Haakon Fossen 2010
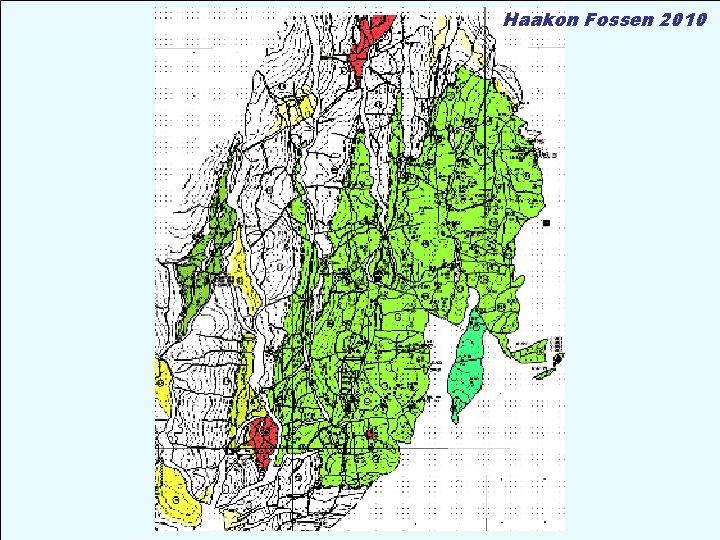
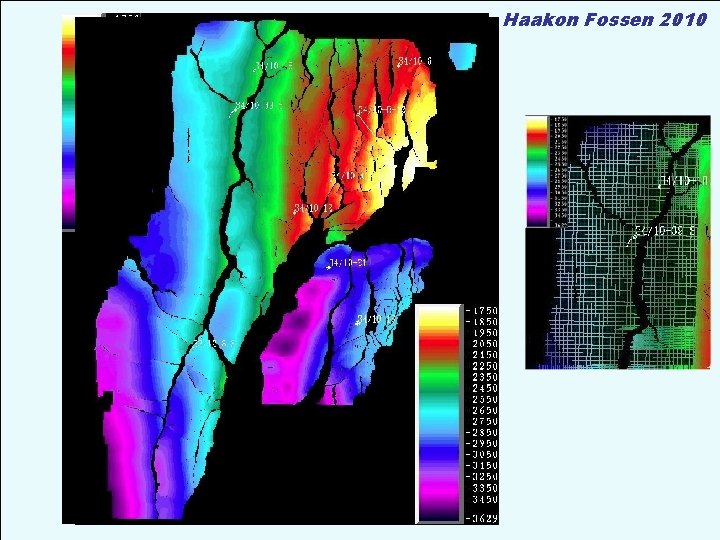
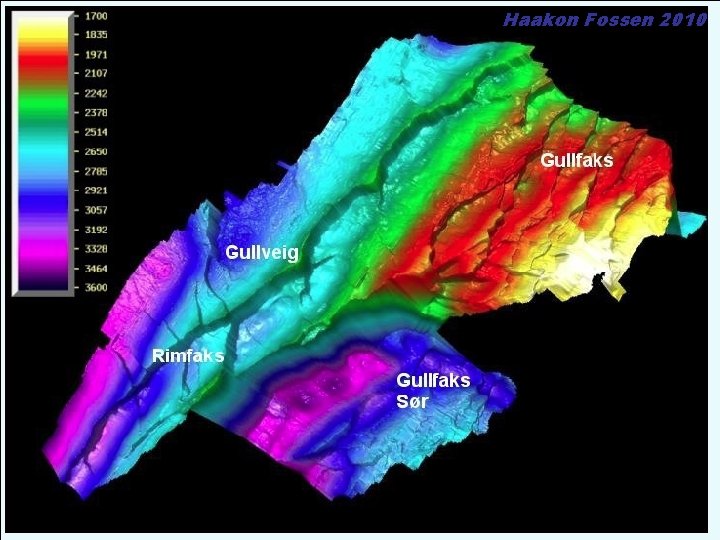
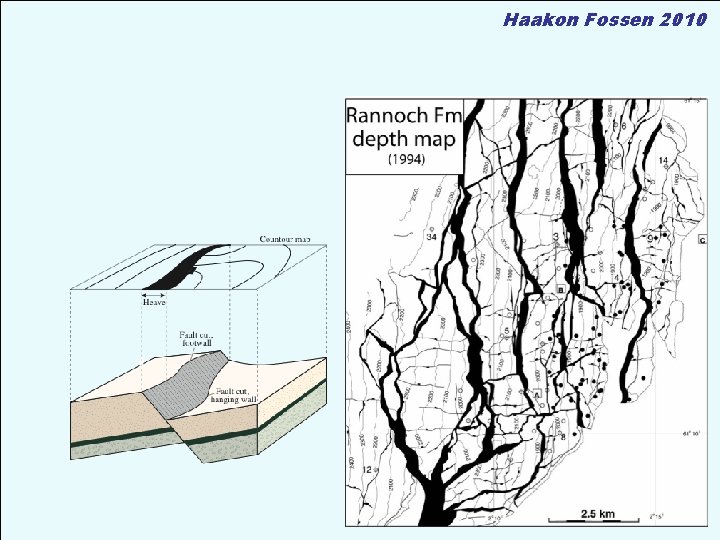
• Good seismic interpretation + Good depth conversion model = Accurate structure maps Haakon Fossen 2010
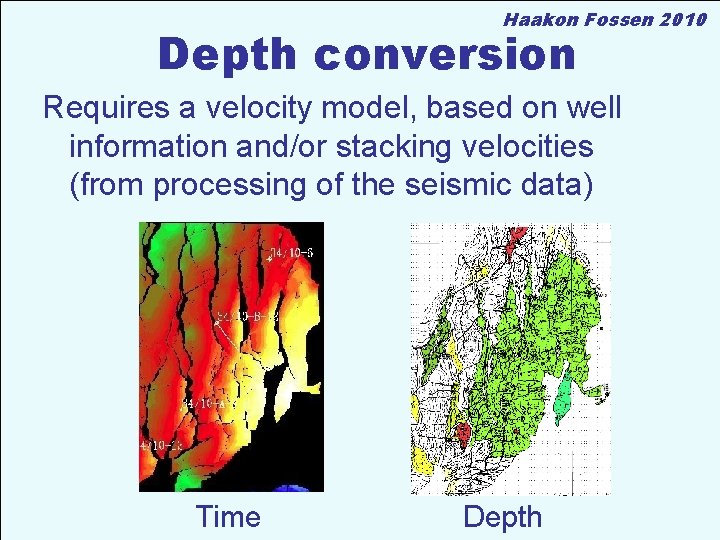
Haakon Fossen 2010 Depth conversion Requires a velocity model, based on well information and/or stacking velocities (from processing of the seismic data) Time Depth
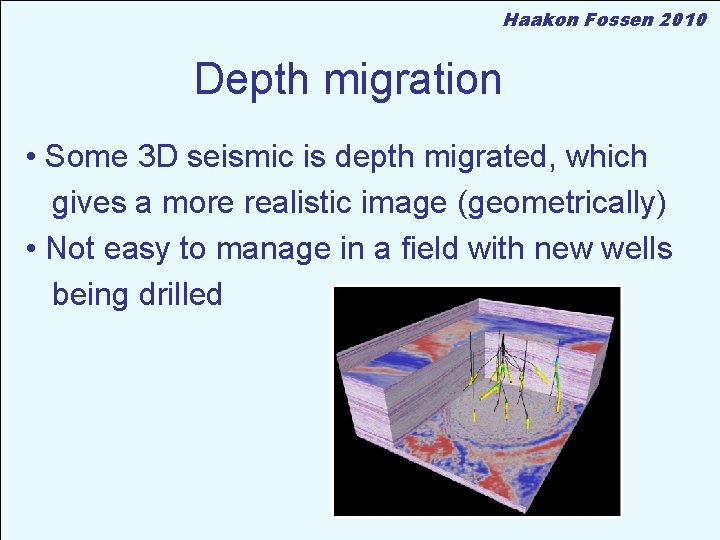
Haakon Fossen 2010 Depth migration • Some 3 D seismic is depth migrated, which gives a more realistic image (geometrically) • Not easy to manage in a field with new wells being drilled
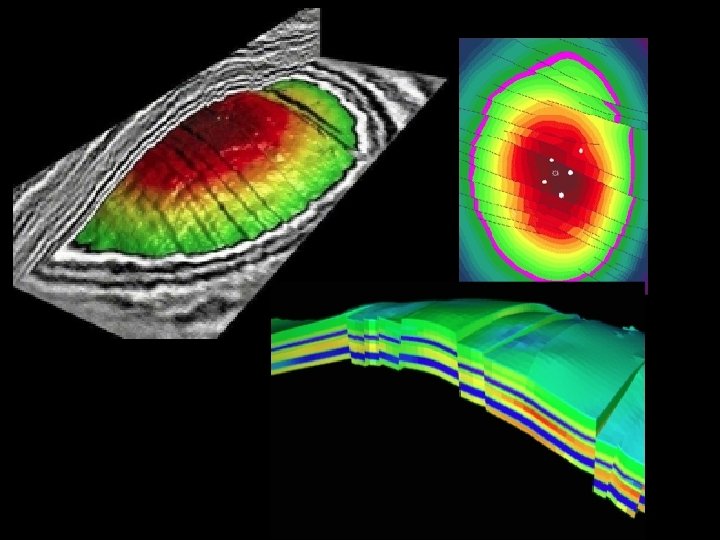
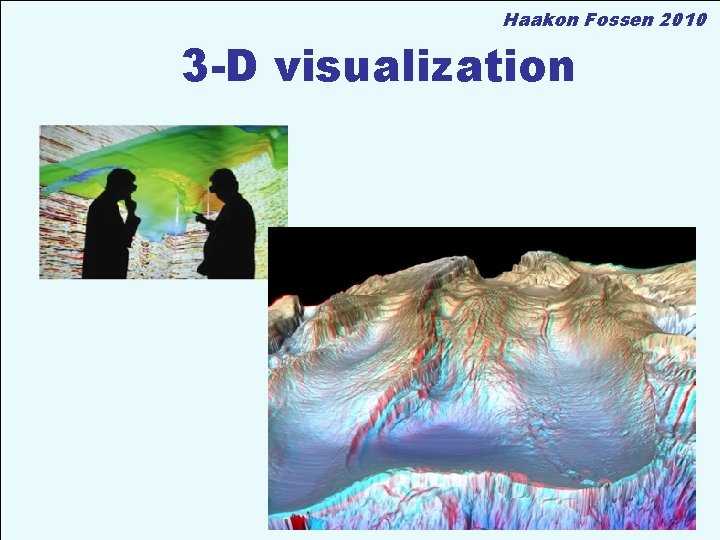
Haakon Fossen 2010 3 -D visualization
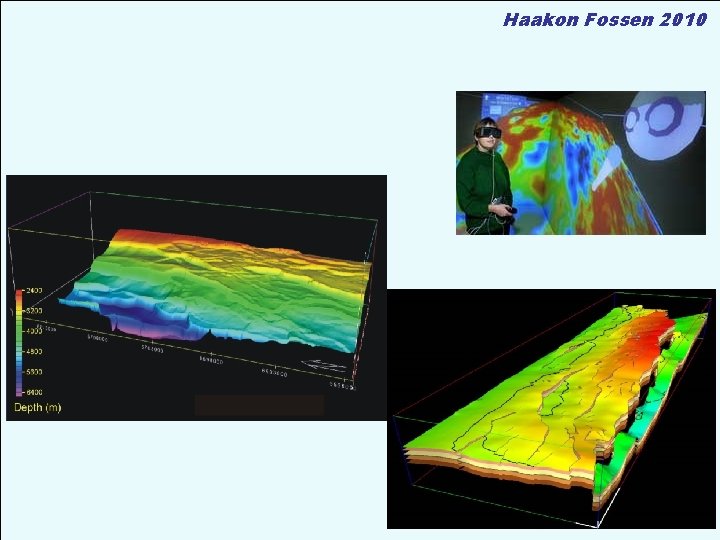
Haakon Fossen 2010
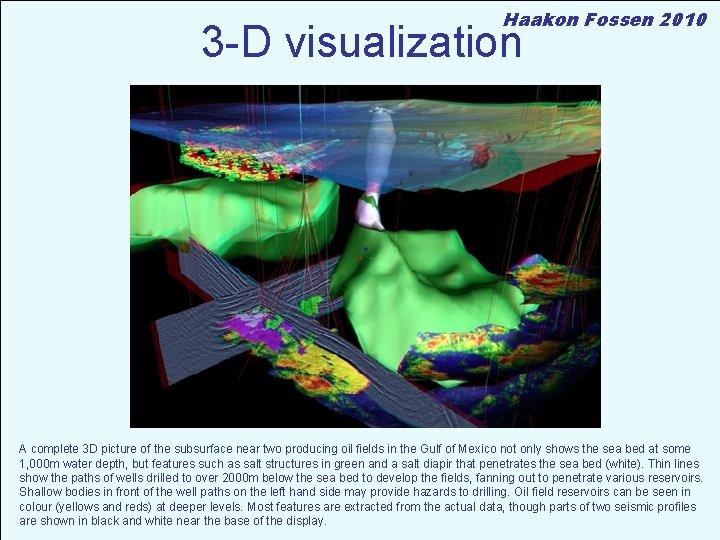
Haakon Fossen 2010 3 -D visualization A complete 3 D picture of the subsurface near two producing oil fields in the Gulf of Mexico not only shows the sea bed at some 1, 000 m water depth, but features such as salt structures in green and a salt diapir that penetrates the sea bed (white). Thin lines show the paths of wells drilled to over 2000 m below the sea bed to develop the fields, fanning out to penetrate various reservoirs. Shallow bodies in front of the well paths on the left hand side may provide hazards to drilling. Oil field reservoirs can be seen in colour (yellows and reds) at deeper levels. Most features are extracted from the actual data, though parts of two seismic profiles are shown in black and white near the base of the display.
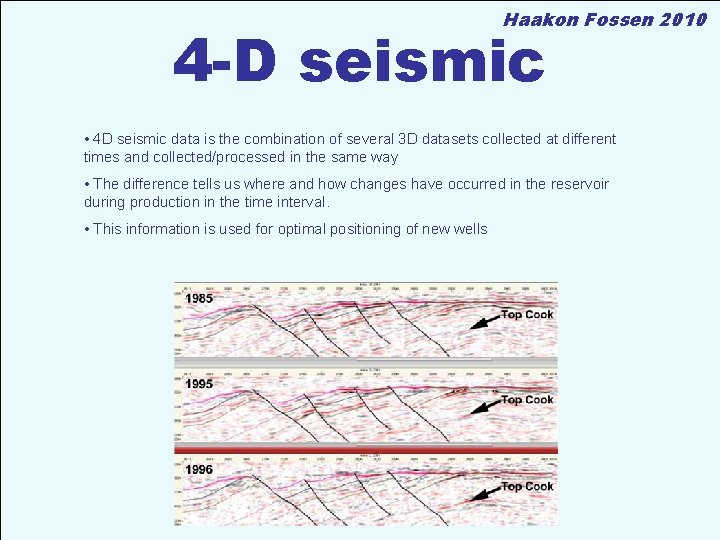
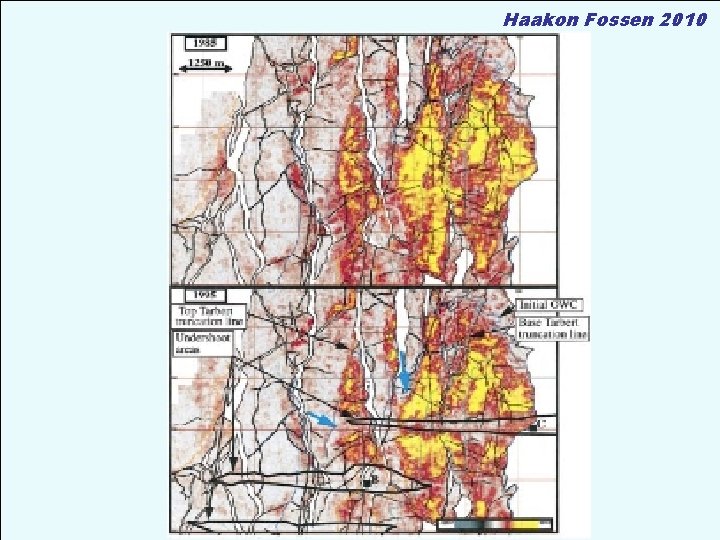
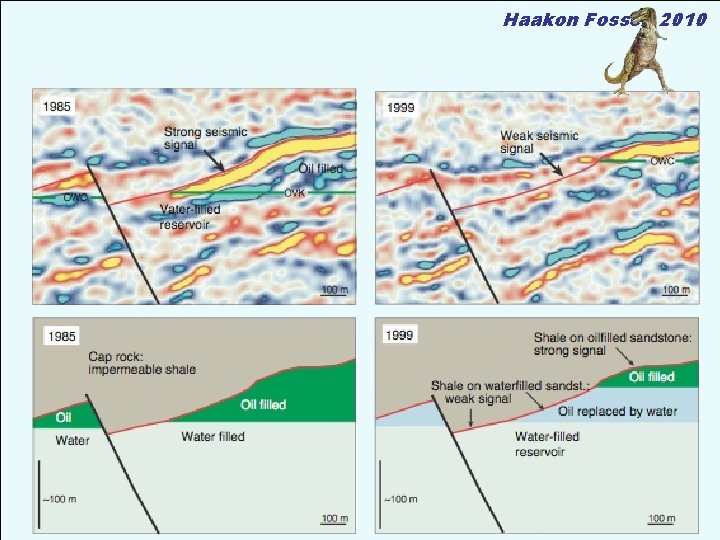
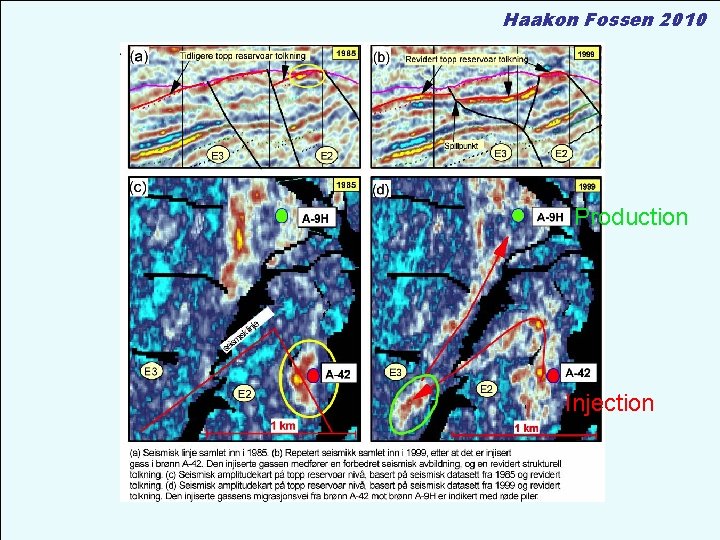
Haakon Fossen 2010 4 -D seismic • 4 D seismic data is the combination of several 3 D datasets collected at different times and collected/processed in the same way • The difference tells us where and how changes have occurred in the reservoir during production in the time interval. • This information is used for optimal positioning of new wells
Haakon Fossen 2010
Haakon Fossen 2010
Haakon Fossen 2010 Production Injection
Haakon Fossen 2010 Salt structures
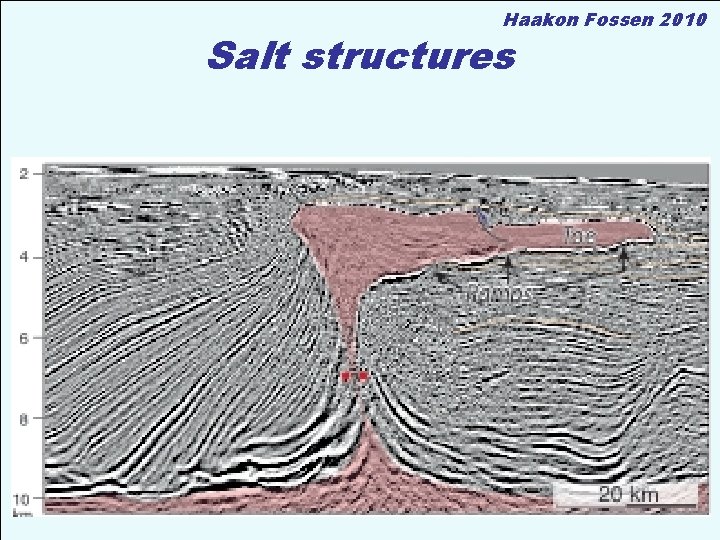
Haakon Fossen 2010 Salt structures
Haakon Fossen 2010
Haakon Fossen 2010
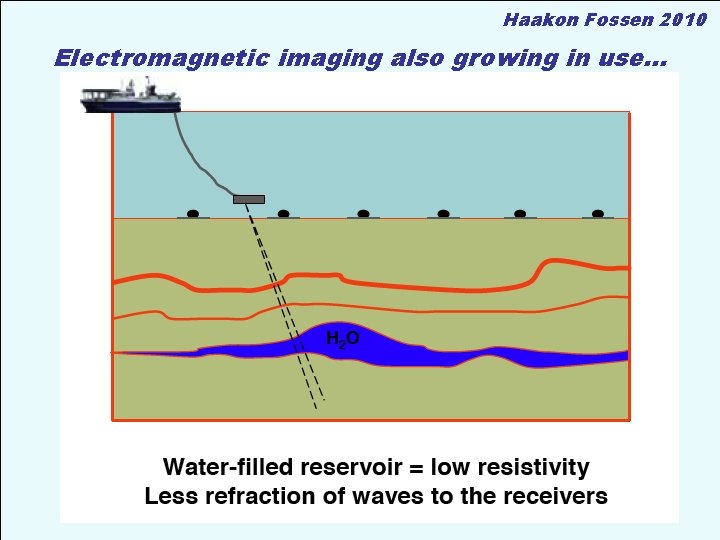
Haakon Fossen 2010 Electromagnetic imaging also growing in use… • Kombineres med seismiske data
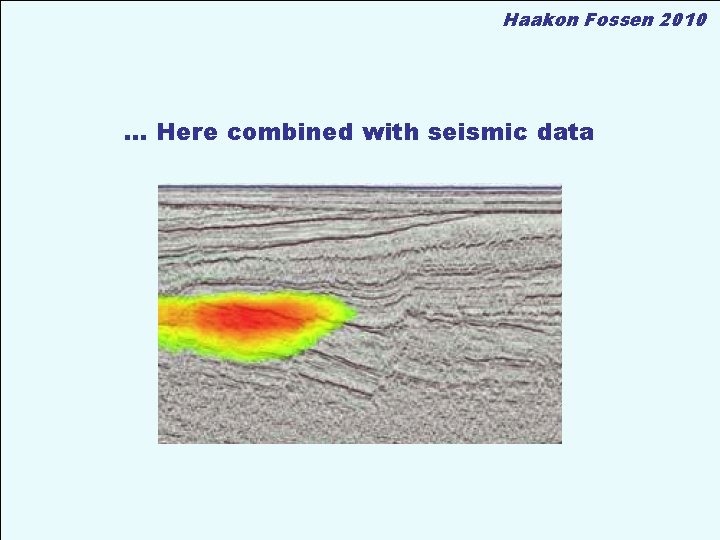
Haakon Fossen 2010 … Here combined with seismic data
- Slides: 21