Geology 1023 Correlations Correlations Outcrop is not continuous


")
")
")


")


. Use coloured pencils. Use a ruler (draw")
- Slides: 25
Geology 1023 Correlations
Correlations • Outcrop is not continuous • We need to be able to compare and contrast rocks at different locations i. e. , correlate • Various approaches but all involve identifying and recording the rocks and their structures at each locality
Contacts • Conformable – abrupt – gradational • Unconformable – angular unconformity – non-conformity – disconformity
Stratigraphic column • Record of rocks present at any given location • Rectangular column with unit thickness shown by proportional division and composition shown by patterns
Simulated column • • Rocks at back of lab Given thicknesses and lithologies Write out some descriptions Make a column
Add scale, using an arbitrary zero point.
First unit is 2 m of shale (2 columns wide)
Next unit is 2 m of sandy siltstone (2. 5 columns wide)
Next unit is 10 m of conglomerate (4 columns wide)
…and so on! Once column is complete, subdivide into “formations”.
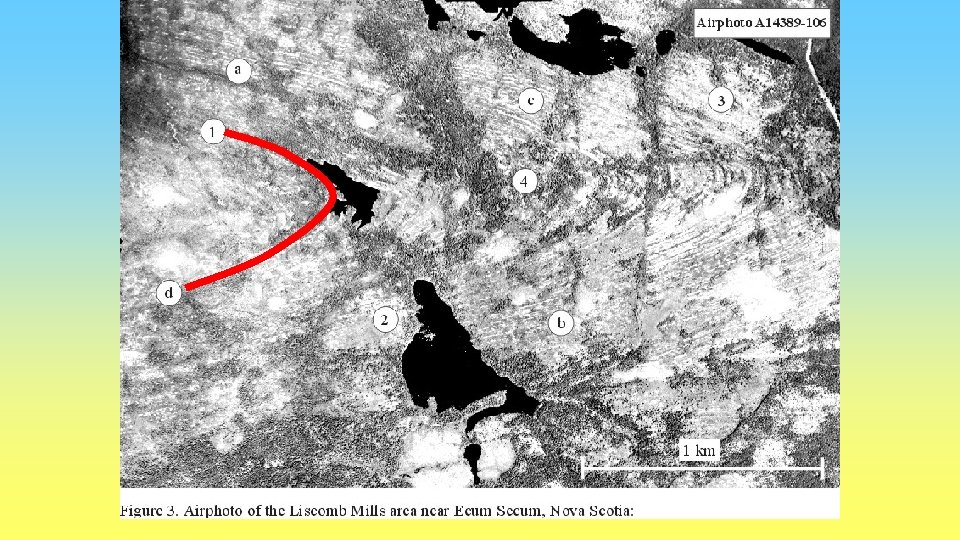
Physical correlation • • Use the photo to “walk out” the outcrop Determine the type of fold Correlate different positions Determine the ages
Correlations • Once columns are prepared then the geology at each location can be compared and correlated.
? Not contacts!
Two “problems” you will face • A unit is missing entirely in one column = “pinch out” • You will be forced to correlate 2 different units (same sequence below and above each) = facies variations
Pinch out
Facies change
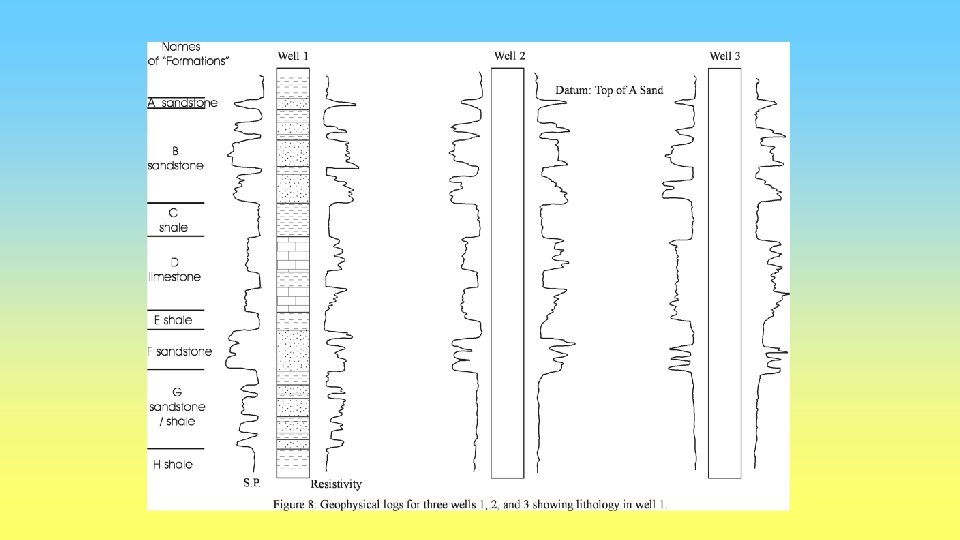
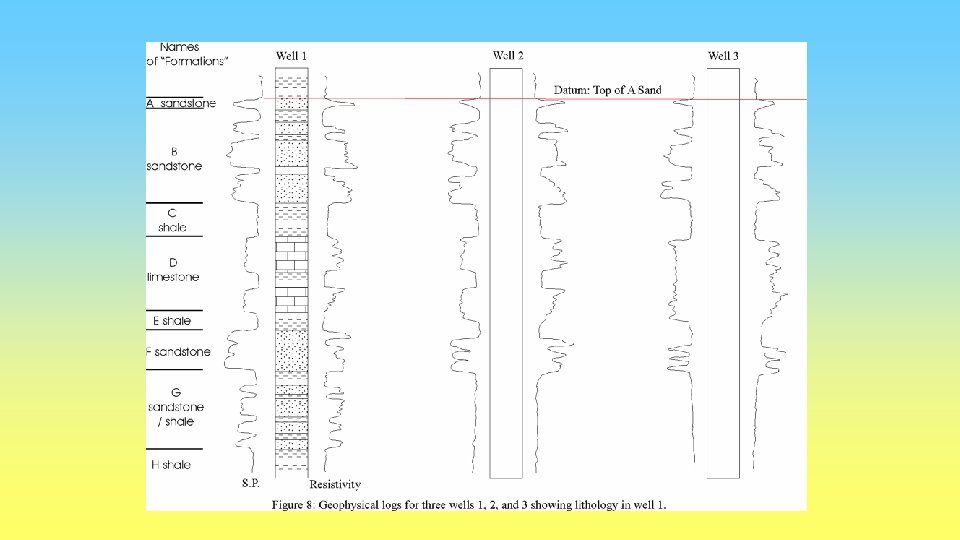
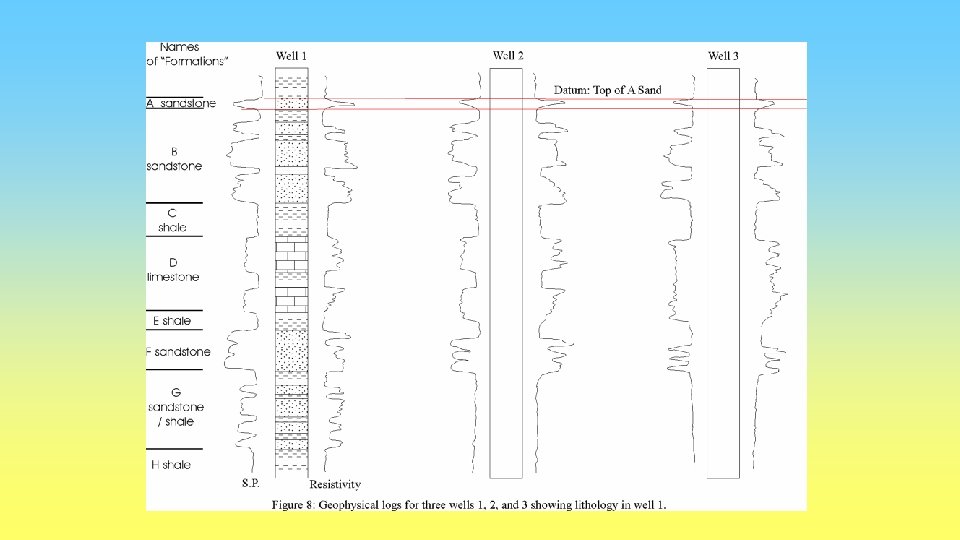
Geophysical properties • One can correlate using geophysical properties • Fig. 8 (p. 11) shows a “real” case
And so on. . . ? But what’s going on here?
You’ll have similar “problems” here.
…and • • Work neatly (in pencil). Use coloured pencils. Use a ruler (draw straight lines) across columns. ERASE mistakes • Ask questions to clarify any issues.