Geographic Information Systems GIS M Neilsen GRASS GIS
 M. Neilsen GRASS GIS Quantum GIS World Wind GIS, NASA")
 GIS capabilities – GRASS features Data structures in")


 Each layer has 3.")


 projection, and it")


statistics")


- Slides: 37
Geographic Information Systems (GIS) M. Neilsen GRASS GIS Quantum GIS World Wind GIS, NASA ESRI Arc. GIS * some content is from Grass GIS User’s Guide, Quantum GIS User’s Guide, and Wireless and GIS, Radim Blažek, et. al, Trento, Italy, and GRASS GIS for Anthropologists by Isaac Ullah
Outline 1 Geographic Information Systems (GIS) GIS capabilities – GRASS features Data structures in GIS GRASS vector architecture 2 Vector network analysis Shortest path Steiner trees Allocation of sources 3 From Web. GIS to portable GIS Map. Server Portable GRASS Linking GRASS to other Free Software 4 Conclusions – GIS and wireless
Features of a GIS managing and generating spatial data, usually in a projected coordinate systems spatial data analysis: - map algebra, buffering, filtering etc. - image processing - vector network analysis - (geo) statistics - much more. . . data visualization Snapshot of a GRASS session
GRASS: Free Software GIS, Quantum GIS – Shareware GUI, ESRI Arc. GIS - Commercial GRASS is a fully featured Open Source GIS released under GNU General Public License (GPL) free availability of source code (1. 1 million lines of C code) portability: Linux, SUN, Mac. OSX, MS-Windows, i. PAQ, Zaurus, SGI, . . . stable version 5. 0, based on more than 15 years of development modular command structure: no monolithic software vital development team of around 10 core developers with worldwide contributions GRASS development sites GRASS CVS Server (Germany): Centralized code repository Main site at ITC-irst: http: //grass. itc. it GRASS software web sites: mirrors of http: //grass. itc. it
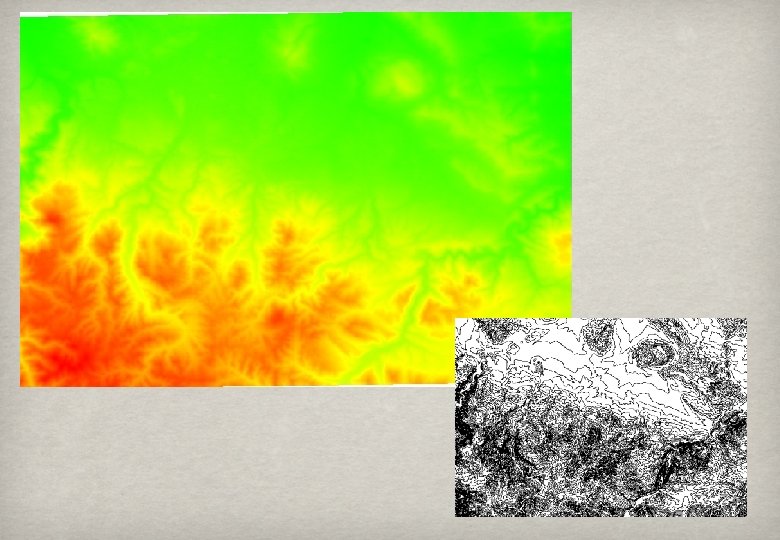
GIS data structures – Raster 2 D raster map: pixels Data structure: x, y, value Image Raster map 3 D raster volume: voxels Data structure: x, y, z, value Isosurfaces representation: relative humidity
GRASS raster applications 2 D raster application Interpolation of raster surfaces from distributed point data; e. g. , soil samples Available interpolation methods bilinear interpolation cubic convolution inverse distance weighted average (IDW) nearest neighbour resampling regularized splines with tension (RST) Field interpolation from local measurements with RST
GRASS raster applications 2 D raster application Impact analysis by distribution models Noise dispersion from highway
GRASS raster applications 2 D raster application Spatial diffusion algorithms Average territory accession time from main road network
GIS data structures – Vector 2 D vector map Data structure x 1, y 1, [x 2, y 2, . . . , ], ID, linetype 2 D or 3 D TIN (triangulated 3 D vector map irregular Data structure network) x 1, y 1, z 1, [x 2, y 2, z 2, . . . , ], ID, linetype 3 D CAD drawings in GRASS (3 D faces)
GRASS vector data structures GRASS 5. 1 vector geometry types point node line vertex nt s e eg gm me se n boundary centroid t 3 D face 3 D kernel se vertex Spatial index is generated (increased access speed) Vector Network library is implemented Line dary vertex Vector Architecture Features node nt vertex node bou n Vector topology is generated e gm centroid vertex Area
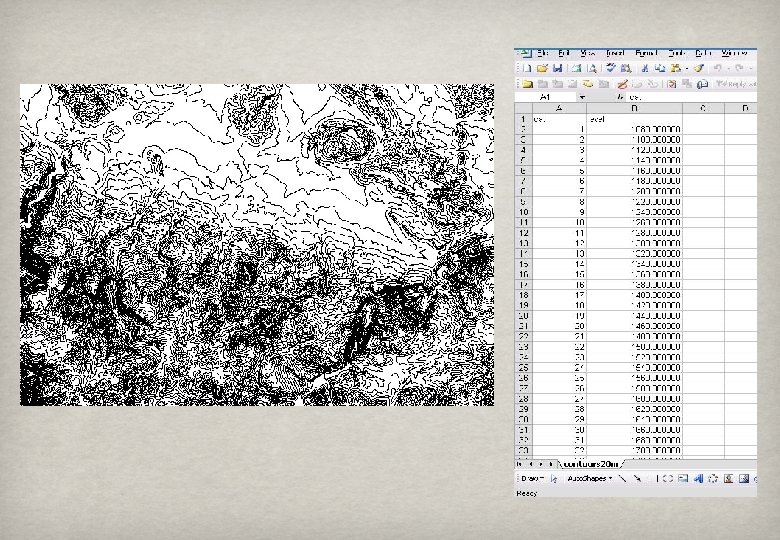
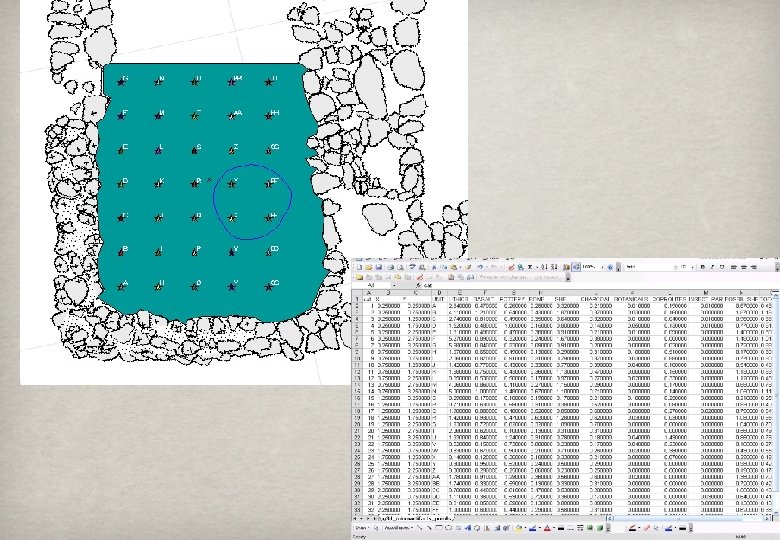
Vector Data • • • Discreet geometrical objects which are either points, lines, or polygons Vertices are placed by X and Y location for all vector types, and shapes are made by geometry For line and polygons, the vertices are joined by lines according to a function Attributes are associated with each shape Attributes are stored in a database of info (and therefore each object can be multidimensional) Easy database editing with Excel/Open Office (most are in. dbf format)
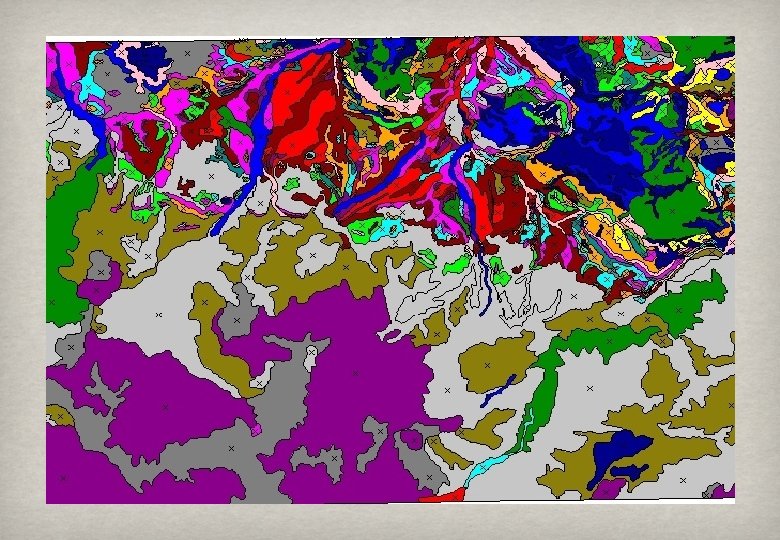
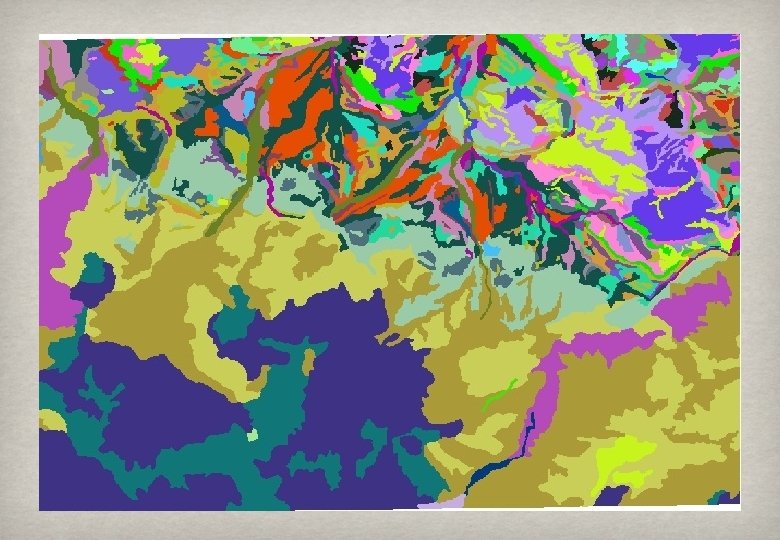
Raster Data • • Continuous data (a matrix of values) Each layer has 3. 5 dimensions of data Multiple layers can be stacked to represent many dimensions of data Display of data can be adjusted and tweaked for heuristic analysis Raster surfaces can be interpolated from discreet (ie. vector) data Can map fuzzy datasets, and so can be used to model all sorts of non-categorical data Complex statistics and math can be done at each pixel on single layers or as functions of two or more layers
Which is Better? • • It depends on your needs Vectors are better for associating many data types with one spatial object (i. e. , site point) in one file Vectors can only be used to represent discreet phenomena Raster's are better at representing massive amounts of spatially differing data They are also better for doing mathematical operations on that data They can represent discreet data, but only in one dimension per layer Resolution counts! As do extents!
A Quick Note on Projections • Maps are flat representations of a round world • Different projections are different ways to mathematically “unbend” curvilinear distances into flat distances • Projections also have different Datum point from which all measurements are tied back to the Earth • While you have absolutely no need to know how or why projections work, you should know about two of the major types and what the difference between them are.
A Quick Note on Projections • One is the Latitude/Longitude (Lat/Lon) projection, and it works worldwide • However, all distances in this type of projection are measured as fractions of the Earths diameter (degrees, minutes, and seconds or decimal degrees) • The other is the Universal Transverse Mercator (UTM) projection, which is broken up into a series of zones across the world • It’s units are meters, but you must stay within only the correct zone, or your data will become distorted
Lat/Lon Projection
UTM Projection
UTM Zones
GRASS 5. 1 vector architecture Modules/User Geometry Attributes Vector library Native SHAPE file DBMI library OGR Post. GRASS Postgre. SQL Files: GML, File Arc, . . . ODBC my. SQL. DBF Post. GIS Postgre. SQL e. g. Oracle My. SQL File
GRASS 5. 1 Vector Architecture Sample Implementation in Post. GRASS Table transport_geometry Coordinates FID 355134 577245 3 5 355063 577538 transport_category FID Field Cat 3 1 7 5 2 13 Table 1 roads ID 7. . . Attributes Table 2 crossroads ID 13. . . Attributes Vector geometry can be linked to Vector map one or several attribute tables via “Field” definition.
Vector network analysis with Directed Graph Library The Directed Graph Library: library for vector network analysis http: //grass. itc. it/dglib/ Directed Graph Library provides underlying functionality for GRASS commands shortest path, Steiner trees, allocation of sources using edge and node weighted, oriented graphs: B B Application: shortest path find shortest path based on traveling costs: calculated from lines lengths or attributes read from DBMS table(s) A A Shortest path from A to B
Vector network analysis with Directed Graph Library Network analysis based on Directed Graph Library Application: Minimum Steiner tree Subgraph connecting various network nodes at minimum costs Hospitals connected by broadband cable
Vector network analysis with Directed Graph Library Network analysis based on Directed Graph Library Application: Allocation of subnetworks to centers Travel cost calculation based on line length or vector attributes Patches of fire brigades in a city
GRASS and Geostatistics GRASS linked to R stats and XGOBI Data may be kept in database R and XGOBI in GRASS environment snapshot
GRASS on the road: Mobile GIS Port of GRASS to handheld devices: “baby. GRASS” GRASS on Zaurus GRASS on i. PAQ
Map. Server: Web. GIS Map. Server on Mobile Phone Map. Server for data gathering and dissemination at ITC-irst
GRASS linked to other Free Software Interoperability and data accessibility Online data dissemination (Geo)statistics Map production Databases
GRASS and Wireless Applications What can GRASS provide for wireless applications? An environment for real data geocoding Tools for data collection, tools for planning Storage and management of spatial data with attributes Data analysis – statistics: interactive and automated Implementation of predictive models Data visualization and distribution
World Wind GIS, NASA • Open source, Java GIS Engine and Libraries
World Wind GIS
World Wind GIS