Geographic Information Systems GIS Data Models 1 Components


 Vector Every position has a pair of coordinates. ► Lines")


 Raster A matrix consists of regular grid cells ► Positions")
 Raster Data consist of mostly attributes ► A header file")
 Raster")
 Advantages and Disadvantages Raster ► Vector ►")


 Run Length ► Data are recorded in the order")
 Run Length 11 11 3 3 3 3 11, 4; 3,")
 Quadtrees ► Subdividing a region into quadrants until each")
 Quadtrees")
 Quadtrees")
 Non-topological Structure Polygons are the basis ► One polygon")
 Non-Topological Structure Storing coordinates of 1 2 two polygons: and A")
 Topological Structure Lines are the basis ► Polygons and nodes are")
 Topological Structure 1 Storing coordinates of two polygons: and 1 Polygon")
 Topological Structure Polygon = a list of lines ► Line =")


- Slides: 36
Geographic Information Systems GIS Data Models
1. Components of Geographic Data Spatial locations ► Attributes ► Topology ► ► Time
Components – Spatial Locations Specified with reference to a common coordinate system ► Spatial features can be represented as points lines polygons volumes ► grids
Components - Attributes Nominal - qualitative, e. g. , grasses, trees, buildings, … ► ► Ordinal - rankable quality, e. g. , high, medium, low ► Interval - quantitative but not ratio, e. g. , 400 F, 800 F ► Ratio - absolute quantities, e. g. , p, e, -96. 345, …
Components - Topology Spatial relationship between geographic features ► ► Adjacency Containment Connectivity etc. Time Presently treated as an attribute
2. Data Models ► Real world entities and spatial entities
Data Views – Objects and Fields ► Object and Field View Objects - Are discrete or have identifiable boundaries - Have attributes ► ► Fields - Are continuously - Attributes vary across the field
Data Models Vector data model ► Raster data model ► courtesy: Mary Ruvane, http: //ils. unc. edu/
Data Models - (1) Vector Every position has a pair of coordinates. ► Lines and polygons are constructed by connecting a series of points. ► Points, lines, and polygons are used to represent geographic features. ►
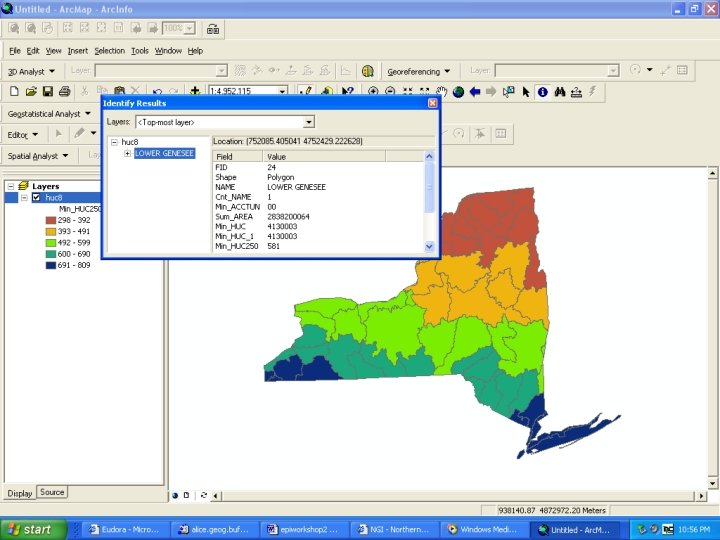
Incidence of Viruses Epidemiological Studies- Disease Tracking ESRI, GE Small. World
Positive Snail Prediction of Xichang Study Site using the land-cover map and field snail survey including 93 positive snail sites and 800 non-positive snail sites Positive snail 0. 00 - 0. 03 0. 04 - 0. 13 0. 14 - 0. 23 0. 24 - 0. 33 0. 34 - 0. 60 Lake ± 0 1, 650 3, 300 6, 600 Meters
Data Models - (2) Raster A matrix consists of regular grid cells ► Positions are defined by column and row numbers ► Each cell has a single value ►
Data Models - (2) Raster Data consist of mostly attributes ► A header file stores (1) Number of rows and columns, (2) Cell size, and (3) Coordinates of the origin ► Coordinates of a location can be converted on the fly ►
Data Models - (2) Raster
2 Data Model (3) Advantages and Disadvantages Raster ► Vector ►
Ad and Disad - Raster ► Advantages - It is a simple data model - Overlay operation can be easily implemented - High spatial variation is efficiently represented ► Disadvantages - It is less compact - Topological relationships are difficult to represent - The output is less aesthetically pleasing
Ad and Disad - Vector Advantages - It is a compact data model - It is efficient in coding topology - The output closely approximate hand-drawn maps ► Disadvantages - It is a complex data model - Overlay operations are difficult to implement - The representation of high variation is inefficient ►
Readings ► Chapter 3
Geographic Information Systems GIS Data Structures
GIS Data Structures World views - object - field ► Data models - vector - raster ► Data structures - non-topological and topological - run-length and quadtrees ►
GIS Data Structures ► Raster data structures - Run length - Quadtrees ► Vector data structures - Non-topological structure - Topological structure
3 Raster Data Structures (1) Run Length ► Data are recorded in the order of Attribute 1, number of cells in the run; Attribute 2, number of cells in the run; …
3 Raster (1) Run Length 11 11 3 3 3 3 11, 4; 3, 4; 11 11 3 3 11 11 11 3 5 5 11 11 5 5 5 11, 4; 3, 4; 11, 3; 3, 1; 5, 4 … 11 11 5 5 5
3 Raster Data Structures (2) Quadtrees ► Subdividing a region into quadrants until each quadrant contains only one class - variable resolution
3 (2) Quadtrees
3 (2) Quadtrees
4 Vector Data Structures (1) Non-topological Structure Polygons are the basis ► One polygon at a time, the data structure records coordinates of the outline of the polygon ► There is no topology, and shared boundaries are recorded twice ►
4 Vector (1) Non-Topological Structure Storing coordinates of 1 2 two polygons: and A (x 1, y 1) 1 Polygon x 1, y 1; x 2, y 2; x 3, y 3; x 4, y 4; x 5, y 5; x 1, y 1. Polygon 2 x 1, y 1; x 6, y 6; x 7, y 7; x 2, y 2; x 1, y 1. 1 (x 2, y 2) 2 B (x 2, y 2)
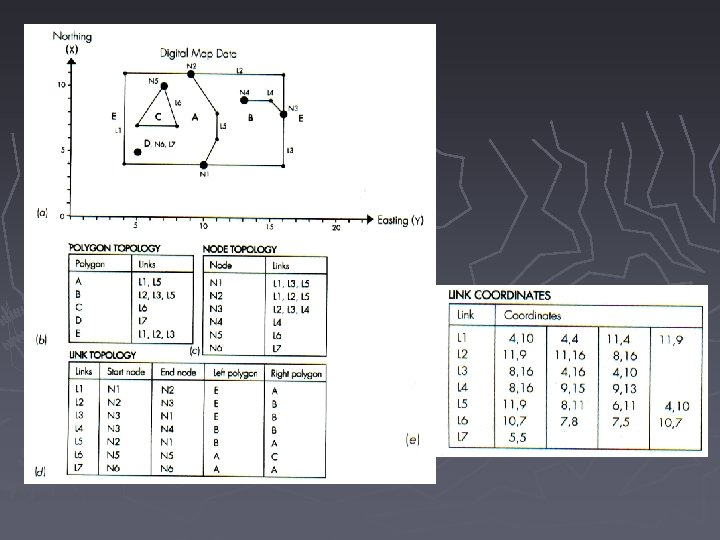
4 Vector (2) Topological Structure Lines are the basis ► Polygons and nodes are defined by lines ► No lines are duplicated ► Lines and nodes can be referenced to more than one polygons ► All polygons have unique identifiers ► Island hole polygons can be uniquely represented ►
4 Vector (2) Topological Structure 1 Storing coordinates of two polygons: and 1 Polygon Line 1, Line 2 2 Polygon Line 2, Line 3 (x 2, y 2) e 3 2 Lin e 2 1 Lin e 1 (x 1, y 1) Line 1 x 2, y 2; x 3, y 3; x 4, y 4; x 5, y 5; x 1, y 1; Line 2 x 1, y 1; x 2, y 2; Line 3 x 1, y 1; x 6, y 6; x 7, y 7; x 2, y 2; 2
4 Vector (2) Topological Structure Polygon = a list of lines ► Line = a set of coordinates ► Point = a line with no length ►
Topological- the Arc-Node Model Arc - a line starting and ending at a node ► Node - intersection point where two or more arcs meet or it is a dead end ► Polygon - a closed chain of arcs ►
Arc-Node Model Arc coordinate data table Polygon topology table Node topology table Arc topology table
Readings Chapter 3