Geographic Information Systems GIS Analysis and Modeling 6


 performs a")


 and Old")


- Slides: 38
Geographic Information Systems GIS Analysis and Modeling
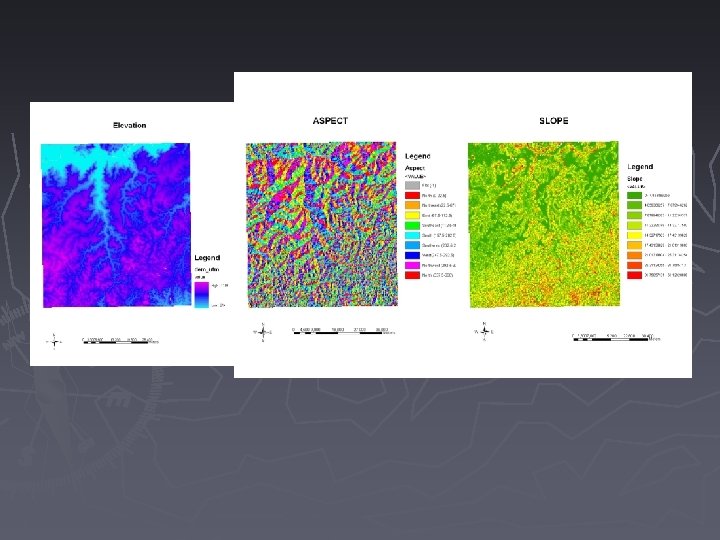
6. Topographic Functions ► Topographic functions - The calculation of topographic value at a specific location or in the vicinity
6. Topographic Functions. . ► Elevation ► Slope angle - rate of change in elevation, by degree of arc or by % slope ► Slope aspect - the direction that a surfaces
6. Topographic Functions. . ► Perspective view - Creates a 3 -D block diagram showing how surface appears from a defined position - Is useful in showing the 3 -D context of features on a surface, such as a natural landscape http: //www. sdsmt. edu/online-courses/geology/mprice/geo 416/lecture 9. ppt
3 -D Perspective
Bowling Green Z=10 J. Yan, SUNY Buffalo
J. Yan, SUNY Buffalo
A. Toy, SUNY BUffalo
TINs
Color infrared composite of the IKONOS draped over the DEM as viewed from the west side of the study area to the east from an elevation of 10, 000 m, Xichang, China Xu, University of Utah, Gong, UC-Berkeley
Fisher, Erich , 2005. 3 D GIS archaeology in South Africa: archeologists working along the South African southern coast use multidimensional GIS applications to model Pleistocene caves and paleo-environments reconstructing the landscape CA. 420, 000 to 30, 000 BP. GEO: connexion, 4 (5): 40
7. Neighborhood Operations ► Assigning attributes to a target location according to the evaluation of neighborhood characteristics
7. Neighborhood Operations. . ► Three basic parameters: - One or more targets - A neighborhood around each target - A function performed within the neighborhood ► Neighborhood geometry - Square - Rectangular - Circular with a size selected by the operation
7. Neighborhood Operations. . ► Evaluation functions - Average, maximum, minimum, diversity, majority, etc.
7. Neighborhood Operations. . ► Moving window approach - A function is executed for successive windows. Result of execution is written to the target cell Moving windows Average Diversity 3 4 5 0 1 6 8 2 1 5 4 3 2 7 6 4 3 4 1 2 1 x x x 3 8 1 9 1
Neighborhood Analysis-Density Surface http: //geology. wlu. edu/harbor/geol 260/lecture_notes/notes_neigh 1. html
8. Spread Functions An evaluation of phenomena that accumulate with distance ► It calculates the running total of a variable at each step when moving outwards at all directions from one ore more starting points, and writes the running total to an accumulation file ► ► Friction surface or Terrain trafficability
The calculation of distance with barriers
Generation of a travel-time data layer Land use data layer Friction surface
The calculation of distance using a spread function Diagonal distance by Pythagorean rule
► Travel time calculation Friction surface data layer Start point data layer Cumulative travel time data layer
► Travel-time analysis procedure - A spread function is used to calculate a travel-time map from the friction surface and the start points Friction surface data layer Start points data layer Travel time map
Least-Cost Analysis: Path 2 Distance between stops: Athens to Lathouriza: About 25 km or 15. 5 mi Lathouriza to Thorikos: About 36 km or 22 mi Thorikos to Sounion: 13 km or 8 mi Total: 74 km or 45. 5 mi From Erin Warford . .
9. Stream Functions ► The stream function (also termed a seek function) performs a directed search outward, step by step, from a starting point based on a set of decision rules. The procedure stops when the rules are violated ► The output is a trace of paths
9. Stream Functions. . ► Applications – use of a seek function to model flow path
9. Stream Functions. . ► Application – find path through a sewer system from point A to point B
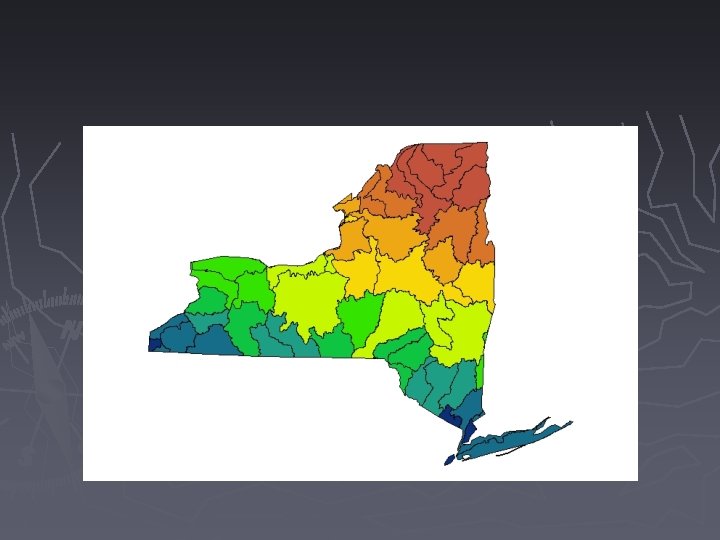
Stream Functions. . ► Application – delineate watershed boundaries
10. Viewshed Analysis ► The concept of viewshed: the delineation of areas that are viewable from a point
10. Viewshed Analysis ► Data sources for viewshed analysis Topography Surface feature locations & heights of obstructions Viewer positions Targets (optional) Viewshed map showing areas visible from one or more viewing positions. Shaded areas are hidden from view
10. Viewshed Analysis ► Viewing parameters - Maximum viewable line-of-sight distance - Location of viewing point - Vertical and horizontal angle of view - Viewing direction
► Viewing parameters
Viewshed The above maps show the results of analyses around Saddleback (left) and Old Blue (right) mountains. On the maps, green areas are visible from the location cited (shown in yellow), while gray areas are obstructed from view. The Appalachian Trail is shown in red. http: //www. northgeo. com/services/carto/projects/LURCViewshed. htm
► scenic lookouts M. Dolce, Buffalo State College
From Erin Warford
Viewshed esri
Readings ► Chapter 5, 6, 9, 10