Geographers Tools Geography geo Earth and graphy to

 – Calculated the circumference")


 – the")


; Flemish cartographer, philosopher, and mathematician –")

 • SIZE")

; American geographer and cartographer –")


; German historian and cartographer –")


 ; American geographer and cartographer")

 - Steve Waterman (d. 2015) - Modeled after")


- Slides: 26
Geographers Tools • Geography “geo” Earth and “graphy” to write – From the Greek ‘geographia’ • Maps – a 2 -dimensional (flat) model of the 3 dimensional Earth – reference – communication • Cartography – the science of map making • Spatial Organization – the location and patterns of people, places, and events that connect us to our landscapes (physical and human)
Ancient Guys to Know • Eratosthenes (276? – 194? BCE) – Calculated the circumference of the Earth within 15% – Combination of geography and geometry! • Ptolemy – Calculated the circumference of the Earth as 9, 000 miles smaller and regarded as truth – Developed a grid system that became a forerunner for latitude and longitude
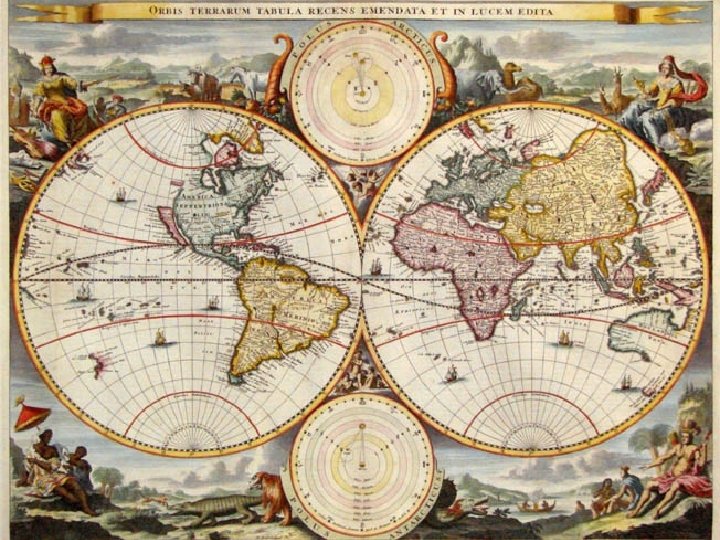
Eratosthenes’ Map
What does this map tell us?
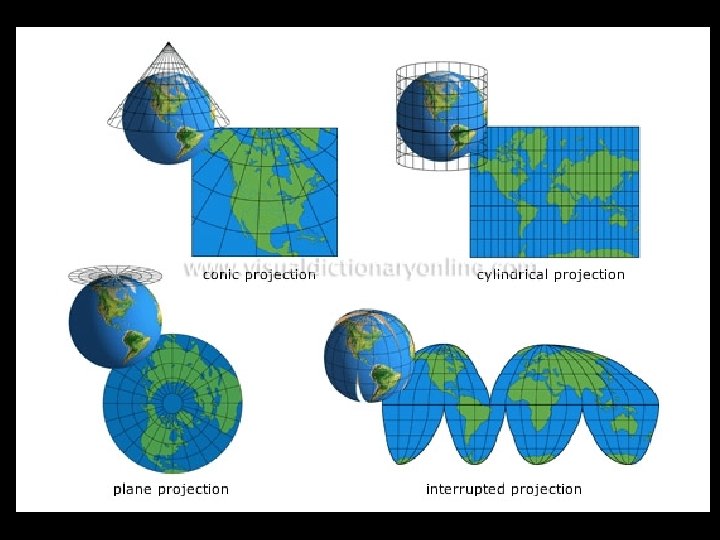
2 -D Distorts • Globe is accurate, but limited • Projections (Map) – the scientific method of transferring locations on Earth’s surface to a flat map – Shape – Distance – Size – Direction
Mercator
Mercator
Mercator Projection • Gerardus Mercator (1512 – 1594); Flemish cartographer, philosopher, and mathematician – Created the Mercator Projection in 1569 – 1569: Historical Context: Age of Exploration – Fast Fact: first used the word atlas to describe a collection of maps
Loxodromes/Rhumb Lines – straight lines of constant compass bearing; produced by Mercator’s projection - Meridians and parallels cross at 90 degrees - Excellent for navigation - Beloved by explorers
So What’s the Problem with Mercator? • DIRECTION is true (thanks loxodromes!) • SIZE is distorted (especially at the poles) – Greenland Antarctica
Robinson Projection
Robinson Projection • Arthur H. Robinson (1915 – 2004); American geographer and cartographer – Created in 1961 - 63 in response to Rand Mc. Nally - Adopted by National Geographic in 1988, later abandoned in favor of Van der Grinten - Specifically intended to solve the problems of other flat projections (neither equal area, or preserving land mass, nor conformal, or preserving angles)
So What’s the Problem with Robinson? • EVERYTHING is a little bit distorted – Shape – Size – Distance – Direction • Helpful for general reference; often used in classrooms
Peters Projection
Peters Projection • Dr. Arno Peters (1916 – 2002); German historian and cartographer – Introduced his version in Germany at a conference in 1974 - English version published in 1983 - Generated firestorm of debate immediately - Eurocentric ideas vs. misleading maps for 500+ years (interested in political propaganda) - Based on Rev. James Gall’s projection, one of the first equal area maps – now commonly the Gall-Peters projection
So What’s the Problem with Peters? • SIZE is true (land masses are equal and not Eurocentric) • SHAPE is distorted (looks unfamiliar!)
Goode-Homolosine Projection
Goode-Homolosine Projection • John Paul Goode (1862 – 1932) ; American geographer and cartographer – Introduced in 1923 as the “Evil Mercator” - Attempt to offer an alternative to Mercator when representing global relationships - Equated map projections to an orange peel - Interruptions and lobes - In its most common form, the map interrupts the North Atlantic, the South Pacific, the Indian Ocean, and the entire east/west meridian of the map.
So What’s the Problem with Goode. Homolosine? • INTERRUPTED – points on the map are not continuous and therefore distorts distance; however, continents and regions are mostly intact rather than separated (sometimes regions are repeated in order to avoid interruption) • SIZE– preserved to insure accurate representation of the continents
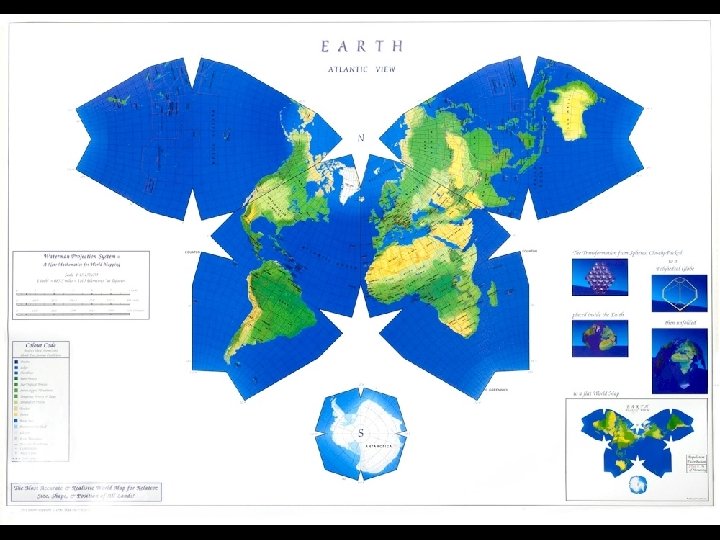
Cartography is Concurrent Waterman Butterfly (1996) - Steve Waterman (d. 2015) - Modeled after Bernard J. S. Cahill’s (1866 – 1944) rubber ball/butterfly map - Life long pursuit to eliminate distortion in 2 Dimensional maps - All continents are uninterrupted
Map Projection Humor What does your favorite map projection say about you? https: //xkcd. com/977/ Waterman Butterfly (1996) http: //www. watermanpolyhedron. com/worldm ap. html
NEXT WEEK: REGIONALIZATION