
GEOG 596 A Capstone Project Proposal Species vulnerability
GEOG 596 A Capstone Project Proposal Species vulnerability to climate and land use changes in Saguaro National Park’s Rincon Mountain District by Kim Struthers Advisor – Justine Blanford
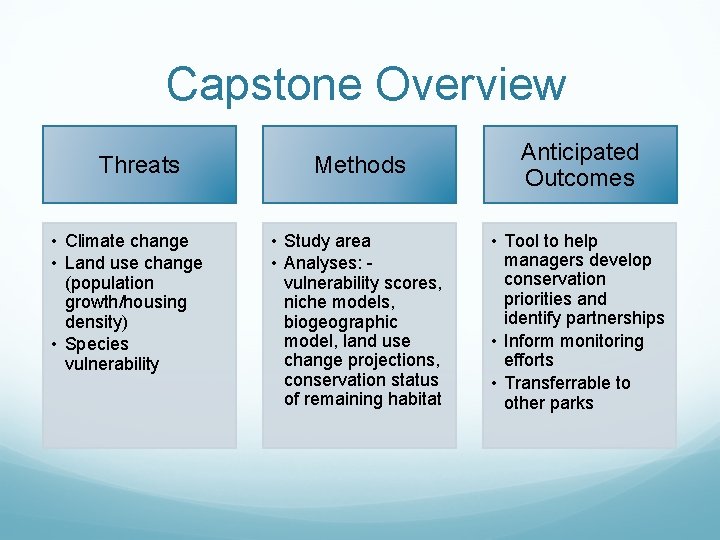
Capstone Overview Threats • Climate change • Land use change (population growth/housing density) • Species vulnerability Methods Anticipated Outcomes • Study area • Analyses: vulnerability scores, niche models, biogeographic model, land use change projections, conservation status of remaining habitat • Tool to help managers develop conservation priorities and identify partnerships • Inform monitoring efforts • Transferrable to other parks
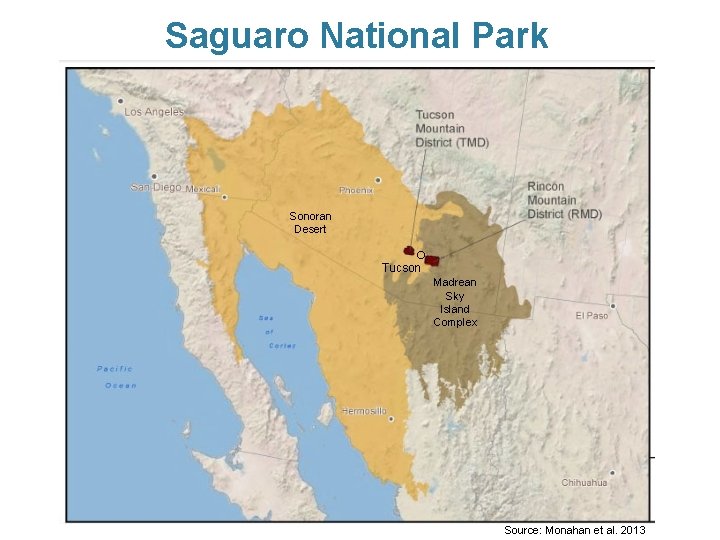
Saguaro National Park Sonoran Desert ° Tucson Madrean Sky Island Complex Source: Monahan et al. 2013
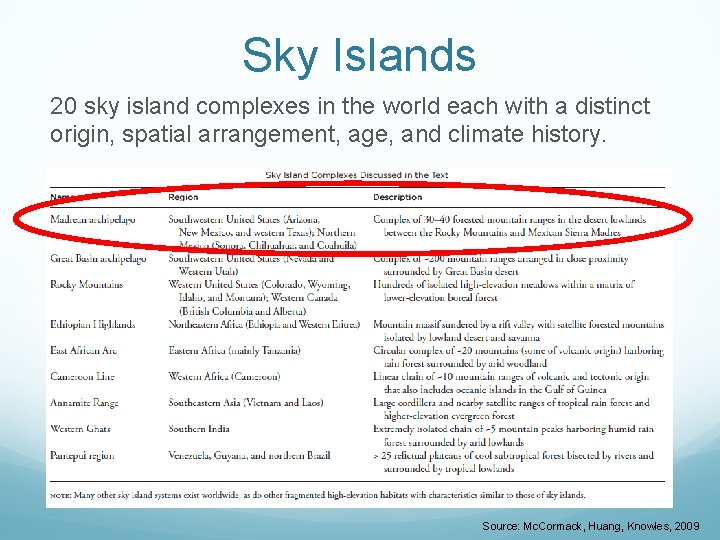
Sky Islands 20 sky island complexes in the world each with a distinct origin, spatial arrangement, age, and climate history. Source: Mc. Cormack, Huang, Knowles, 2009
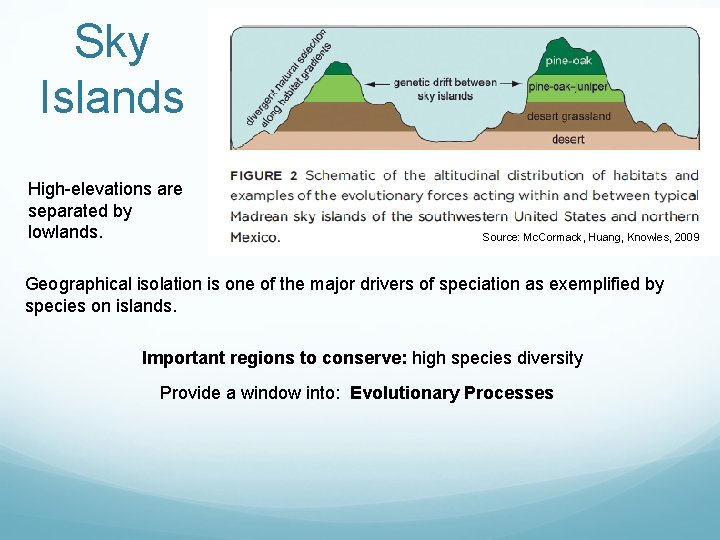
Sky Islands High elevations are separated by lowlands. Source: Mc. Cormack, Huang, Knowles, 2009 Geographical isolation is one of the major drivers of speciation as exemplified by species on islands. Important regions to conserve: high species diversity Provide a window into: Evolutionary Processes
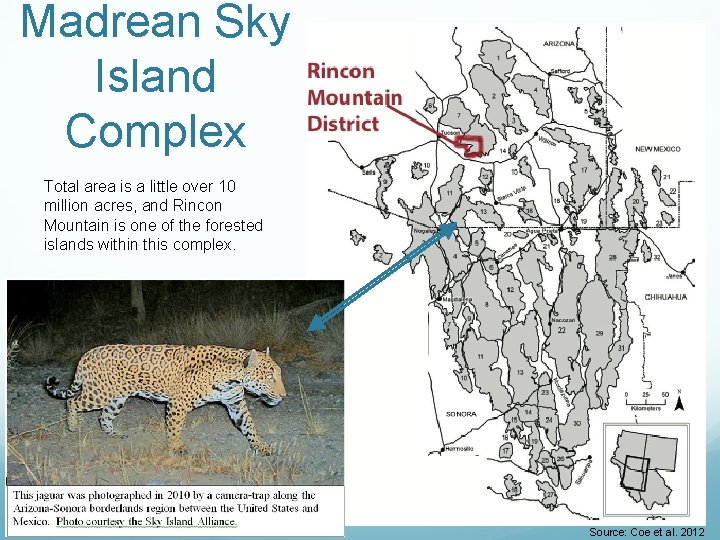
Madrean Sky Island Complex Total area is a little over 10 million acres, and Rincon Mountain is one of the forested islands within this complex. Source: Coe et al. 2012
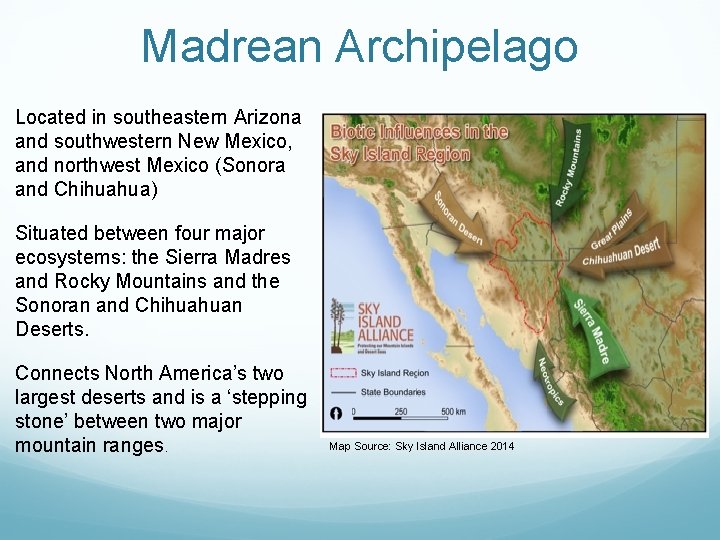
Madrean Archipelago Located in southeastern Arizona and southwestern New Mexico, and northwest Mexico (Sonora and Chihuahua) Situated between four major ecosystems: the Sierra Madres and Rocky Mountains and the Sonoran and Chihuahuan Deserts. Connects North America’s two largest deserts and is a ‘stepping stone’ between two major mountain ranges. Map Source: Sky Island Alliance 2014
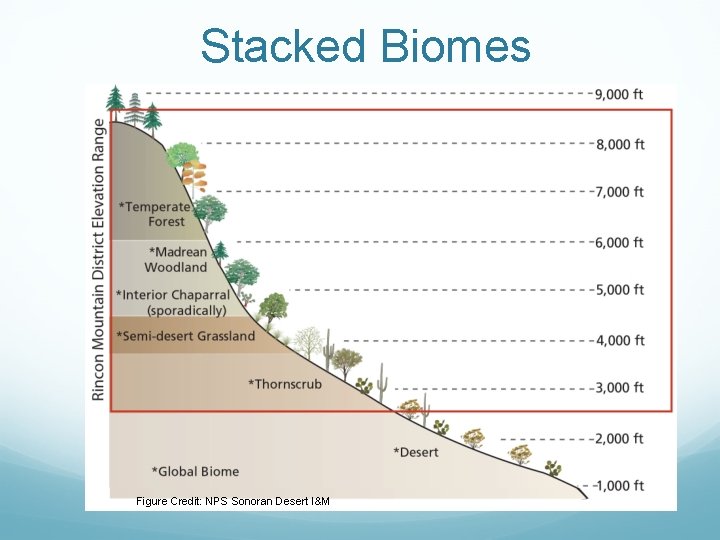
Stacked Biomes Figure Credit: NPS Sonoran Desert I&M
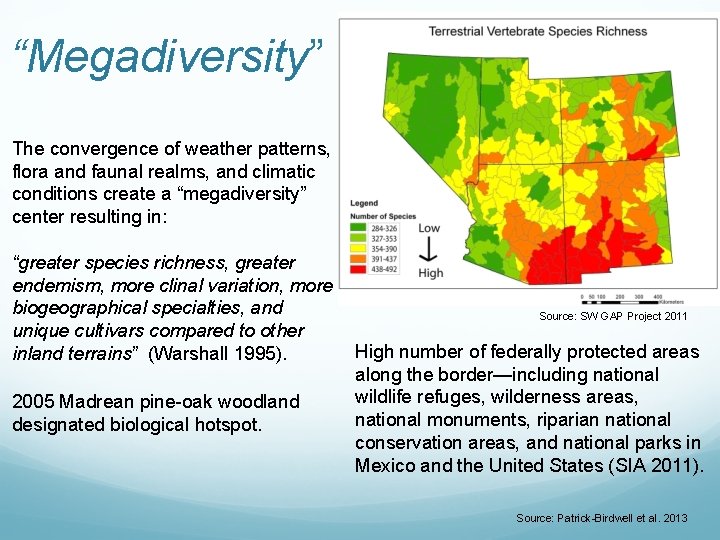
“Megadiversity” The convergence of weather patterns, flora and faunal realms, and climatic conditions create a “megadiversity” center resulting in: “greater species richness, greater endemism, more clinal variation, more biogeographical specialties, and unique cultivars compared to other inland terrains” (Warshall 1995). 2005 Madrean pine oak woodland designated biological hotspot. Source: SW GAP Project 2011 High number of federally protected areas along the border—including national wildlife refuges, wilderness areas, national monuments, riparian national conservation areas, and national parks in Mexico and the United States (SIA 2011). Source: Patrick Birdwell et al. 2013
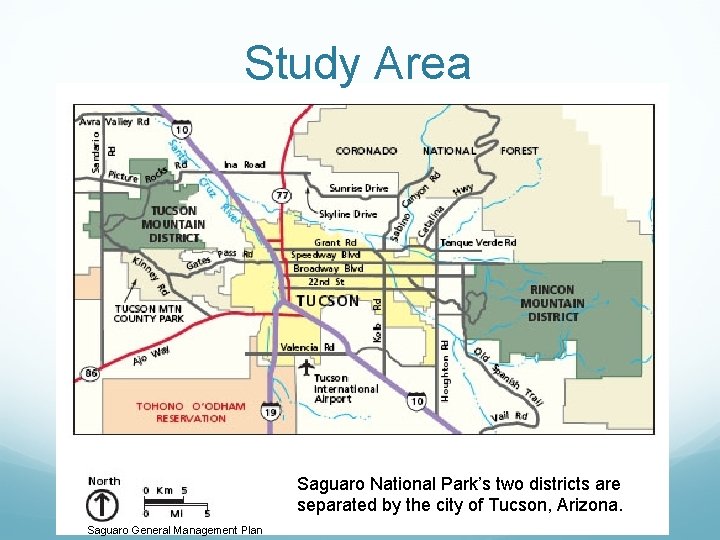
Study Area Saguaro National Park’s two districts are separated by the city of Tucson, Arizona. Saguaro General Management Plan
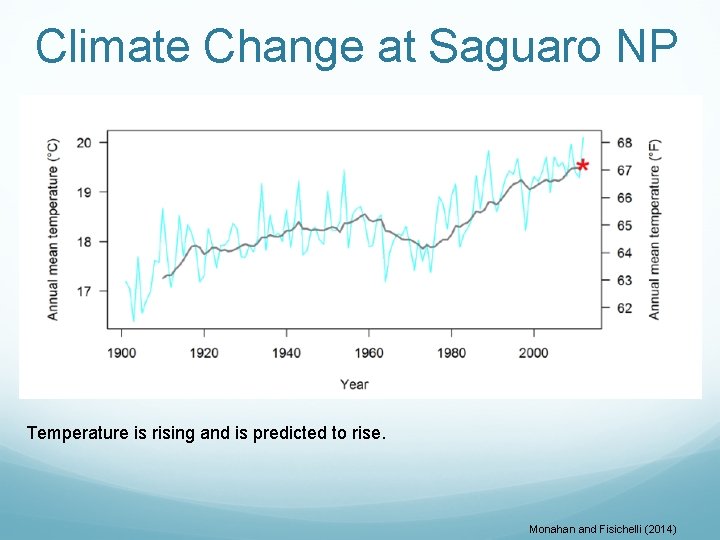
Climate Change at Saguaro NP Temperature is rising and is predicted to rise. Monahan and Fisichelli (2014)
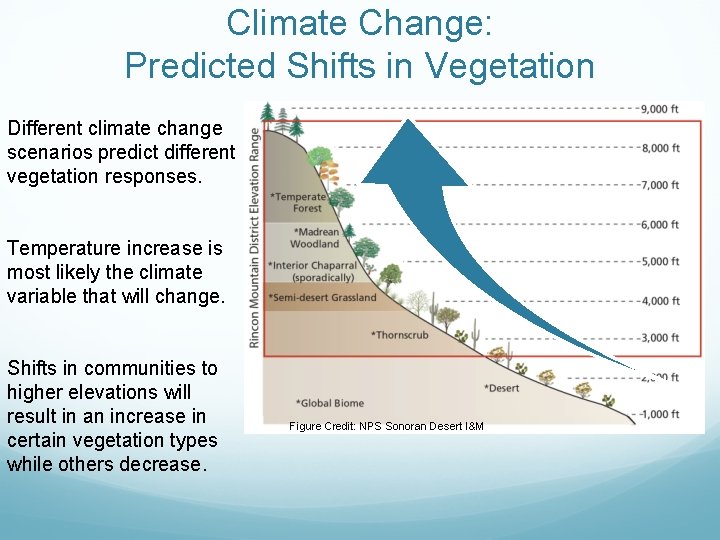
Climate Change: Predicted Shifts in Vegetation Different climate change scenarios predict different vegetation responses. Temperature increase is most likely the climate variable that will change. Shifts in communities to higher elevations will result in an increase in certain vegetation types while others decrease. Figure Credit: NPS Sonoran Desert I&M
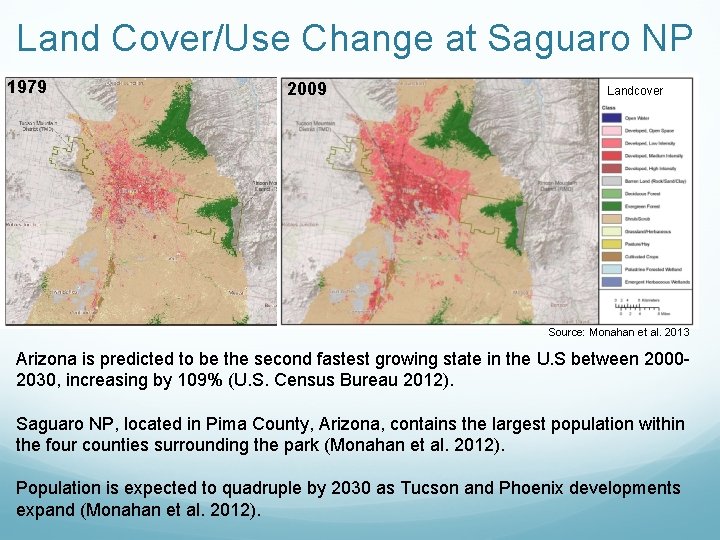
Land Cover/Use Change at Saguaro NP 1979 2009 Landcover Source: Monahan et al. 2013 Arizona is predicted to be the second fastest growing state in the U. S between 2000 2030, increasing by 109% (U. S. Census Bureau 2012). Saguaro NP, located in Pima County, Arizona, contains the largest population within the four counties surrounding the park (Monahan et al. 2012). Population is expected to quadruple by 2030 as Tucson and Phoenix developments expand (Monahan et al. 2012).
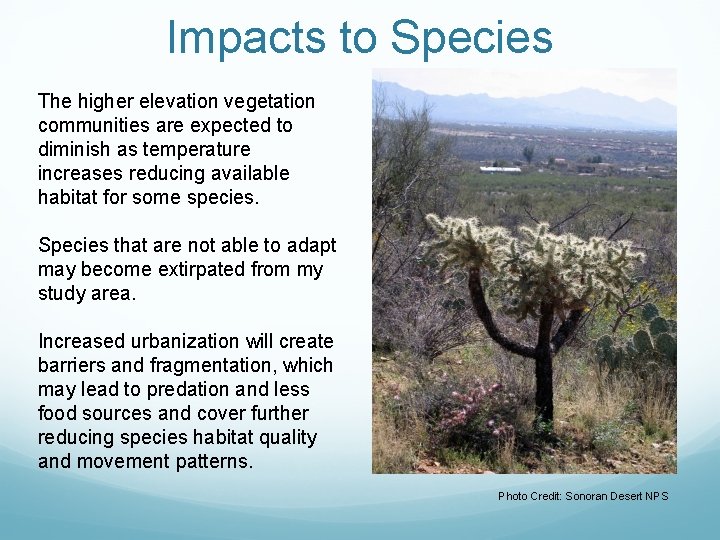
Impacts to Species The higher elevation vegetation communities are expected to diminish as temperature increases reducing available habitat for some species. Species that are not able to adapt may become extirpated from my study area. Increased urbanization will create barriers and fragmentation, which may lead to predation and less food sources and cover further reducing species habitat quality and movement patterns. Photo Credit: Sonoran Desert NPS
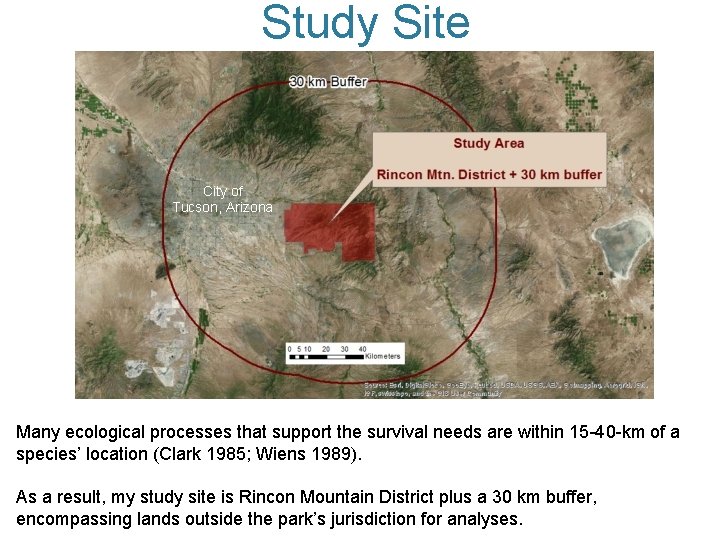
Study Site City of Tucson, Arizona Many ecological processes that support the survival needs are within 15 40 km of a species’ location (Clark 1985; Wiens 1989). As a result, my study site is Rincon Mountain District plus a 30 km buffer, encompassing lands outside the park’s jurisdiction for analyses.
Study Objectives Assess species vulnerability to climate change. Spatially assess species habitat areas relative to predicted climate and land use changes. Identify areas with highest species vulnerabilities to guide research, park management, and conservation efforts.
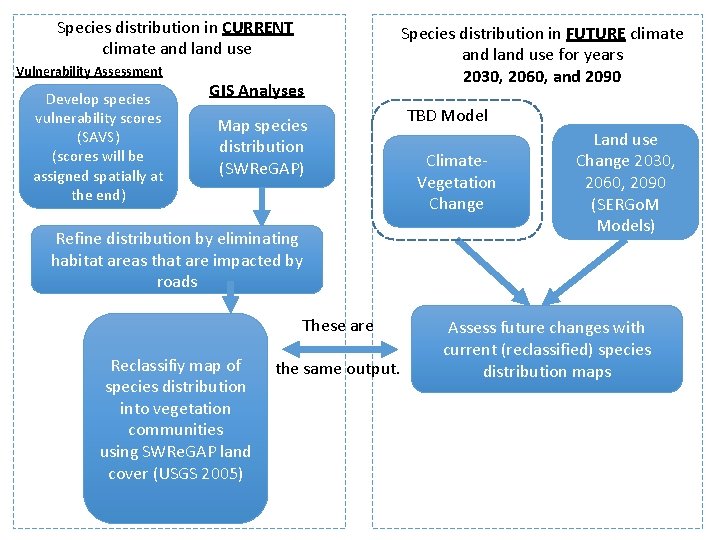
Species distribution in CURRENT climate and land use Vulnerability Assessment Develop species vulnerability scores (SAVS) (scores will be assigned spatially at the end) GIS Analyses Species distribution in FUTURE climate and land use for years 2030, 2060, and 2090 Map species distribution (SWRe. GAP) Refine distribution by eliminating habitat areas that are impacted by roads These are Reclassifiy map of species distribution into vegetation communities using SWRe. GAP land cover (USGS 2005) the same output. TBD Model Climate. Vegetation Change Land use Change 2030, 2060, 2090 (SERGo. M Models) Assess future changes with current (reclassified) species distribution maps
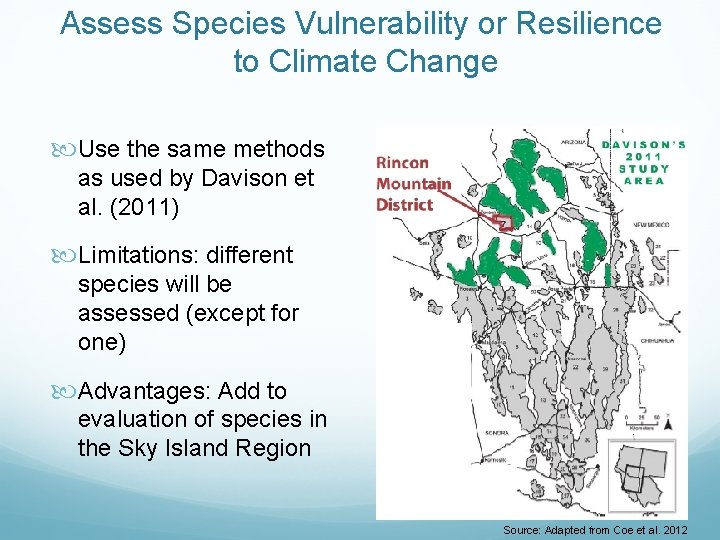
Assess Species Vulnerability or Resilience to Climate Change Use the same methods as used by Davison et al. (2011) Limitations: different species will be assessed (except for one) Advantages: Add to evaluation of species in the Sky Island Region Source: Adapted from Coe et al. 2012
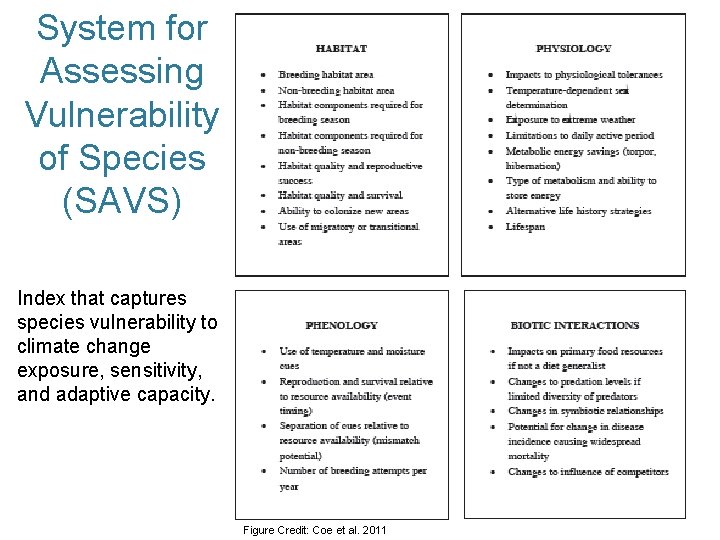
System for Assessing Vulnerability of Species (SAVS) Index that captures species vulnerability to climate change exposure, sensitivity, and adaptive capacity. Figure Credit: Coe et al. 2011
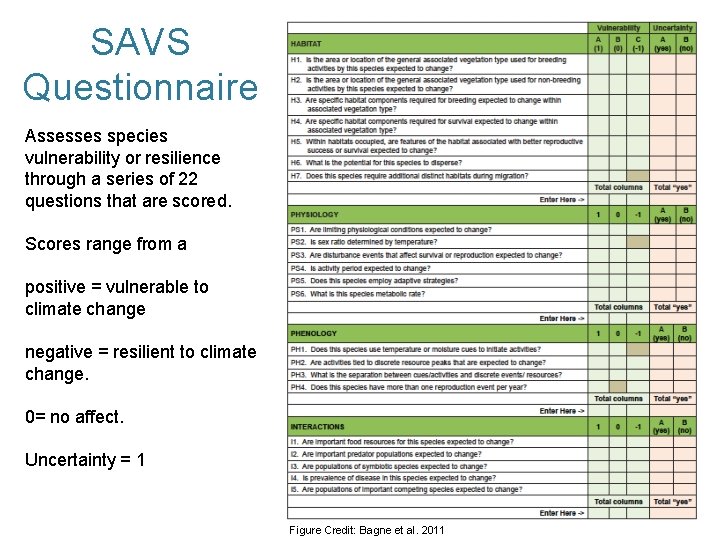
SAVS Questionnaire Assesses species vulnerability or resilience through a series of 22 questions that are scored. Scores range from a positive = vulnerable to climate change negative = resilient to climate change. 0= no affect. Uncertainty = 1 Figure Credit: Bagne et al. 2011
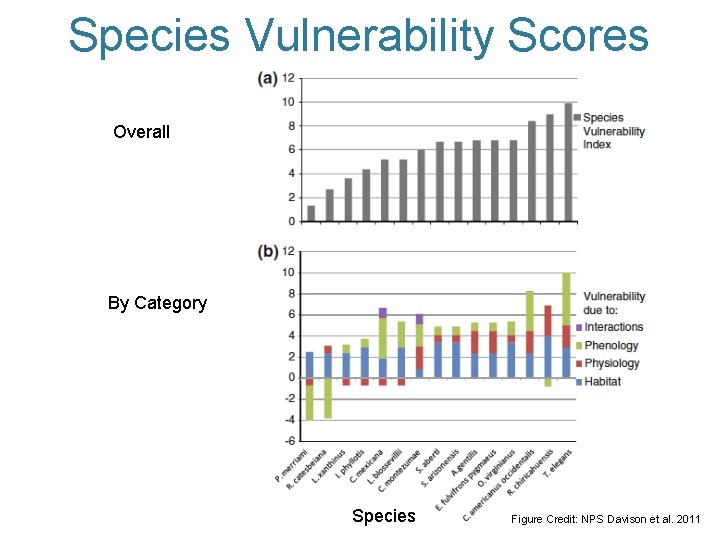
Species Vulnerability Scores Overall By Category Species Figure Credit: NPS Davison et al. 2011
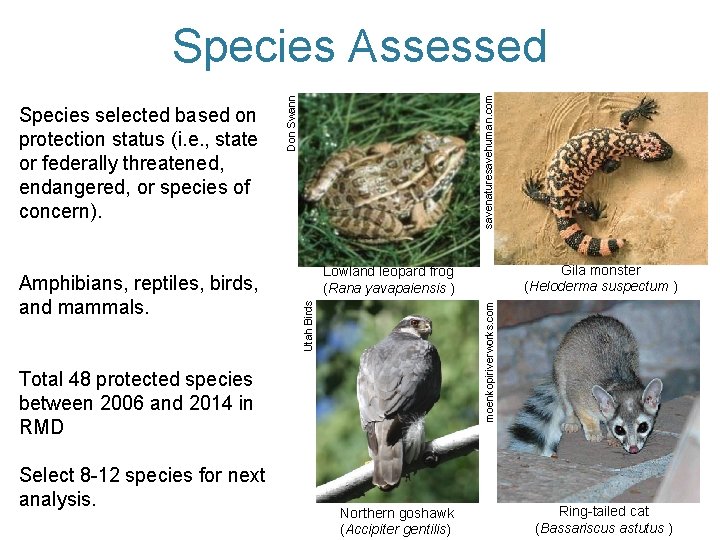
moenkopiriverworks. com Total 48 protected species between 2006 and 2014 in RMD Select 8 12 species for next analysis. Gila monster (Heloderma suspectum ) Lowland leopard frog (Rana yavapaiensis ) Utah Birds Amphibians, reptiles, birds, and mammals. Don Swann Species selected based on protection status (i. e. , state or federally threatened, endangered, or species of concern). savenaturesavehuman. com Species Assessed Northern goshawk (Accipiter gentilis) Ring tailed cat (Bassariscus astutus )
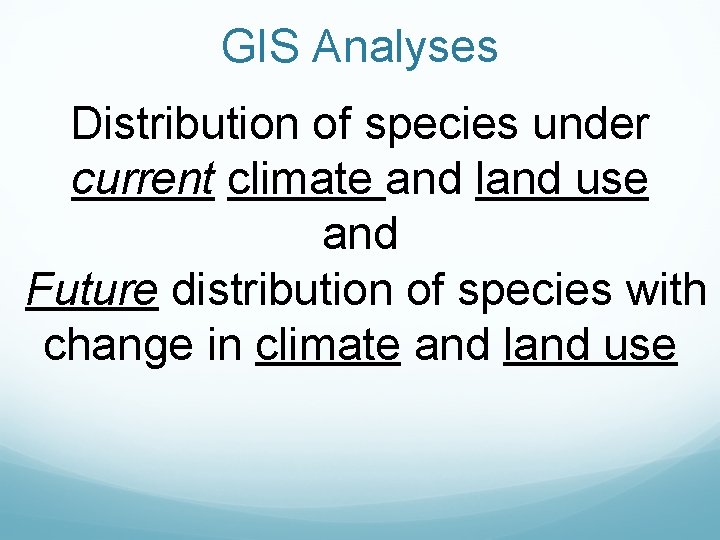
GIS Analyses Distribution of species under current climate and land use and Future distribution of species with change in climate and land use
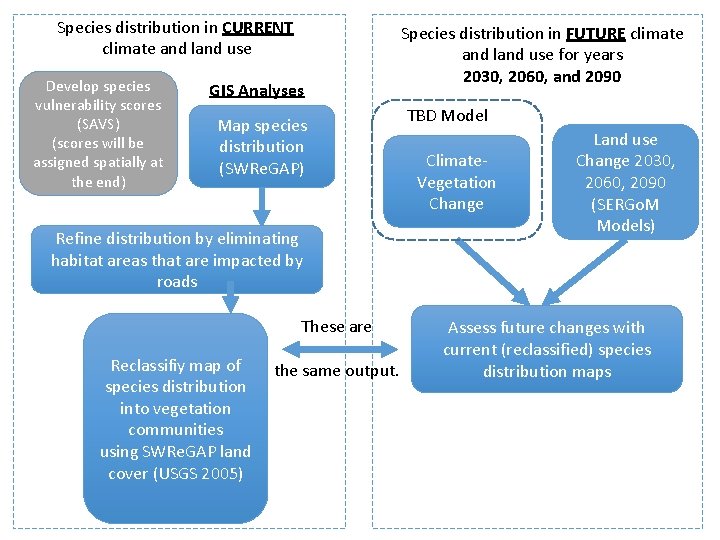
Species distribution in CURRENT climate and land use Develop species vulnerability scores (SAVS) (scores will be assigned spatially at the end) GIS Analyses Map species distribution (SWRe. GAP) Refine distribution by eliminating habitat areas that are impacted by roads These are Reclassifiy map of species distribution into vegetation communities using SWRe. GAP land cover (USGS 2005) the same output. Species distribution in FUTURE climate and land use for years 2030, 2060, and 2090 TBD Model Climate. Vegetation Change Land use Change 2030, 2060, 2090 (SERGo. M Models) Assess future changes with current (reclassified) species distribution maps
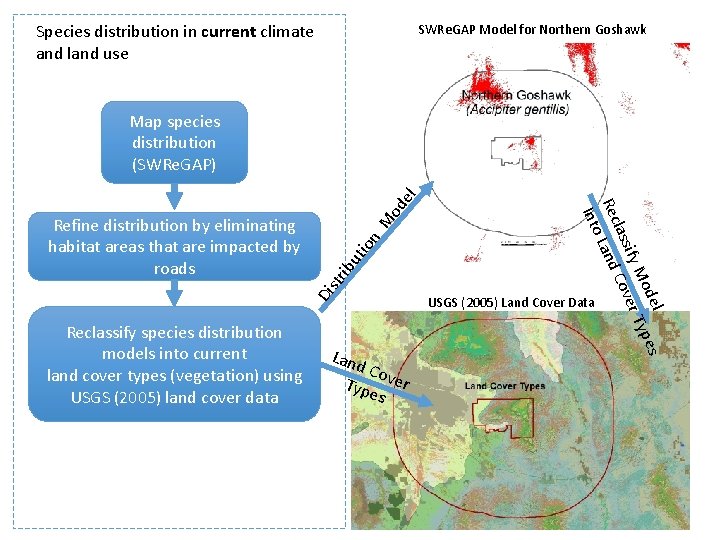
Species distribution in current climate and land use SWRe. GAP Model for Northern Goshawk od M n ibu tio str Di Refine distribution by eliminating habitat areas that are impacted by roads Reclassify species distribution models into current land cover types (vegetation) using USGS (2005) land cover data Lan d Co Typ ver es del es Mo r Typ e ify lass Cov Rec Land Into el Map species distribution (SWRe. GAP) USGS (2005) Land Cover Data
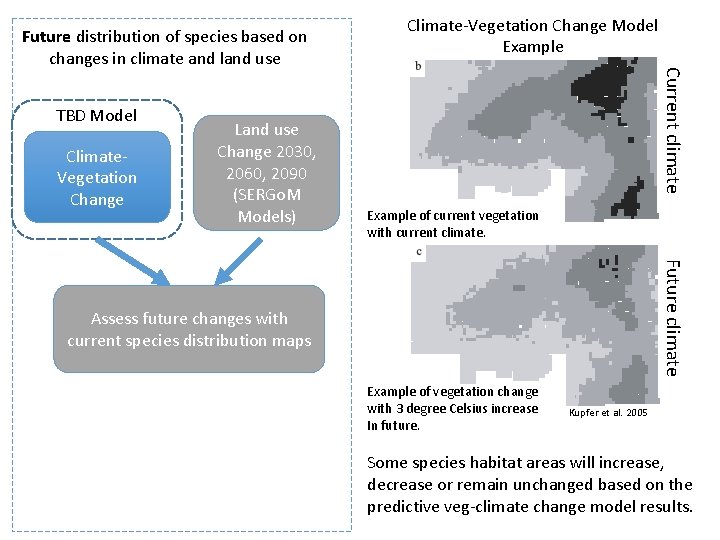
TBD Model Climate. Vegetation Change Land use Change 2030, 2060, 2090 (SERGo. M Models) Climate-Vegetation Change Model Example Current climate Future distribution of species based on changes in climate and land use Example of current vegetation with current climate. Future climate Assess future changes with current species distribution maps Example of vegetation change with 3 degree Celsius increase In future. Kupfer et al. 2005 Some species habitat areas will increase, decrease or remain unchanged based on the predictive veg-climate change model results.
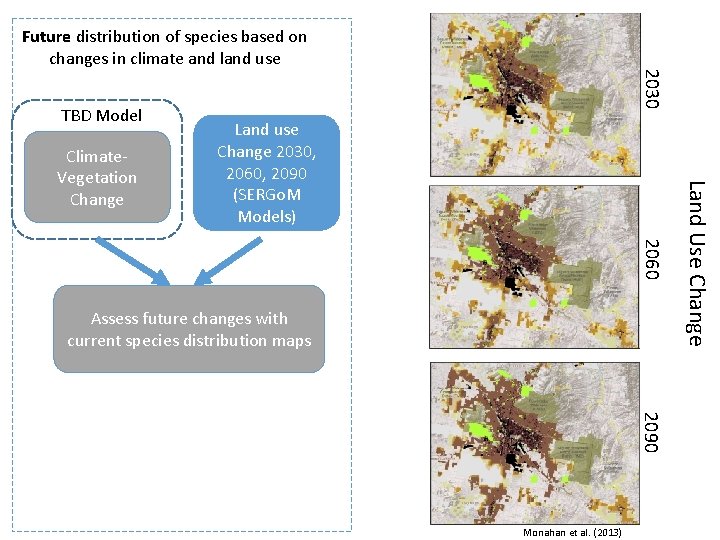
Future distribution of species based on changes in climate and land use Land use Change 2030, 2060, 2090 (SERGo. M Models) 2060 Assess future changes with current species distribution maps 2090 Monahan et al. (2013) Land Use Change Climate. Vegetation Change 2030 TBD Model
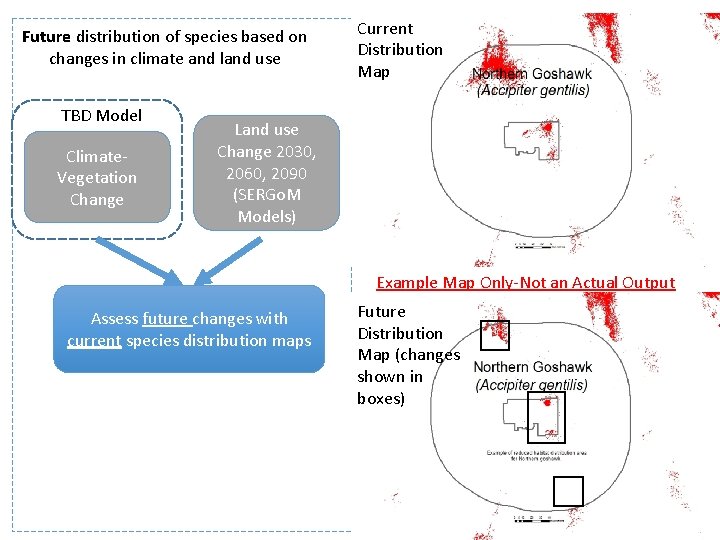
Future distribution of species based on changes in climate and land use TBD Model Climate. Vegetation Change Current Distribution Map Land use Change 2030, 2060, 2090 (SERGo. M Models) Example Map Only-Not an Actual Output Assess future changes with current species distribution maps Future Distribution Map (changes shown in boxes)
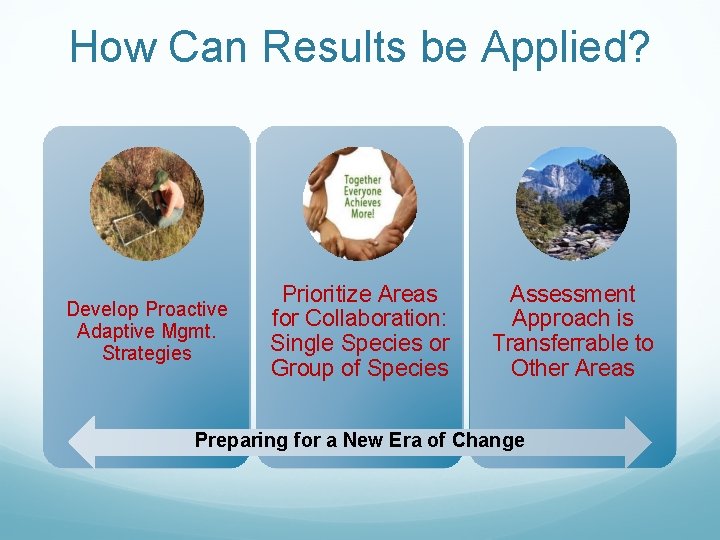
How Can Results be Applied? Develop Proactive Adaptive Mgmt. Strategies Prioritize Areas for Collaboration: Single Species or Group of Species Assessment Approach is Transferrable to Other Areas Preparing for a New Era of Change
Project Timeline Develop predictive vegetation response model to climate change temperature increase – mid January 2015 Species vulnerability assessments – mid February 2015 Habitat models adjusted for roads and assigned species vulnerability scores – mid March 2015 Projected housing density change effects to habitat – end March 2015 Assessment of high priority areas – mid April 2015 Assessment of conservation areas – early May 2015 Paper or presentation to be determined – May 2015
References Bagne KE, Friggens MM, Finch DM (2011) A system for assessing vulnerability of species (SAVS) to climate change. General Technical Report RMRS GTR 257. Fort Collins, CO: U. S. Department of Agriculture, Forest Service, Rocky Mountain Research Station. Clark, W. C. (1985) Scales of climate impacts. Climatic Change, 7, 5 27. Coe SJ, Finch DM, Friggens MM (2011) An assessment of climate change and vulnerability of wildlife in the Sky Islands of the southwest. General Technical Report RMRS GTR XXX. Fort Collins, CO: U. S. Department of Agriculture, Forest Service, Rocky Mountain Research Station. Davison, J. E. , S. Coe, D. Finch, E. Rowland, M. Friggens, and L. J. Graumlich. 2011. Bringing indices of species vulnerability to climate change into geographic space: an assessment across the Coronado National Forest. Biodiversity Conservation 21: 189 204. Kupfer, J. A. , J. Balmat, and J. L. Smith. 2005. Shifts in the potential distribution of sky island plant communities in response to climate change. USDA Forest Service Proceedings RMRS P 36. Pages 485 490. Mc. Cormack, J. E. Huang, H. and Knowles, L. L. (2009) "Sky Islands" Encyclopedia of Islands. University of California Press: Berkeley, CA. Monahan, W. B. , J. E. Gross, L. K. Svancara, and T. Philippi. 2012. A guide to interpreting NPScape data and analyses. Natural Resource Technical Report NPS/NRSS/NRTR— 2012/578. National Park Service, Fort Collins, Colorado. Monahan, W. B. , D. E. Swann, and J. A. Hubbard. 2013. Landscape dynamics of Saguaro Na tional Park. Natural Resource Report NPS/NRSS/NRR— 2013/615. National Park Service, Fort Collins, Colorado. Monahan, W. B. and N. A. Fisichelli. 2014. Climate Exposure of US National Parks in a New Era of Change. PLo. S ONE 9(7): e 101302. doi: 10. 1371/journal. pone. 0101302. National Park Service. n. d. General Management Plan Saguaro National Park, Arizona. U. S. Department of the Interior. 403 p. National Park Service [NPS] SODN. 2014 a. Sonoran desert ecosystem. Available at http: //science. nature. nps. gov/im/units/sodn/sonoran. cfm#biome (accessed August 29, 2014). Patrick Birdwell, C. and S. Avila Vilegas, J. Neeley, and L. Misztal. et al. 2012. Mapping and Assessing the Environmental Impacts of Border Tactical Infrastructure in the Sky Island Region in Gottfried, Gerald J. ; Ffolliott, Peter F. ; Gebow, Brooke S. ; Eskew, Lane G. ; Collins, Loa C. , comps. 2013. Merging science and management in a rapidly changing world: Biodiversity and management of the Madrean Archipelago III; 2012 May 1 5; Tucson, AZ. Proceedings. RMRS P 67. Fort Collins, CO: U. S. Department of Agriculture, Forest Service, Rocky Mountain Research Station.
References Pima County Association of Governments. n. d. Population growth. Avaialble at http: //www. pagnet. org/tabid/36/default. aspx(accessed Spetember 14, 2014). Sky Island Alliance. 2011 skyislandalliance. org (accessed November 1, 2011). SWRe. GAP (2011) SWRe. GAP animal habitat models. Available at http: //fws nmcfwru. nmsu. edu/swregap/habitatreview/instructions. htm. (accessed October 1, 2014). Theobald, D. M. 2005. Landscape patterns of exurban growth in the USA from 1980 to 2020. Ecology and Society 10: 32. (online) http: //www. ecologyandsociety. org United States Census Bureau. 2012. Table 1: Ranking of census 2000 and projected 2030 state population and change. Available at http: //www. census. gov/population/projections/data/state/projectionsagesex. html(accessed October 12, 2014). United States Geological Survey National Gap Analysis Program. 2005. Southwest Regional GAP Analysis Project—Land Cover Descriptions. RS/GIS Laboratory, College of Natural Resources, Utah State University. Warshall, P. 1995. The Madrean Sky Island Archipelago: A planetary overview. In: De. Bano, L. H. , P. F. Folliott, A. Ortega Rubio, G. Gottfried, R. H. Hamre, and C. B. Edminster, tech. coords. Biodiversity and management of the Madrean Archipelago: The Sky Islands of south western United States and northwestern Mexico. 1994 Sept. 19 23; Tucson, AZ. Gen. Tech. Rep. RM GTR 264. Fort Collins, CO: U. S. Department of Agriculture, Forest Service, Rocky Mountain Forest and Range Experiment Station. 669 p. Wiens, J. A. (1989) Spatial scaling in ecology. Functional Ecology, 3, 385 397.

Acknowledgements Thank you to Justine Blanford for her advisement.
![Questions? “We simply need that wild country available to us [and other species] Even](http://slidetodoc.com/presentation_image_h/226a7b0ad7958d0139cbcc623957e016/image-34.jpg "Questions? “We simply need that wild country available to us [and other species] Even")
Questions? “We simply need that wild country available to us [and other species] Even if we never do more than drive to its edge and look in. For it can be a means of reassuring ourselves of our sanity as creatures. a part of the geography of hope. ” Wallace Stegner View of Rincon Mountain Photo Credit: Sonoran Desert NPS
- Slides: 34